San Antonio Economic Indicators

The San Antonio economy expanded temperately in May. The unemployment rate ticked down further, while the San Antonio Business-Cycle Index decelerated to a pace close to its long-term trend. Payrolls declined last month and grew slightly during the three months through May. The professional and business service sector posted solid growth, while leisure and hospitality saw weakness. Wages ticked up, and housing permits declined.
Business-Cycle Index
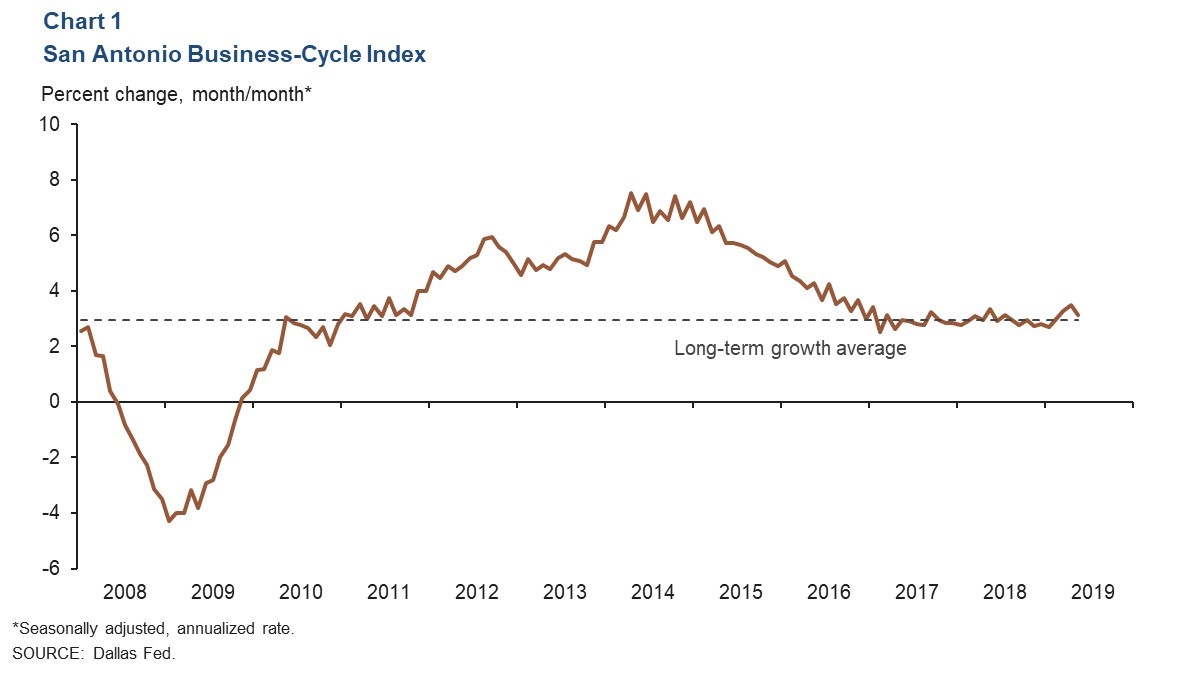
The San Antonio Business-Cycle Index—a broad measure of economic activity—decelerated to an annualized rate of 3.1 percent in May, slightly above the long-term average of 3.0 percent (Chart 1).
Labor Market
Unemployment Rate Declines
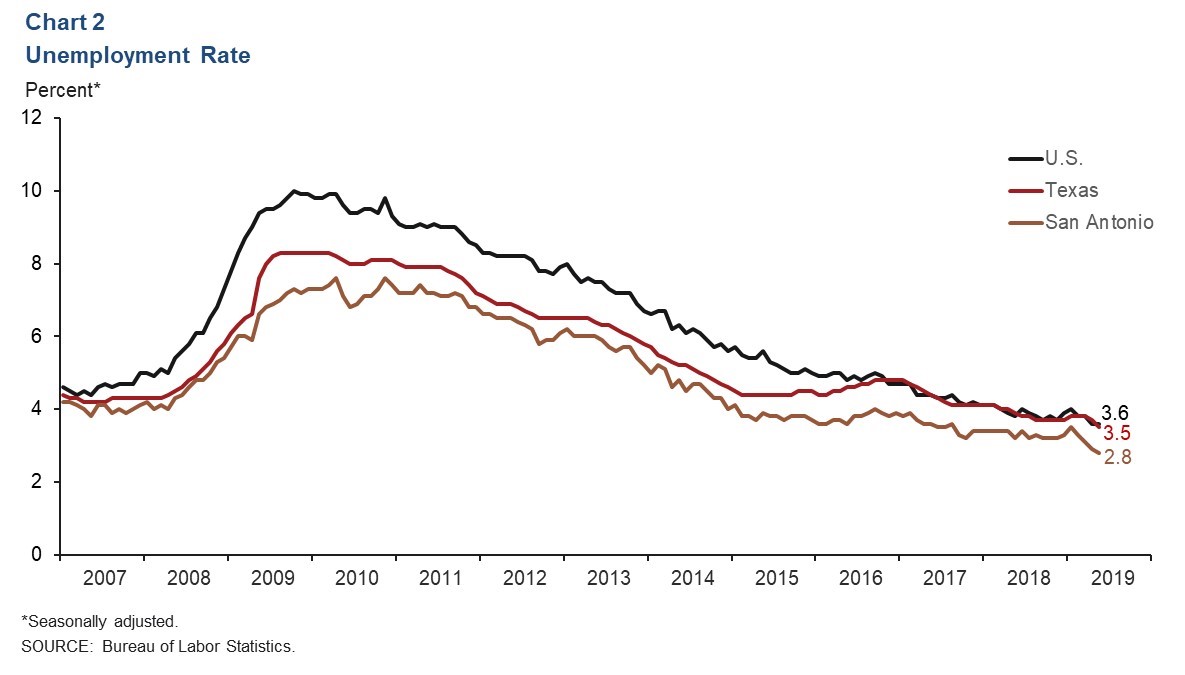
The San Antonio unemployment rate ticked down for the fourth consecutive month, to 2.8 percent in May (Chart 2). This is significantly lower than the state’s 3.5 percent and nation’s 3.6 percent rates. The metro’s labor force has contracted at an annualized rate of 0.2 percent so far this year.
Job Growth Mixed
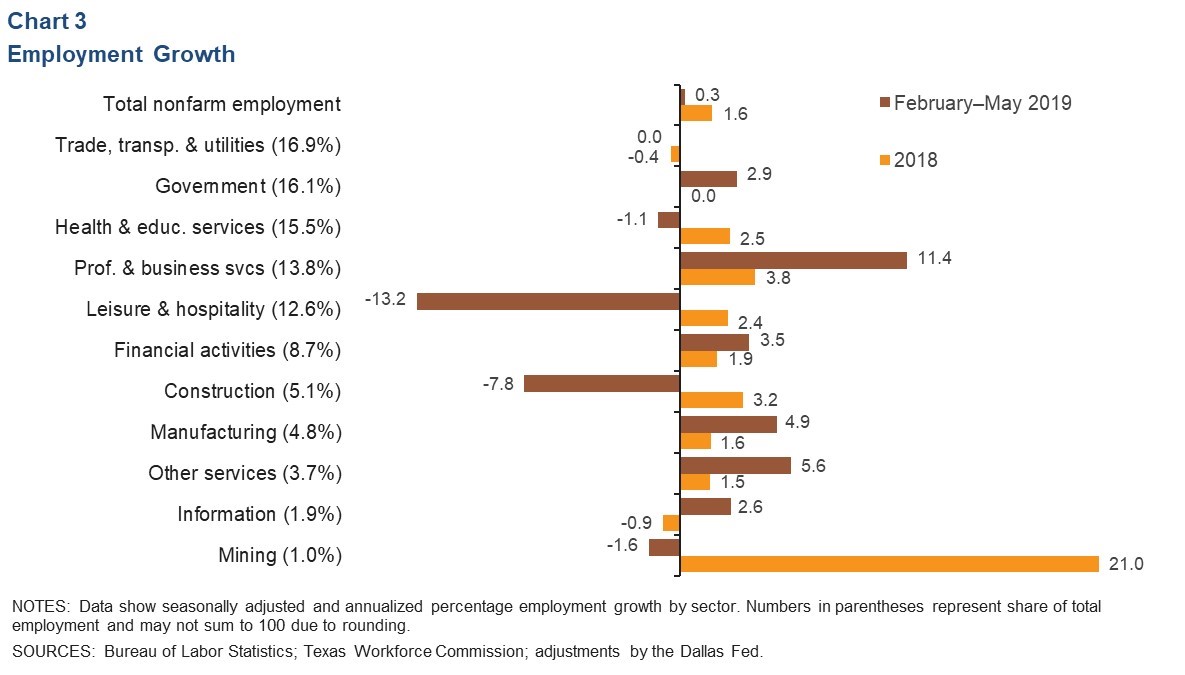
The San Antonio metro area added payrolls at a mild annualized rate of 0.3 percent in the three months ending in May (Chart 3). Professional and business services led growth with an expansion of 11.4 percent (annualized), or 3,900 net jobs. Manufacturing and financial activities also expanded at a healthy pace, adding 600 and 800 net jobs, respectively. Two areas of weakness were leisure and hospitality, which contracted a staggering 13.2 percent (a loss of approximately 4,800 net jobs), and construction, which shed roughly 1,100 jobs.
Wages Tick Up
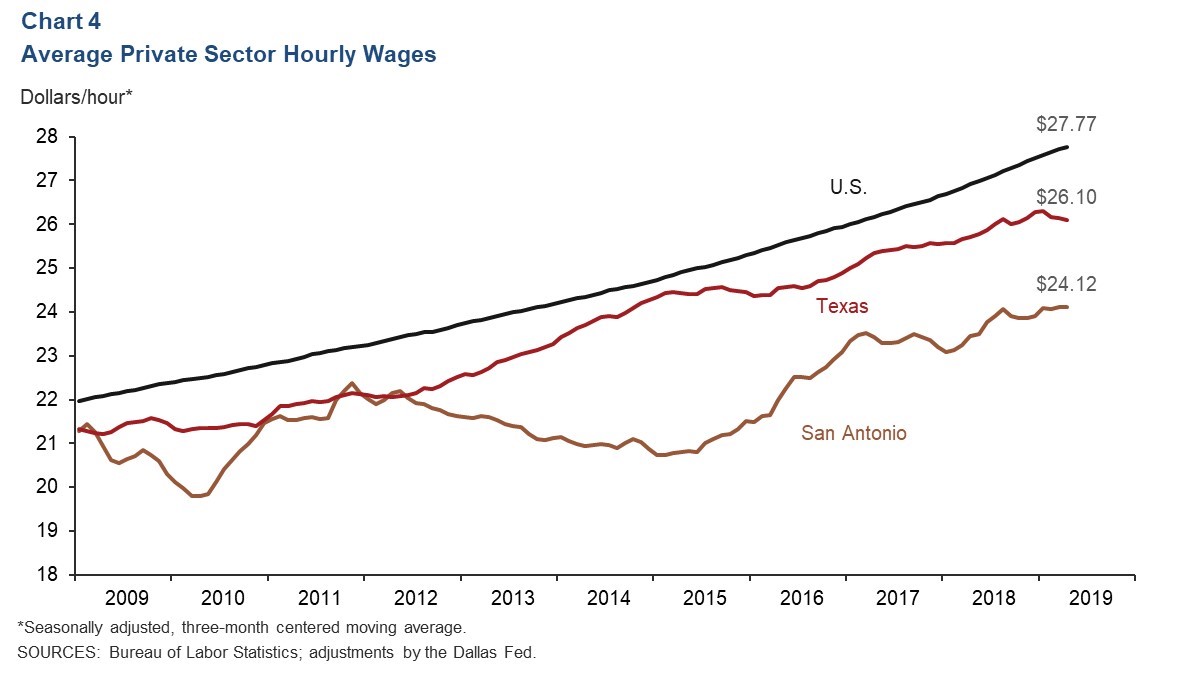
The three-month average for private sector hourly wages in San Antonio increased slightly to $24.12 in May (Chart 4). Year over year, hourly wages grew 3.6 percent—above the state’s 1.7 percent and nation’s 3.1 percent increases.
Real Estate
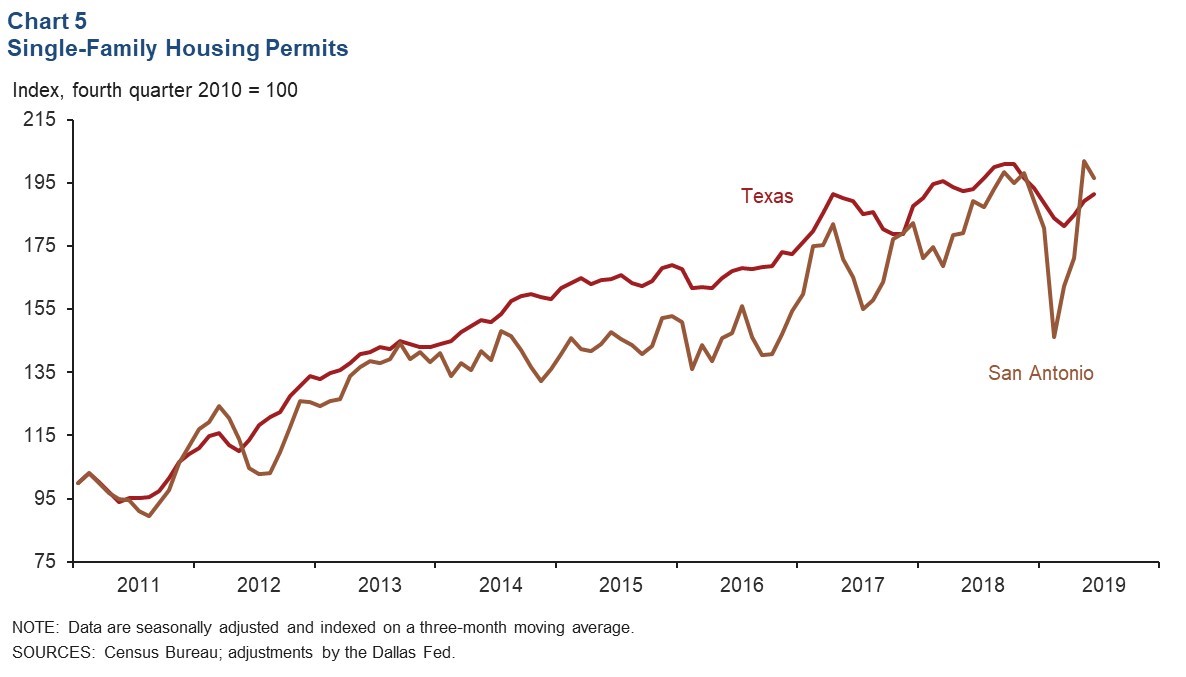
Single-family home construction permits for San Antonio declined slightly in May (Chart 5). During the first five months of this year, total permits issued in San Antonio are down 1.2 percent compared with the same period last year, whereas Texas permits are lower by 3.9 percent. As of May, home inventories remained at 3.6 months of supply, well below the six months considered a balanced market.
Stock Prices
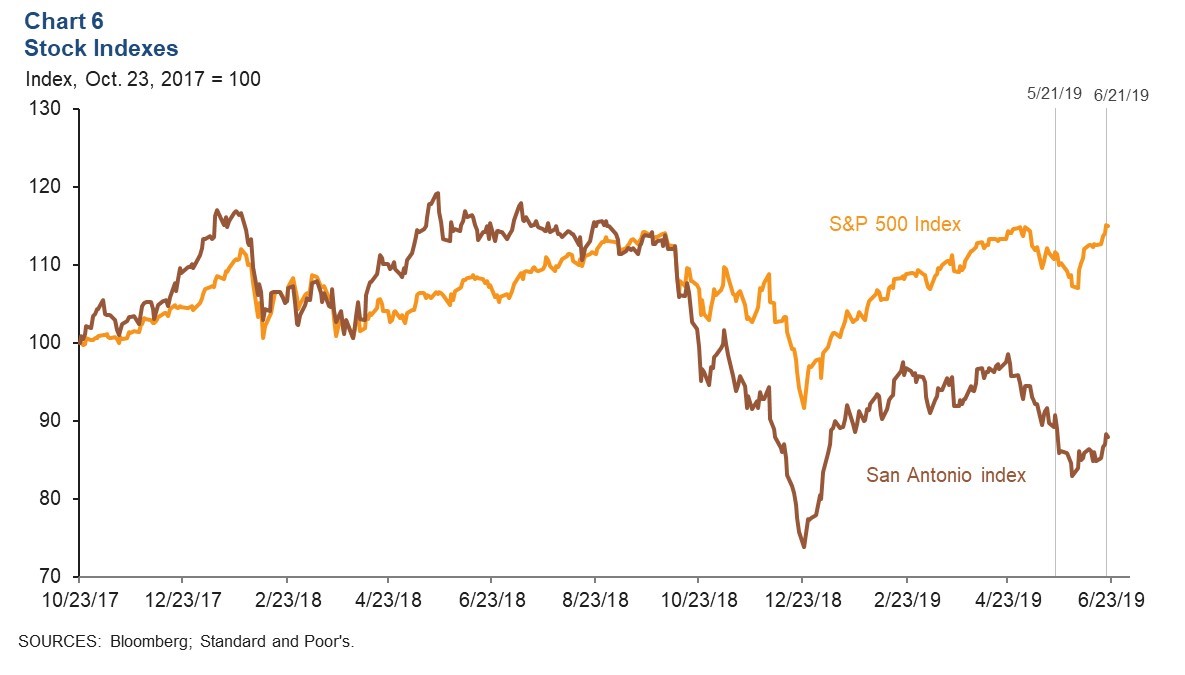
Stock prices of companies with a notable presence in San Antonio retreated 3.1 percent from May 21 to June 21, while the S&P 500 Index expanded 3 percent (Chart 6). Performance by sector was mixed. Energy companies associated with transportation and pipeline work saw declines in stock prices during this period, while those in refining saw no change. Firms within the communications, food services and financial industries saw stock prices weaken. Share prices of manufacturing firms remained relatively unchanged.
NOTE: Data may not match previously published numbers due to revisions.
About San Antonio Economic Indicators
Questions can be addressed to Judy Teng at judy.teng@dal.frb.org. San Antonio Economic Indicators is published every month on the Thursday after state and metro employment data are released.