San Antonio Economic Indicators

The San Antonio economy grew at a steady pace in July. Tight labor markets persisted, with unemployment rates low and labor force growth tepid. The San Antonio Business-Cycle Index grew, albeit below the long-term trend, and job growth increased in the most recent period. Private sector wages continued to rise, and home sales trended upward.
Business-Cycle Index
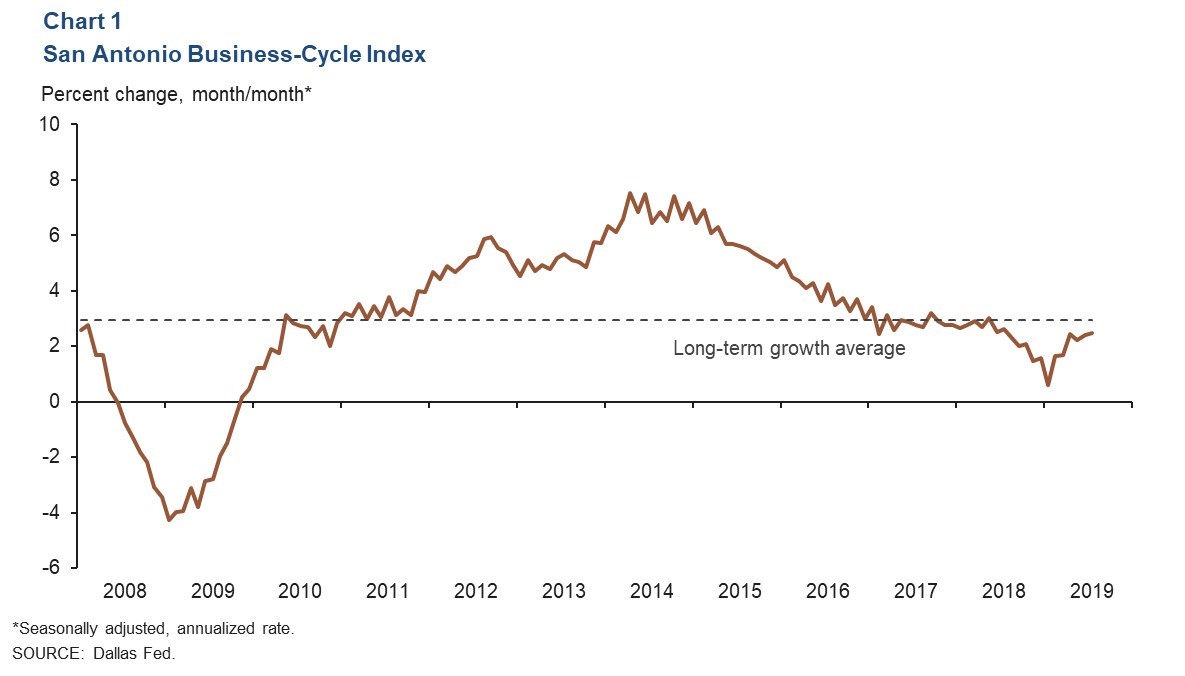
The San Antonio Business-Cycle Index—a broad measure of economic activity in the metro—accelerated to an annualized rate of 2.5 in July, marginally below its long-term trend of 2.9 percent (Chart 1). The recently released first-quarter 2019 benchmark for metro employment, one of four index components, resulted in significant downward revisions to growth in the index. Nonetheless, recent upticks in the index, propelled by lower unemployment rates and faster job growth, suggest overall healthy growth in the region’s economy.
Labor Market
Labor Market Remains Tight
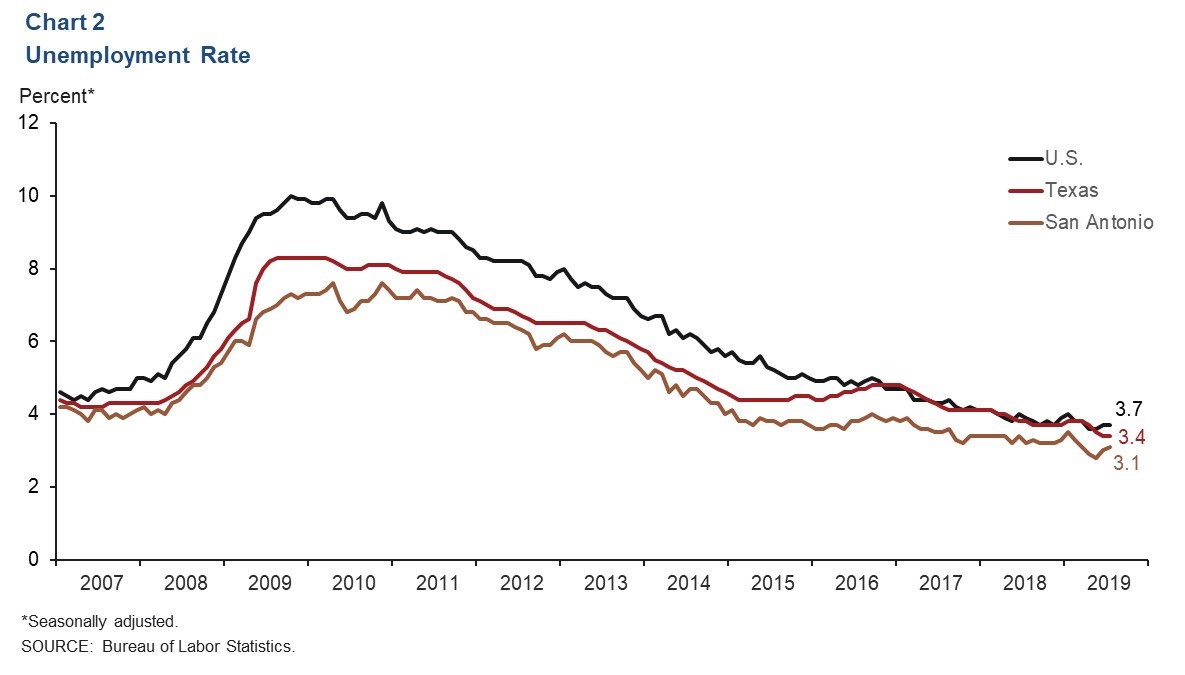
The labor market continues to be tight in the San Antonio metro. The unemployment rate ticked up slightly to a still-low 3.1 percent in July, while the state and national rates were unchanged (Chart 2). Weak labor force growth is likely restraining job growth in the area. During the first seven months of the year, the metro’s labor force growth was negligible at an annualized rate of 0.1 percent, well below the 2 percent pace in 2018 and 1.7 percent rate in 2017.
Recent Job Growth Steady
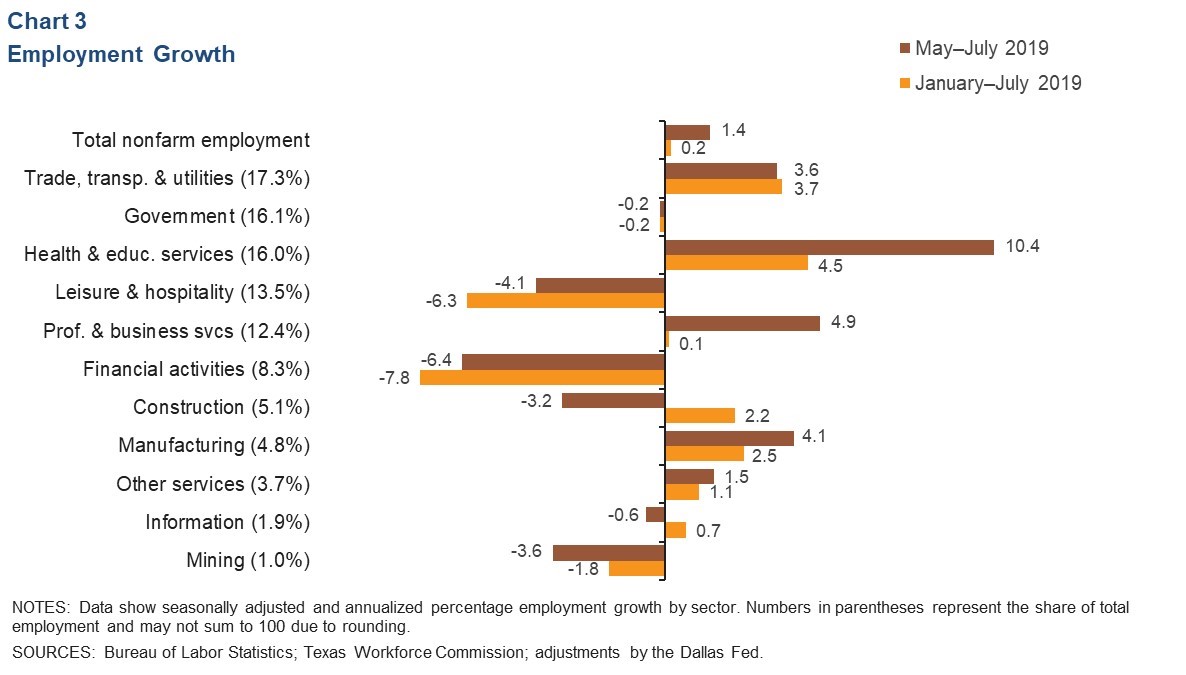
The first-quarter benchmark adjustment released in mid-August resulted in a significant downward revision to job growth in that quarter—from 3.1 percent to -1.5 percent. Nonetheless, recent data show continued job growth in the San Antonio metro area. In the three months ending in July, payrolls expanded at a 1.4 percent annualized rate, with growth mixed across industries (Chart 3). Health and private education services expanded 10.4 percent (annualized), adding approximately 4,200 net jobs. Professional and business services grew at a strong 4.9 annualized rate, led by employment related to administrative, waste management and remediation services. The manufacturing and trade, transportation and utilities sectors also posted healthy performances. Areas of weakness were concentrated in financial activities (-1,500 jobs), leisure and hospitality (-1,400 jobs), construction (-450 jobs) and mining (-100 jobs).
Wages Climb
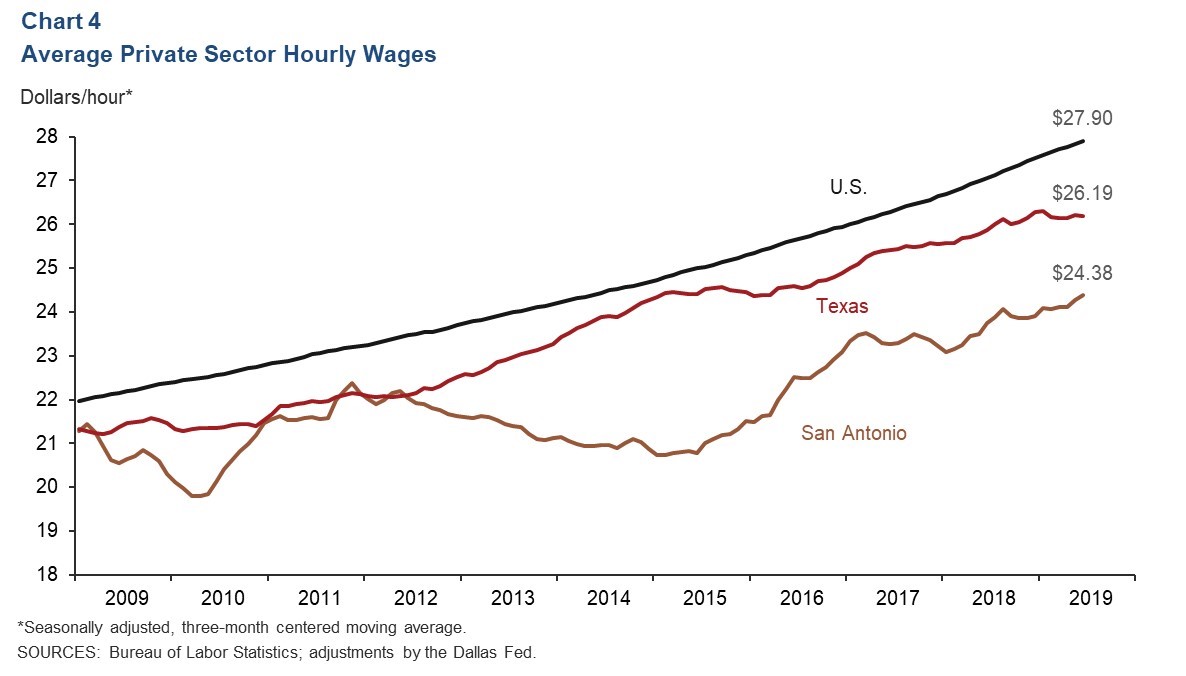
The three-month average for private sector hourly wages in San Antonio increased to $24.38 in July (Chart 4). Year over year, hourly wages rose 0.8 percent in the metro, above the state’s 0.3 percent decline but below the nation’s 3.2 percent increase.
Real Estate
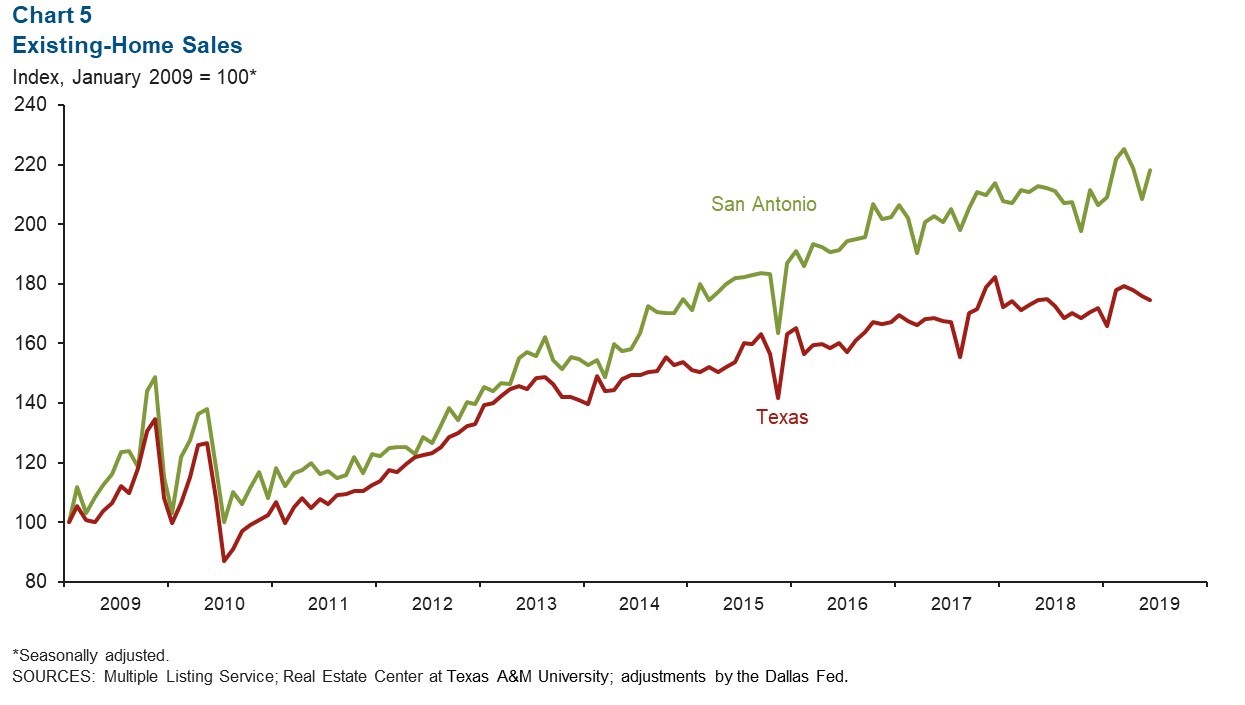
The housing market posted healthy numbers in July. The real median sales price for houses rose to $232,011. This year through July, home sales in the metro increased 3.1 percent relative to the same period last year, while existing-home sales at the state level rose 1.5 percent (Chart 5). Inventory in the metro remained at 3.6 months of supply, well below the six months considered a balanced market.
Stock Prices
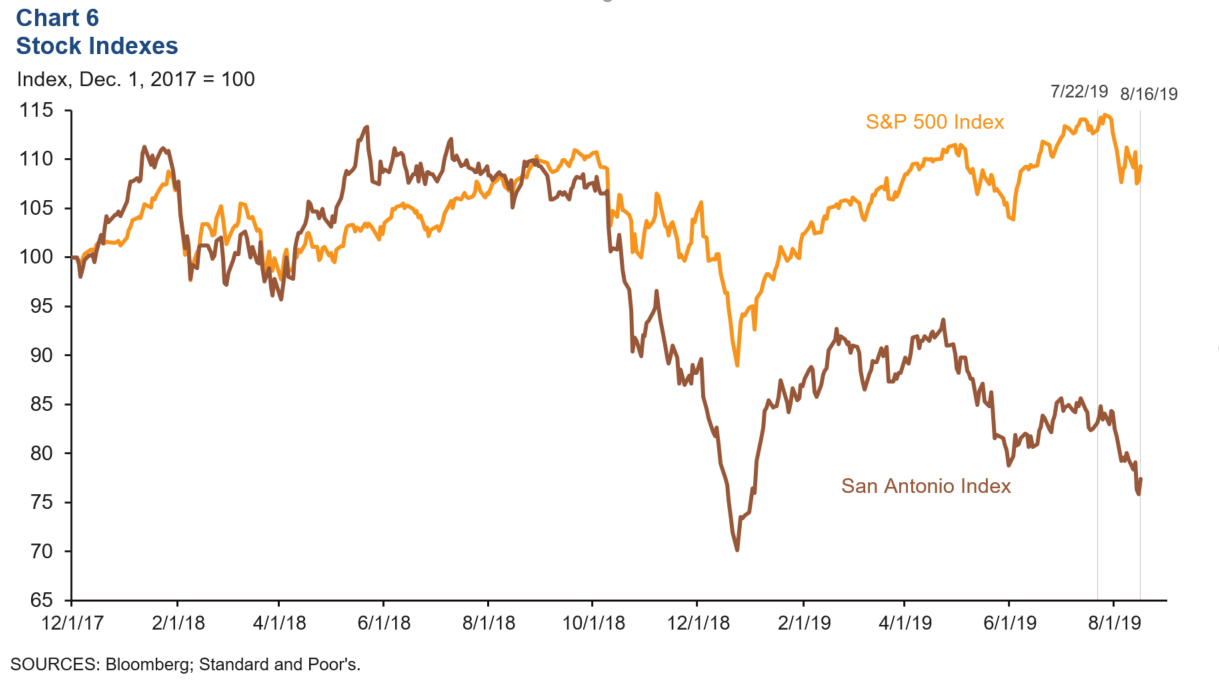
Share prices of companies with a notable presence in San Antonio saw a substantial drop of 6.9 percent from July 22 to Aug. 16 (Chart 6). The S&P 500 Index decreased 3.2 percent during the same period. Performance was mixed across industries. Manufacturing firms saw stock prices rise. Companies associated with food services and communication had mixed performances, while those related to the energy sector, especially firms within exploration and production, saw large declines. Stock prices of firms in the financial sector also dropped.
NOTE: Data may not match previously published numbers due to revisions.
About San Antonio Economic Indicators
Questions can be addressed to Judy Teng at judy.teng@dal.frb.org. San Antonio Economic Indicators is published every month on the Thursday after state and metro employment data are released.