San Antonio Economic Indicators

January 3, 2020
San Antonio’s economy turned in a healthy performance in November. The San Antonio Business-Cycle Index continued to expand above its long-term average, and recent job growth was strong. Wages continued to climb. Recent home sales increased, while office demand increased in the third quarter.
Business-Cycle Index
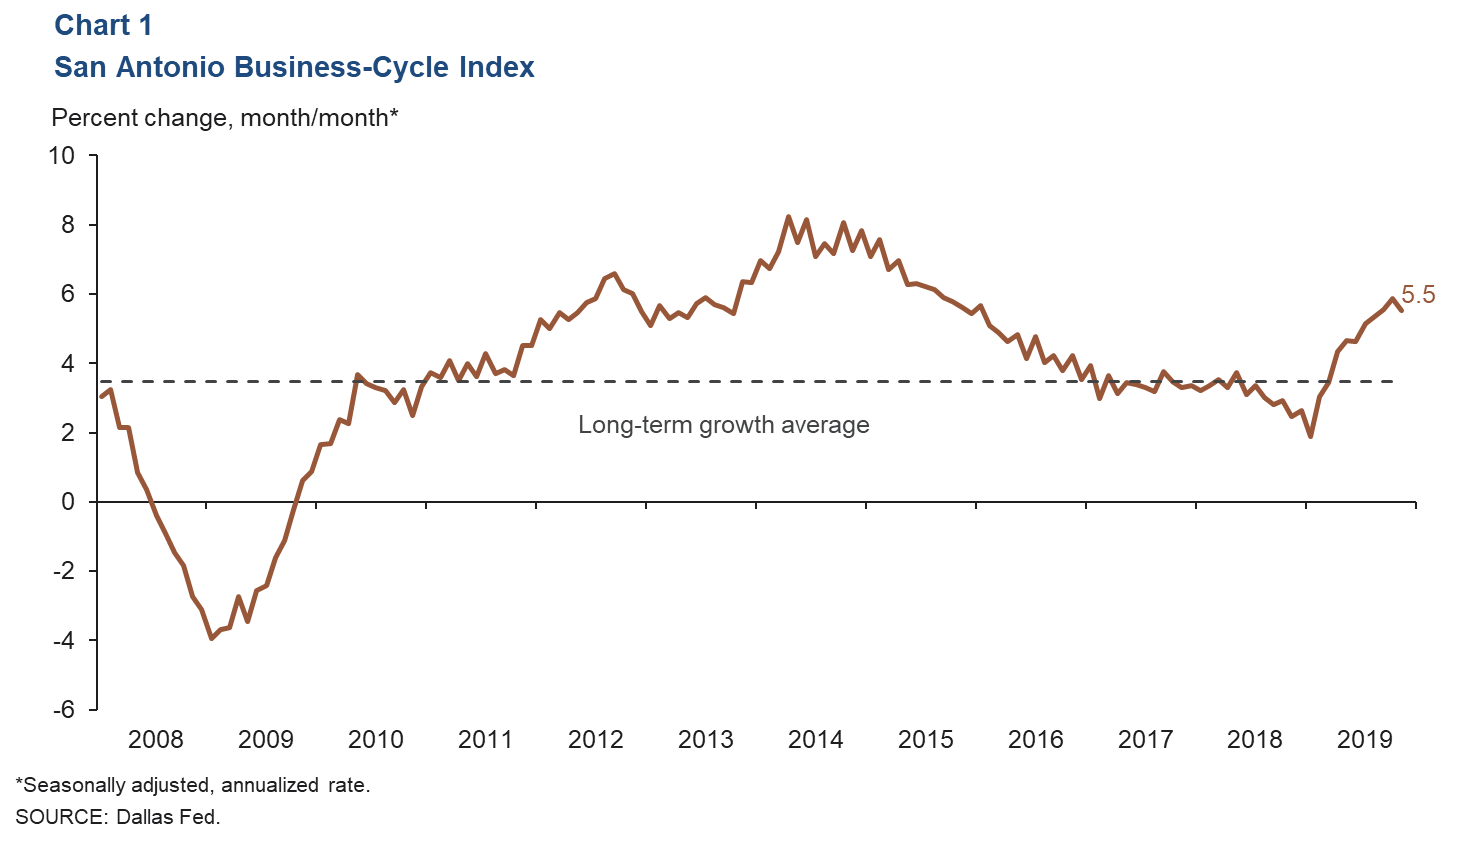
The San Antonio Business-Cycle Index—a broad measure of economic activity in the metro—grew an annualized 5.5 percent in November, well above the long term average of 3.5 percent (Chart 1). Recent strength in the index indicated continued expansion in the San Antonio economy.
Labor Market
Unemployment Rate Unchanged
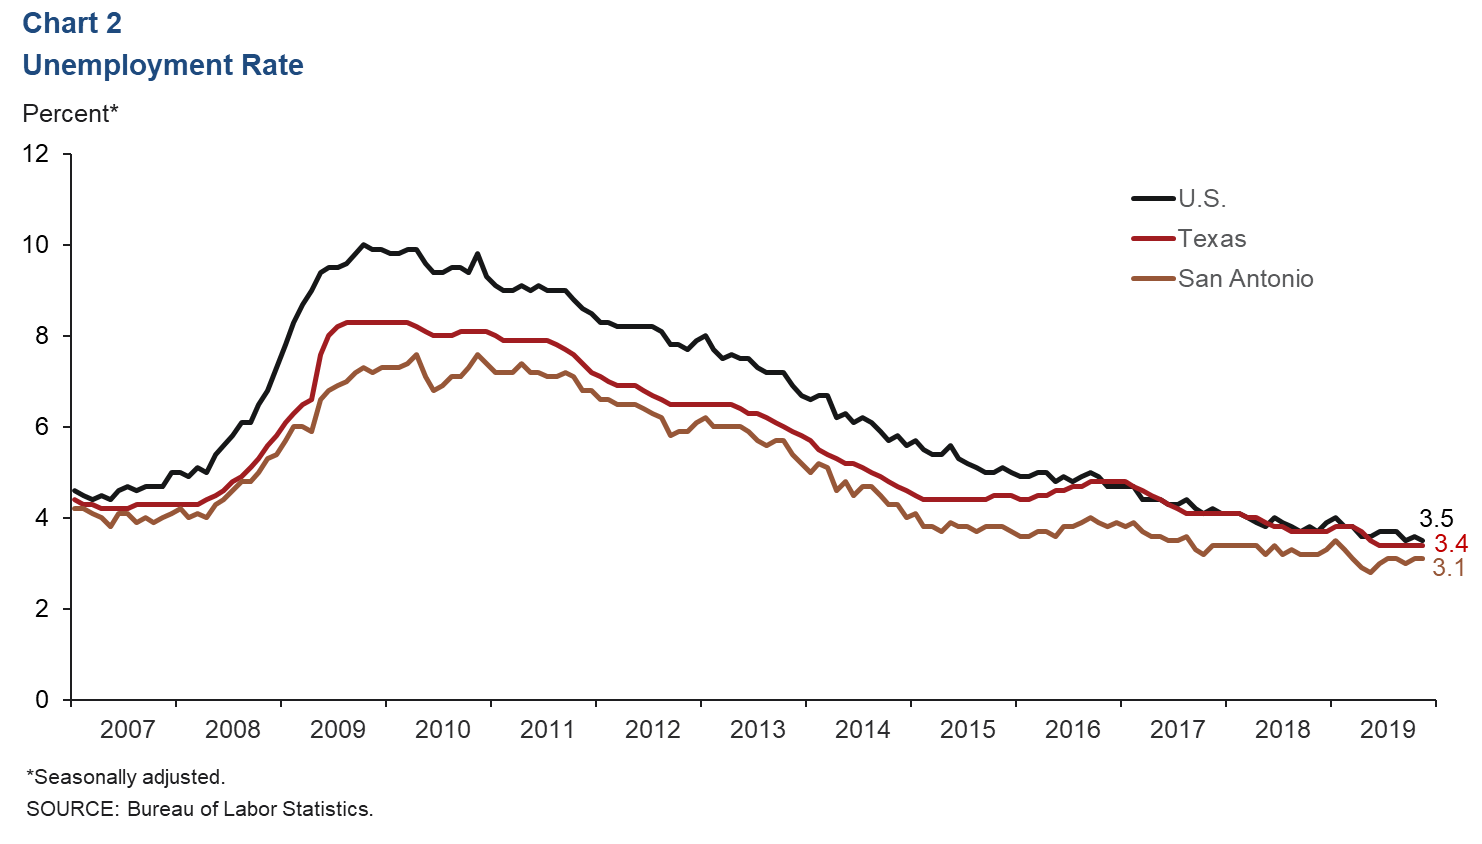
Tight labor markets persist in San Antonio. The metro unemployment rate held at 3.1 percent in November, while the state rate lingered at 3.4 percent for the fifth consecutive month and the U.S. rate dropped to 3.5 percent (Chart 2). During the first 11 months of 2019, San Antonio’s labor force expanded 2.5 percent, moderately above the long-term average growth rate of 2.1 percent.
Recent Job Growth Robust
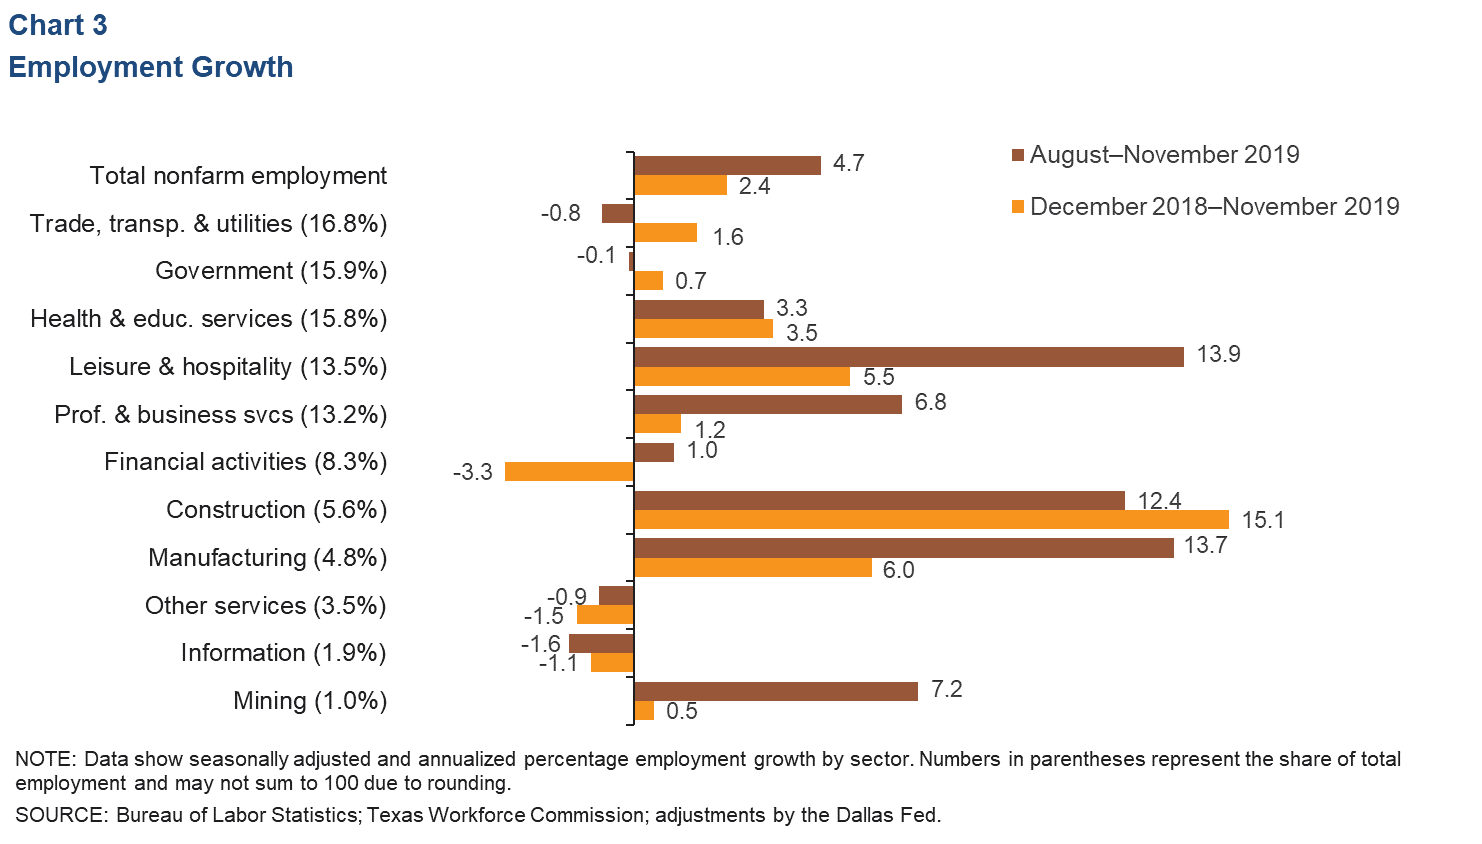
In the three months ending in November, the metro added jobs at a strong annualized pace of 4.7 percent (Chart 3). Growth during this period was broad based across sectors. Leisure and hospitality led the expansion with a robust 13.9 percent increase (4,600 net jobs). Manufacturing (13.7 percent, or 1,700 jobs), construction (12.4 percent, or 1,800 jobs) and mining (7.2 percent, or 180 jobs) also posted healthy growth. Recent areas of weakness include information (-1.6 percent, or 85 net job losses) and trade, transportation and utilities (-0.8 percent, or 370 job losses).
Metro Wages Increase
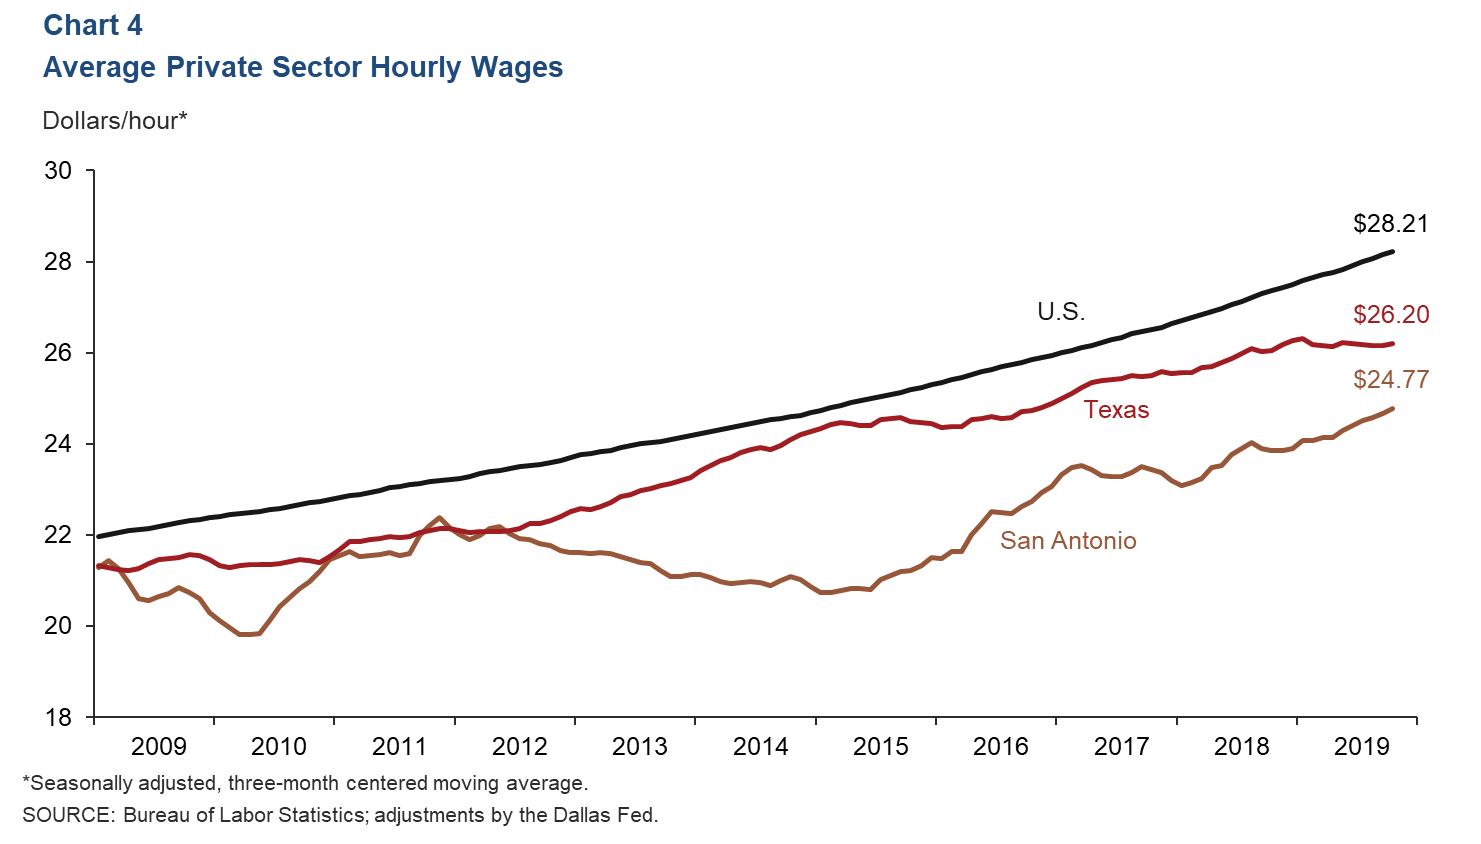
The three-month average for private sector hourly wages in San Antonio increased to $24.77 in November (Chart 4). Relative to the same period last year, metro wages rose 3.8 percent, greater than the state and national gains of 0.6 percent and 3.1 percent, respectively.
Real Estate
Home Prices Decline
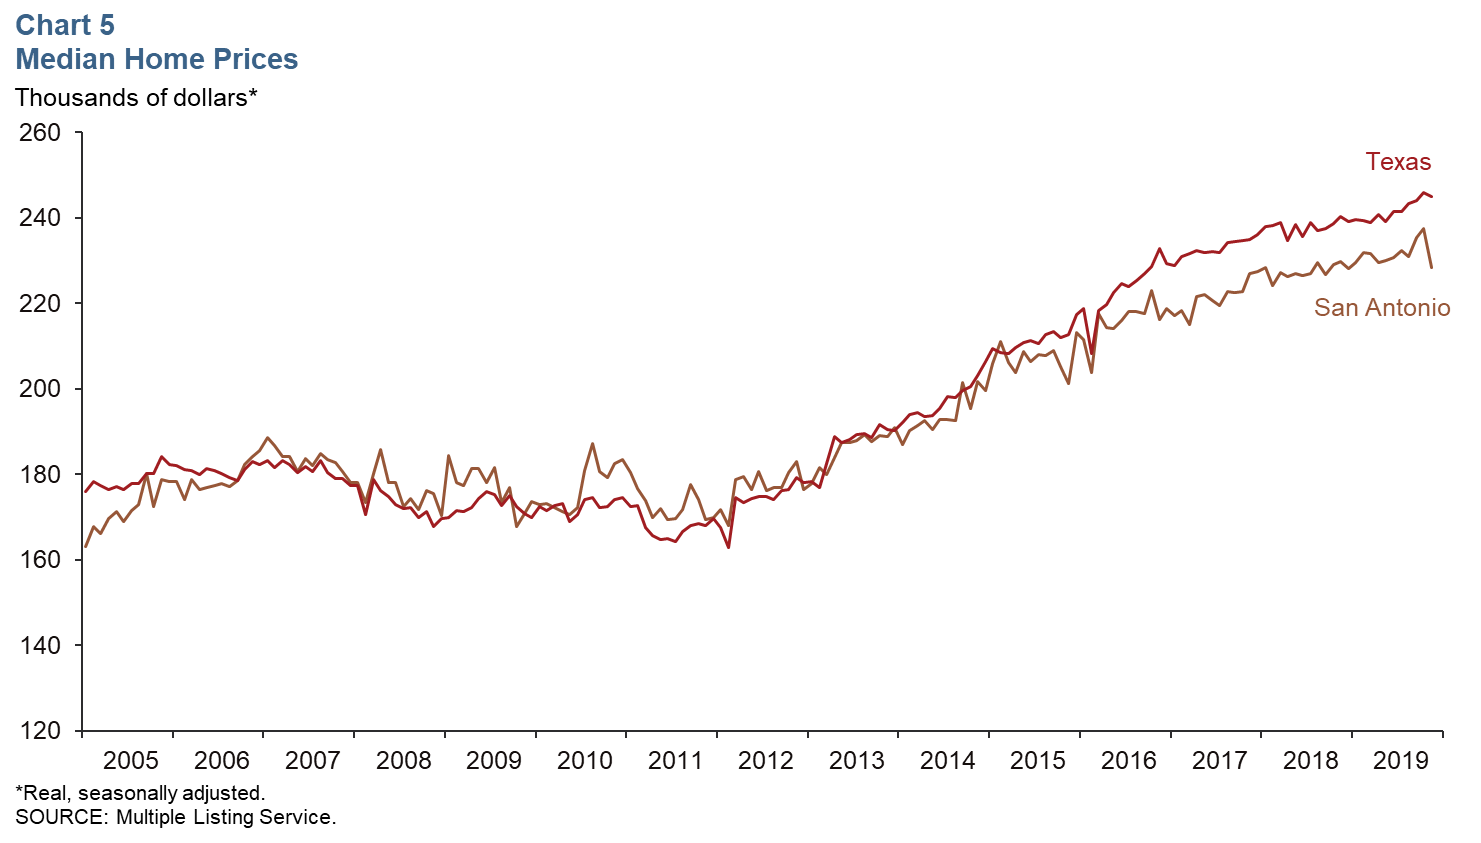
As of November, the median sales price of a home fell to $228,432 in San Antonio and $244,875 in Texas (Chart 5). In the first 11 months of 2019, sales grew 5.5 percent relative to the same period in 2018, well above the state’s 3.4 percent. Inventory levels in San Antonio stood at 3.7 months, well below the six months considered a balanced market.
Office Space Demand Rises
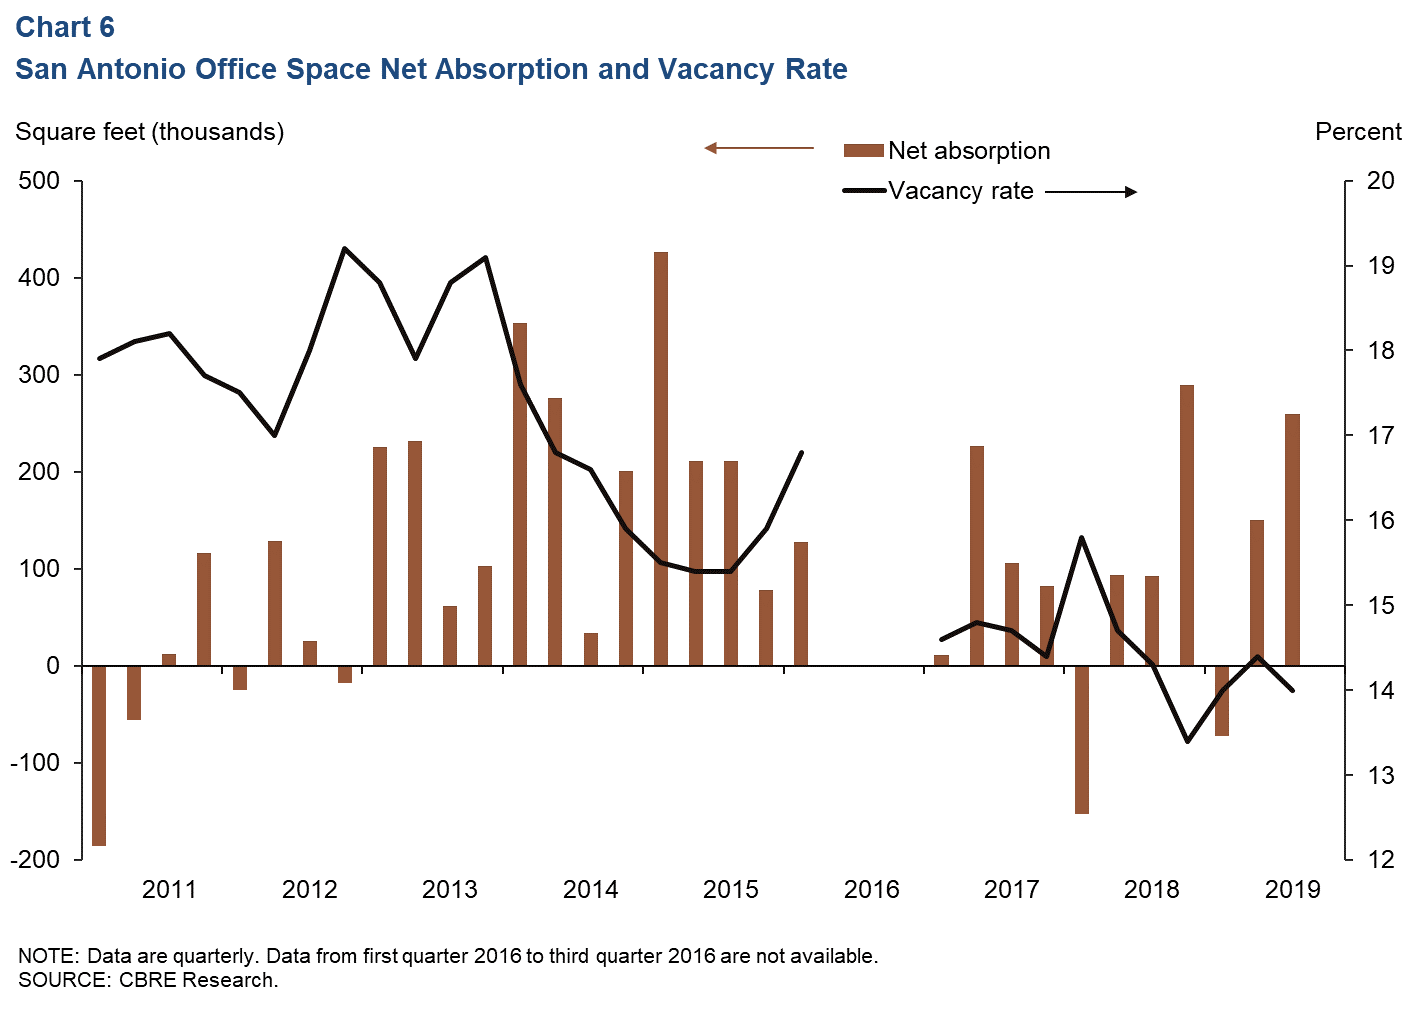
Demand for office space increased in third quarter 2019 (Chart 6). Net absorption was 259,503 square feet, the highest reading since fourth quarter 2018. The vacancy rate ticked down to 14.0 percent, the second-lowest rate of all major Texas metros (Austin’s rate is the lowest at 9.9 percent). Average asking rents increased 1.6 percent from the previous quarter and7.0 percent year over year.
NOTE: Data may not match previously published numbers due to revisions.
NOTE: Data may not match previously published numbers due to revisions.
About San Antonio Economic Indicators
Questions can be addressed to Judy Teng at judy.teng@dal.frb.org. San Antonio Economic Indicators is published every month on the Thursday after state and metro employment data are released.