San Antonio Economic Indicators

January 31, 2020
San Antonio’s economy saw healthy growth in December. The San Antonio Business-Cycle Index continued to expand above its long-term average. The unemployment rate ticked down, and quarterly job growth was strong. Wages continued to climb, home sales increased, and office demand remained steady in fourth quarter 2019.
Business-Cycle Index
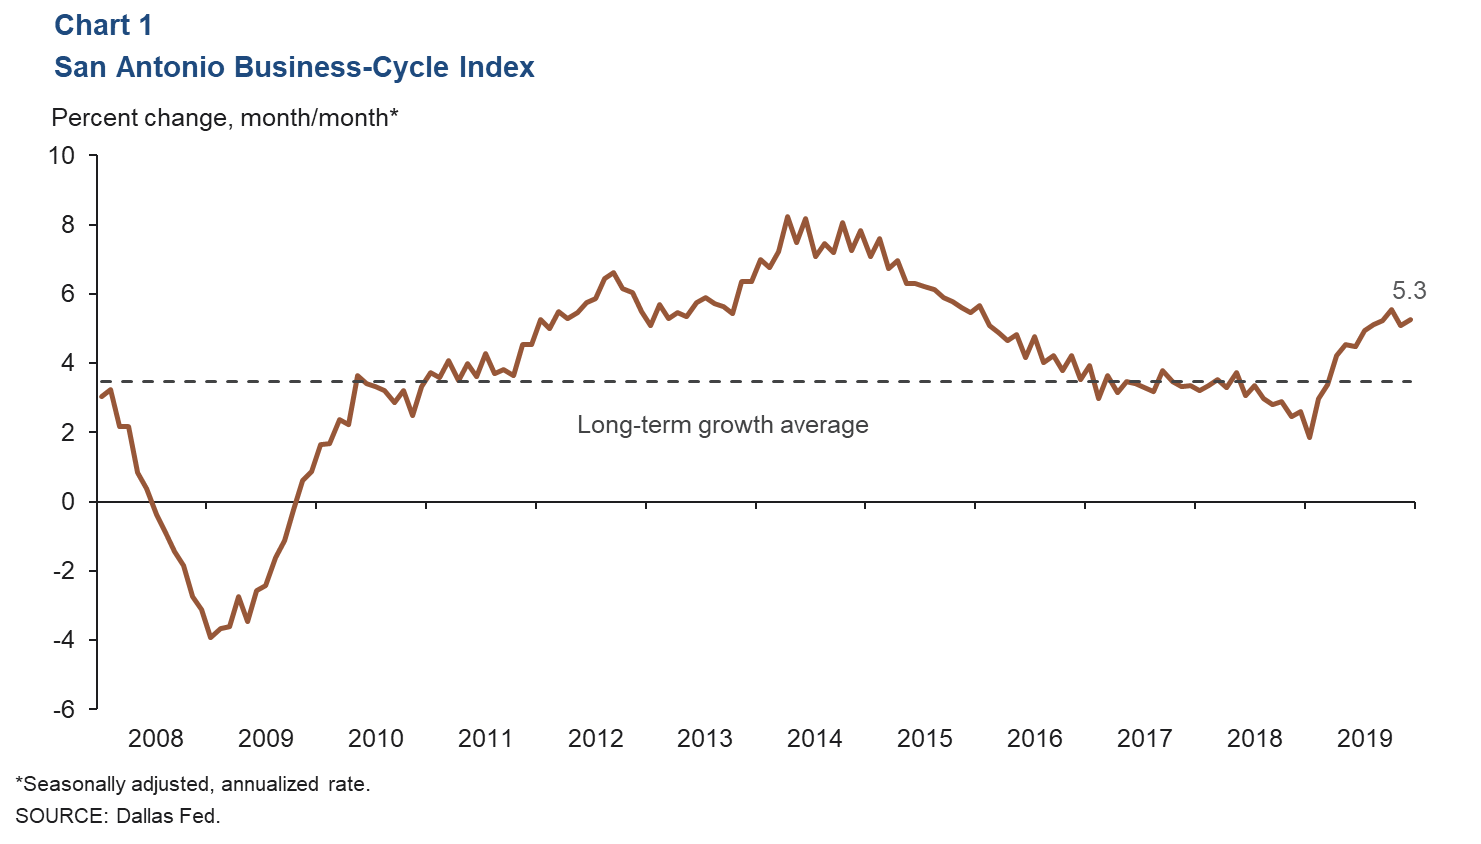
The San Antonio Business-Cycle Index—a broad measure of economic activity in the metro—expanded an annualized 5.3 percent in December, well above the long-term average of 3.5 percent (Chart 1). The recent strength in the index was due to solid job growth and a lower unemployment rate, suggesting continued growth in the San Antonio economy.
Labor Market
Unemployment Rate Declines
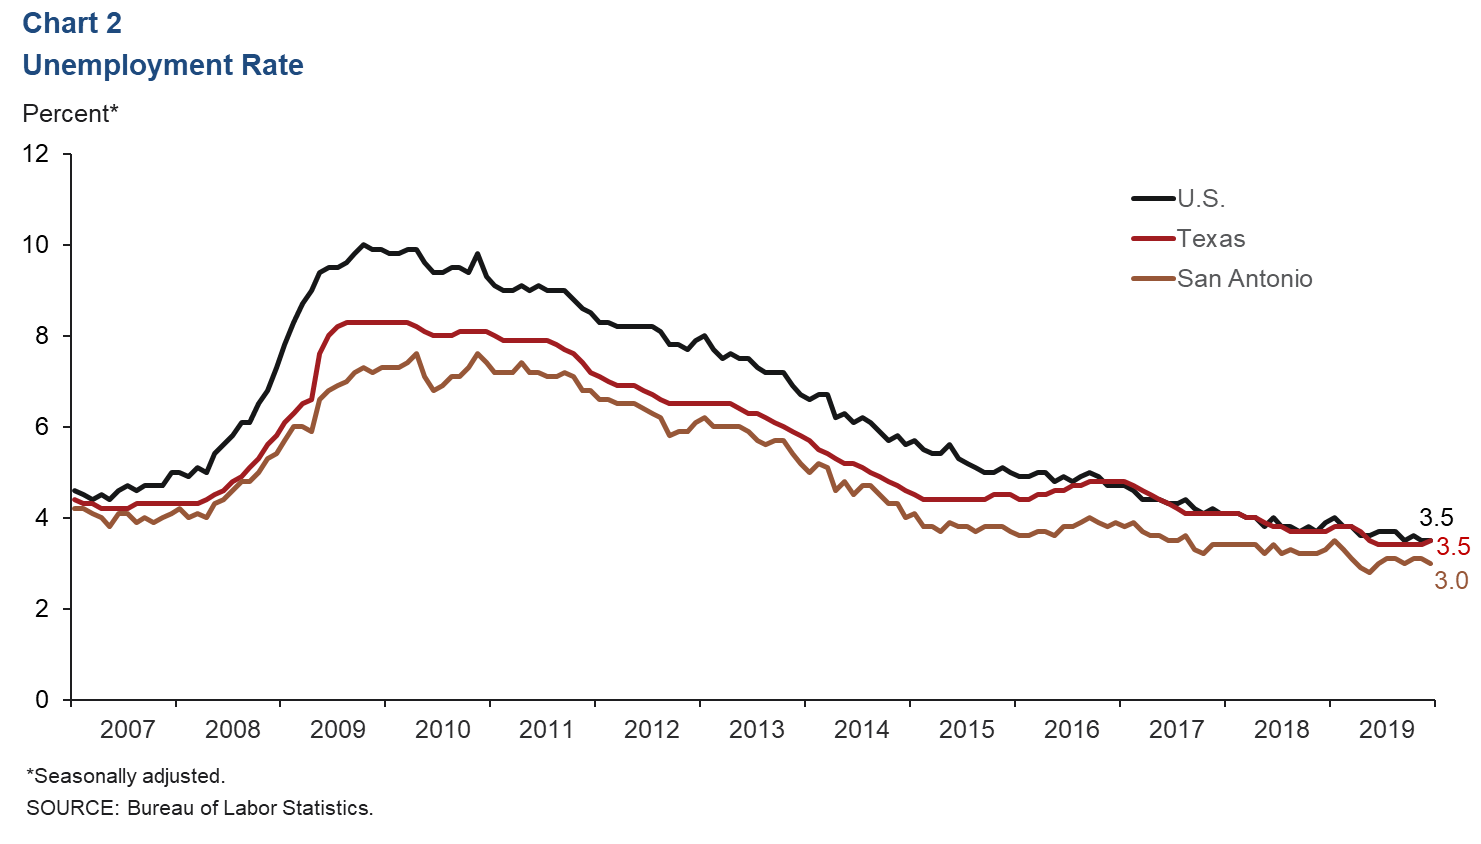
In December, the metro unemployment rate dropped to 3.0 percent, while the state jobless rate ticked up to 3.5 percent and the nation lingered at 3.5 percent (Chart 2). In 2019, San Antonio’s labor force expanded 2.1 percent, the same rate as the long-term average but slightly above 2018’s 2.0 percent.
Fourth-Quarter Job Growth Broad Based
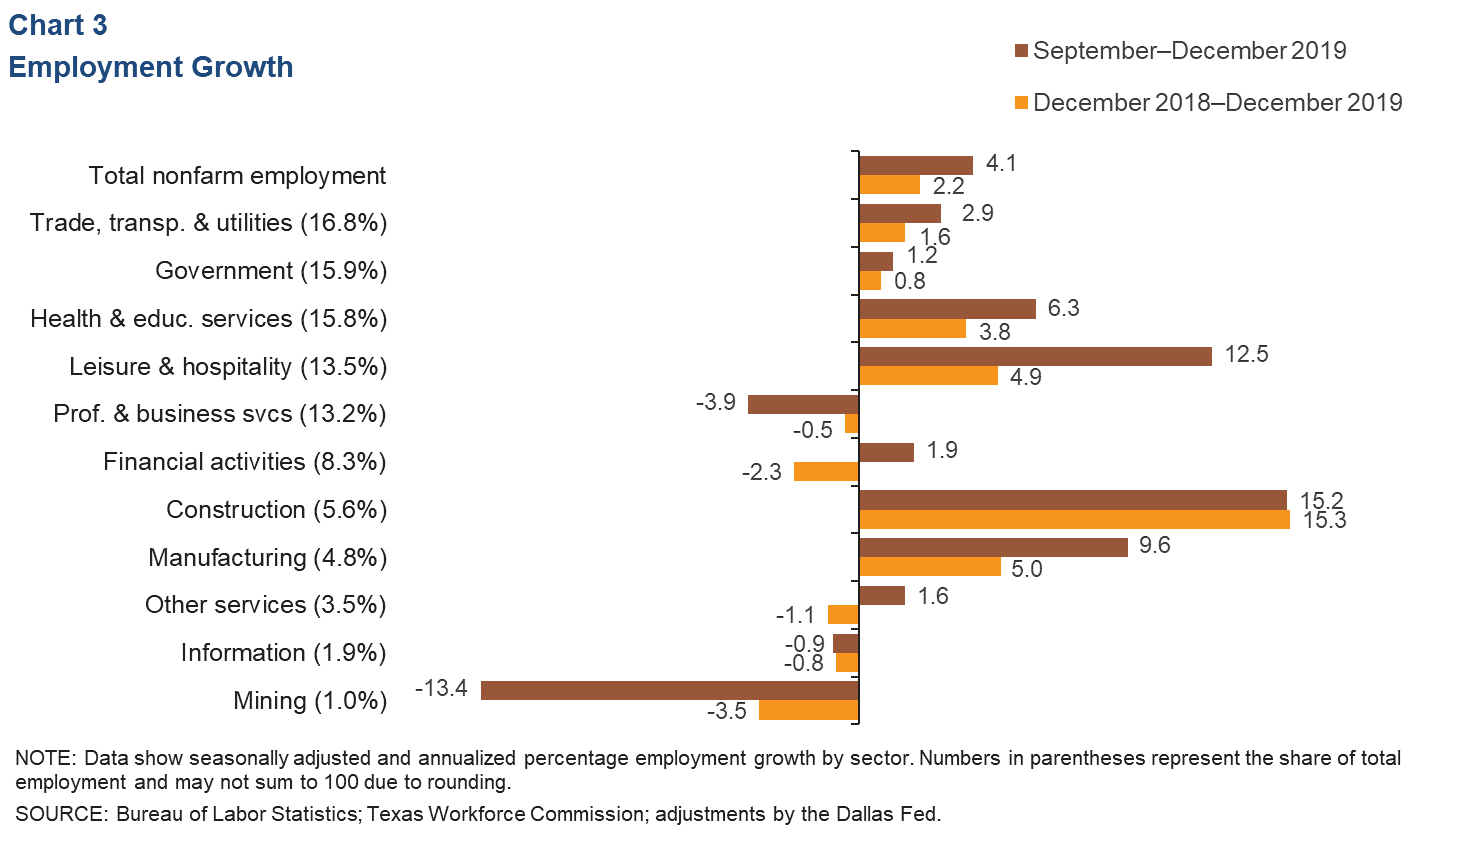
Payrolls in San Antonio grew at an annualized pace of 4.1 percent in the fourth quarter (Chart 3). Expansion during this period was broad based across sectors. Construction posted strong job gains (15.2 percent, or 2,160 net jobs). Leisure and hospitality (12.5 percent, or 4,190 jobs), manufacturing (9.6 percent, or 1,200 jobs) and health and education (6.3 percent, or 2,600 jobs) also turned in healthy performances. Areas of weakness included mining (-13.4 percent, or 370 net job losses) and professional and business services (-3.9 percent, or 1,400 job losses).
Metro Wages Increase
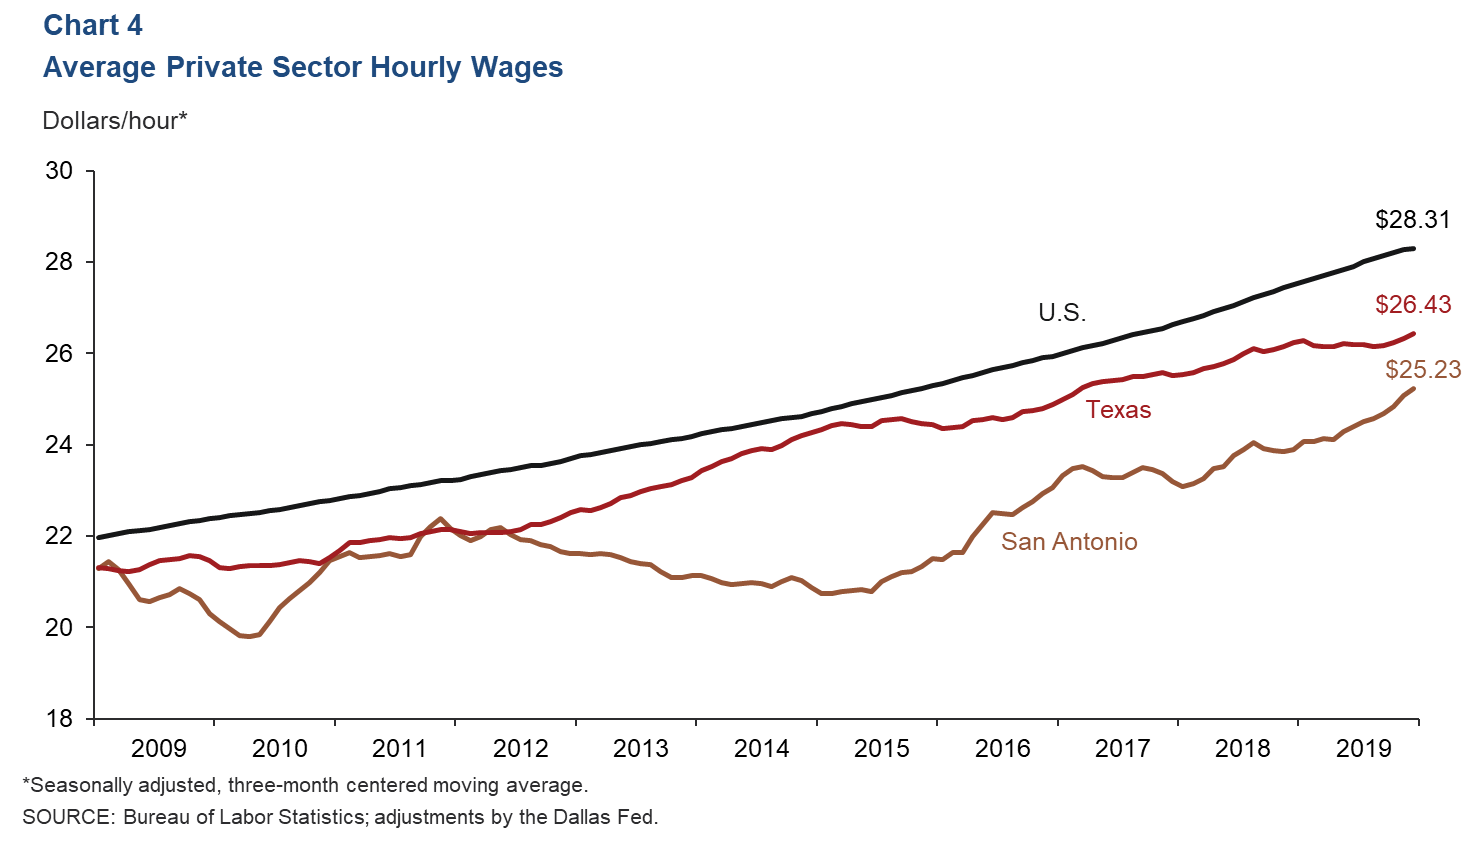
The three-month average for private sector hourly wages in San Antonio increased to $25.23 in December (Chart 4). Year over year, metro wages rose 5.7 percent, far greater than the Texas and U.S. increases of 0.7 percent and 2.9 percent, respectively.
Real Estate
Home Sales Rise in 2019
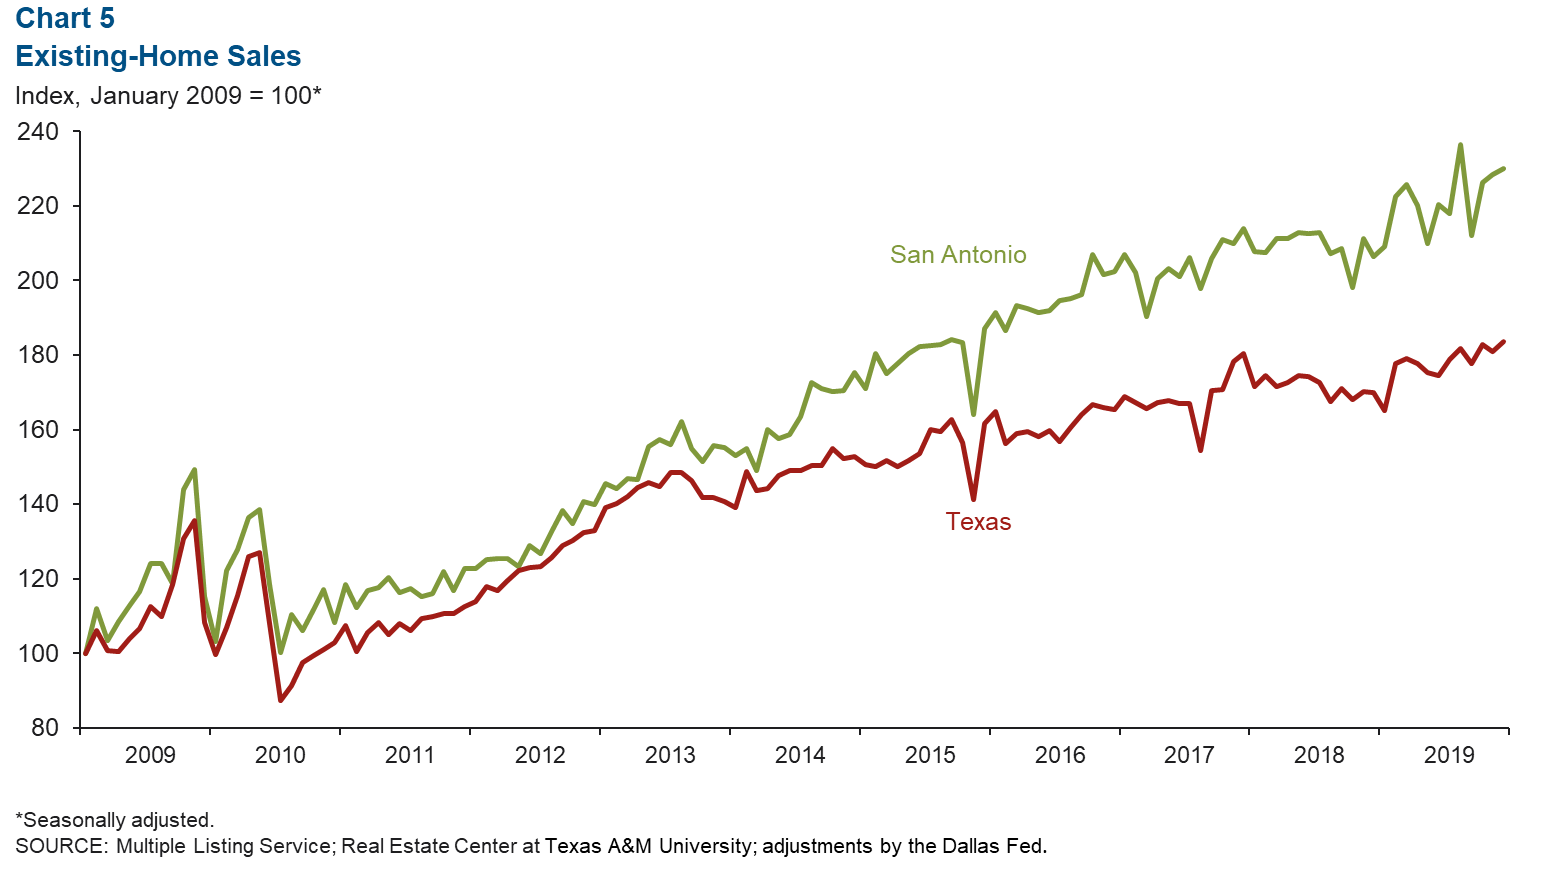
In 2019, total home sales in the metro grew 6.0 percent relative to 2018, considerably higher than the state’s 3.7 percent increase (Chart 5). As of December, the median sales price of a home stood at $235,021 in San Antonio and $247,104 in Texas. Inventory declined to 3.6 months, well below the six months considered a balanced market.
Office Space Demand Steady
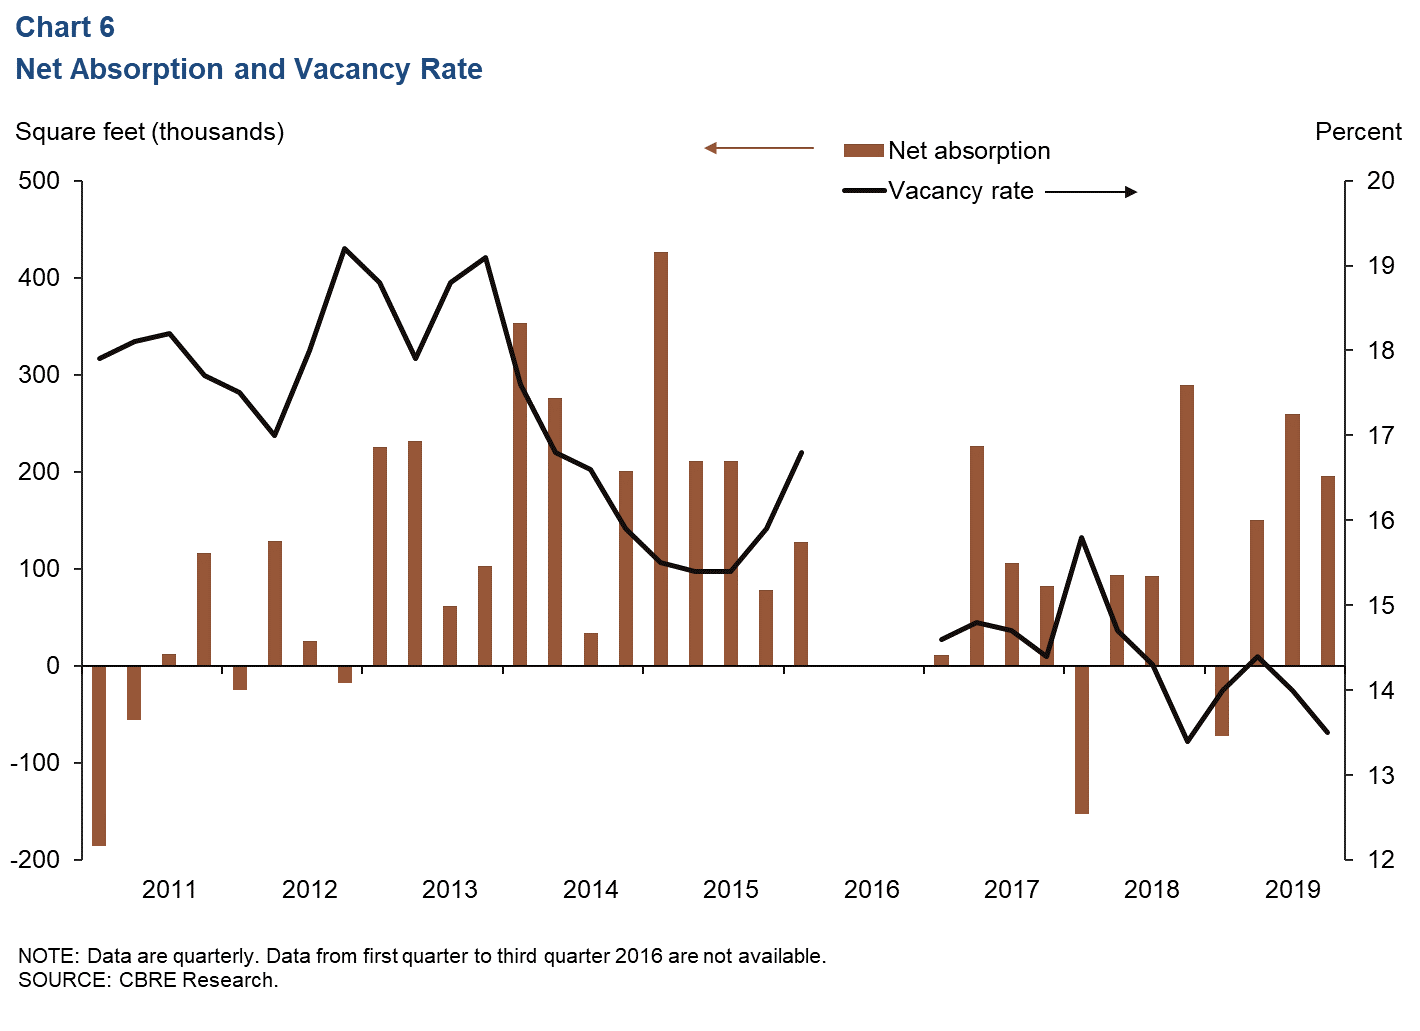
Demand for office space was steady in the fourth quarter (Chart 6). Net absorption was 195,830 square feet, and the vacancy rate ticked down to 13.5 percent, the second-lowest reading of all major Texas metros behind Austin at 9.9 percent. Average asking rents declined a slight 0.6 percent from the previous quarter but increased 8.4 percent year over year.
NOTE: Data may not match previously published numbers due to revisions.
About San Antonio Economic Indicators
Questions can be addressed to Judy Teng at judy.teng@dal.frb.org. San Antonio Economic Indicators is published every month on the Thursday after state and metro employment data are released.