San Antonio Economic Indicators

September 24, 2020
The San Antonio Business-Cycle Index grew at a healthy pace in August. The unemployment rate decreased slightly, and net jobs increased. Local consumer spending weakened slightly in mid-September. Home sales ticked down in August, and stock prices of San Antonio-based companies declined over the four weeks ending Sept. 21.
Business-Cycle Index
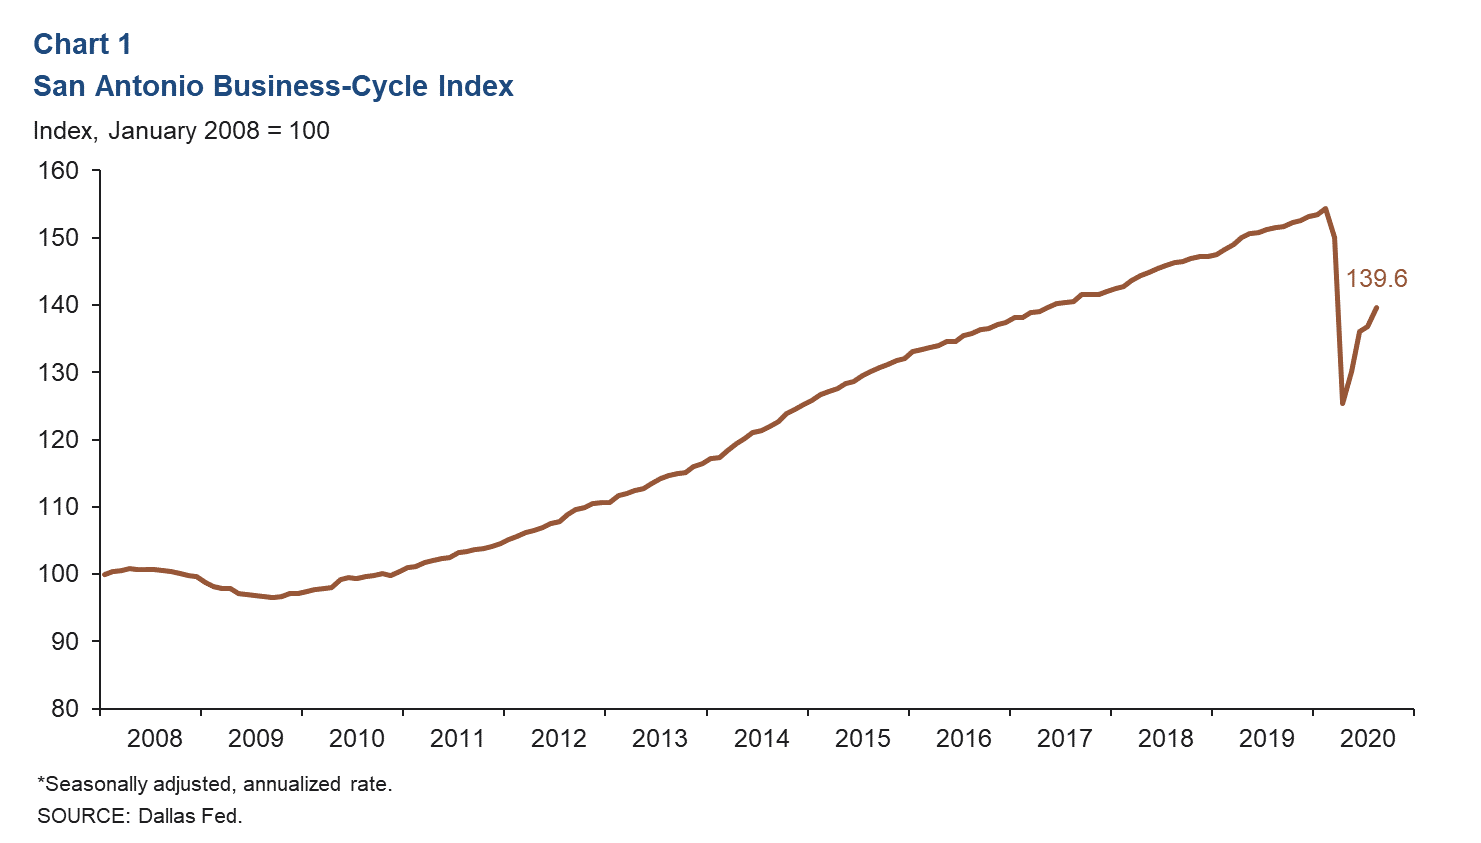
The San Antonio Business-Cycle Index—a broad measure of economic activity in the metro—expanded 2.1 percent in August (Chart 1). This improvement was due to a decline in the unemployment rate and recent positive job growth.
Labor Market
Unemployment Rate Ticks Down
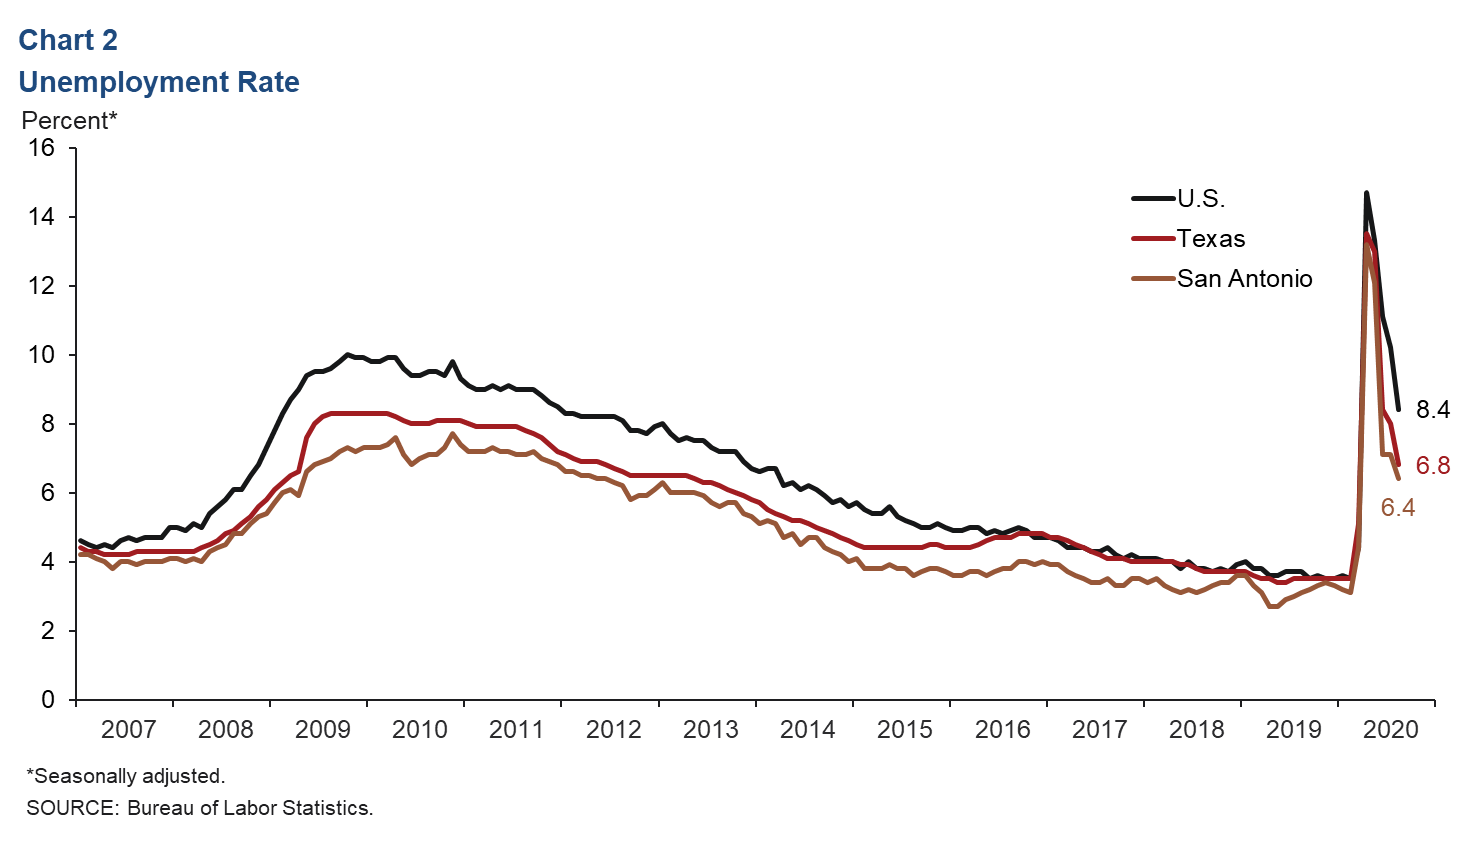
The metro’s unemployment rate declined to a still-elevated 6.4 percent in August, below the state’s 6.8 percent and the nation’s 8.4 percent (Chart 2).
Job Growth Broad Based
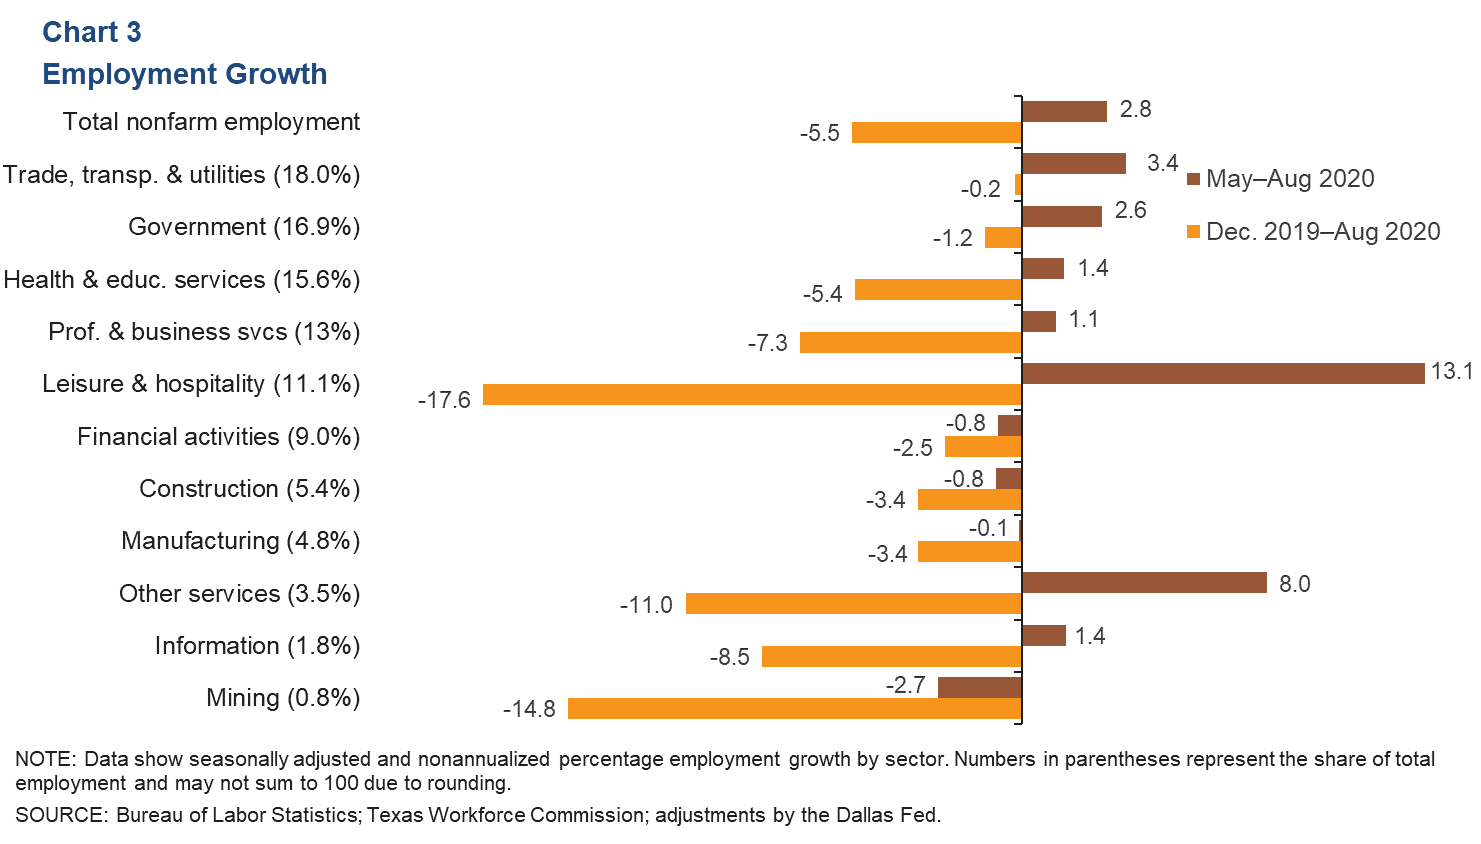
San Antonio payrolls grew at a nonannualized 2.8 percent (27,850 jobs) pace in the three months ending in August, with mixed performance across sectors (Chart 3). Leisure and hospitality experienced the most gains (13.1 percent, or 13,330 jobs) and was followed by other services (8.0 percent, or 2,700 jobs) and trade, transportation and utilities (3.4 percent, or 6,100 jobs). The mining sector declined at the steepest pace, contracting 2.7 percent (-250 jobs). While increases over the past four months have generally been strong, they have not been large enough to offset the losses in March and April. So far this year, employment has declined across all sectors, with total jobs down 5.5 percent.
Consumer Spending
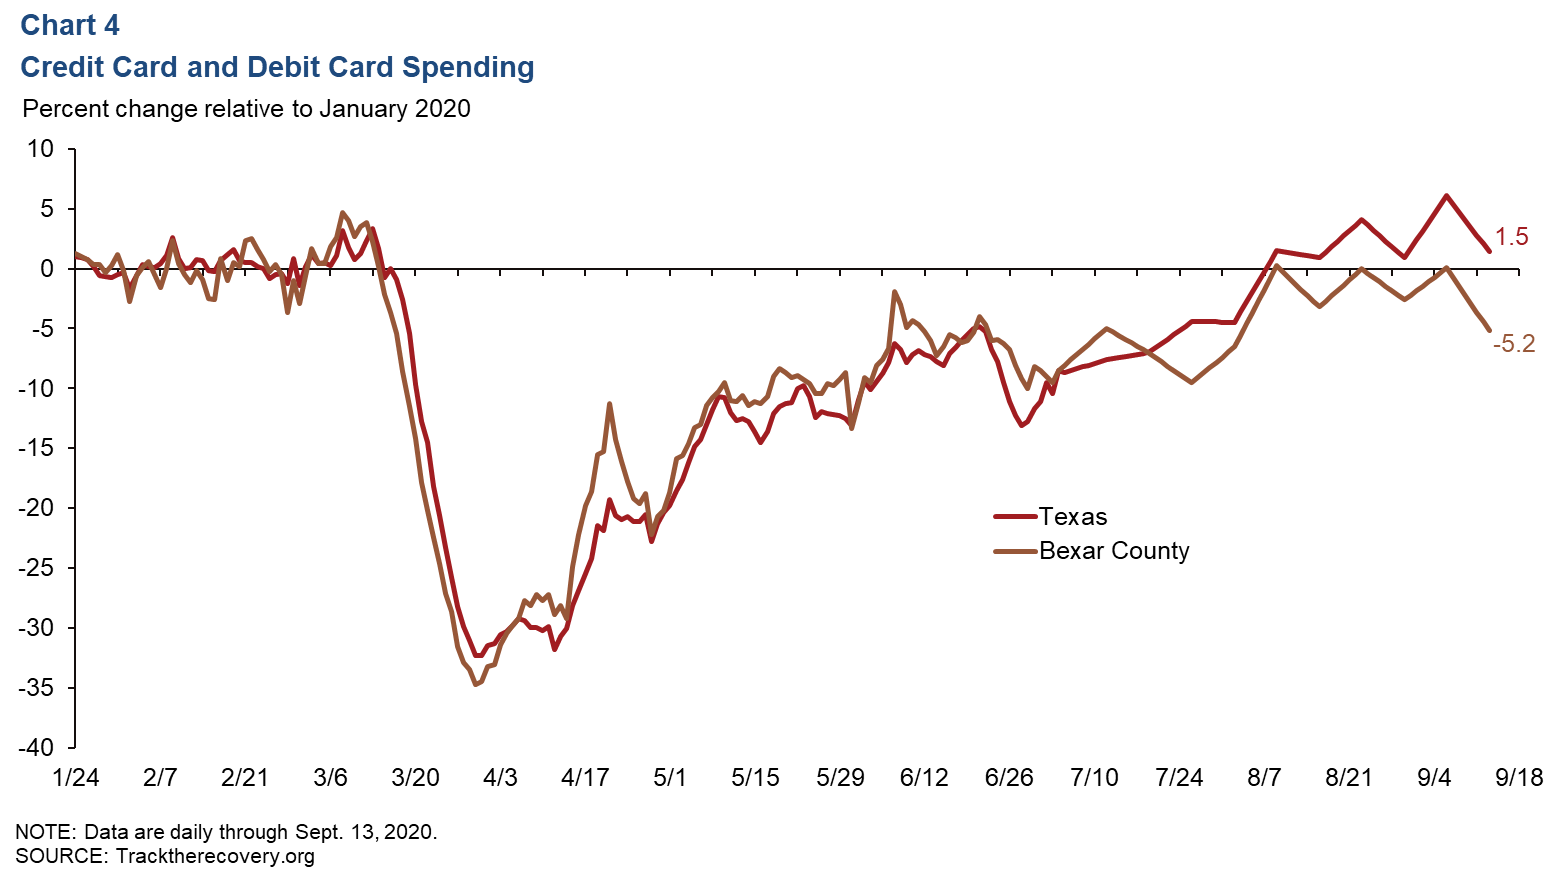
Since early April, consumer spending (measured by credit and debit card spending) in Bexar County has generally increased, though it weakened somewhat in early September. As of Sept. 13, spending in Bexar County was down 5.2 percent relative to January 2020 and was up 1.5 percent in the state (Chart 4).
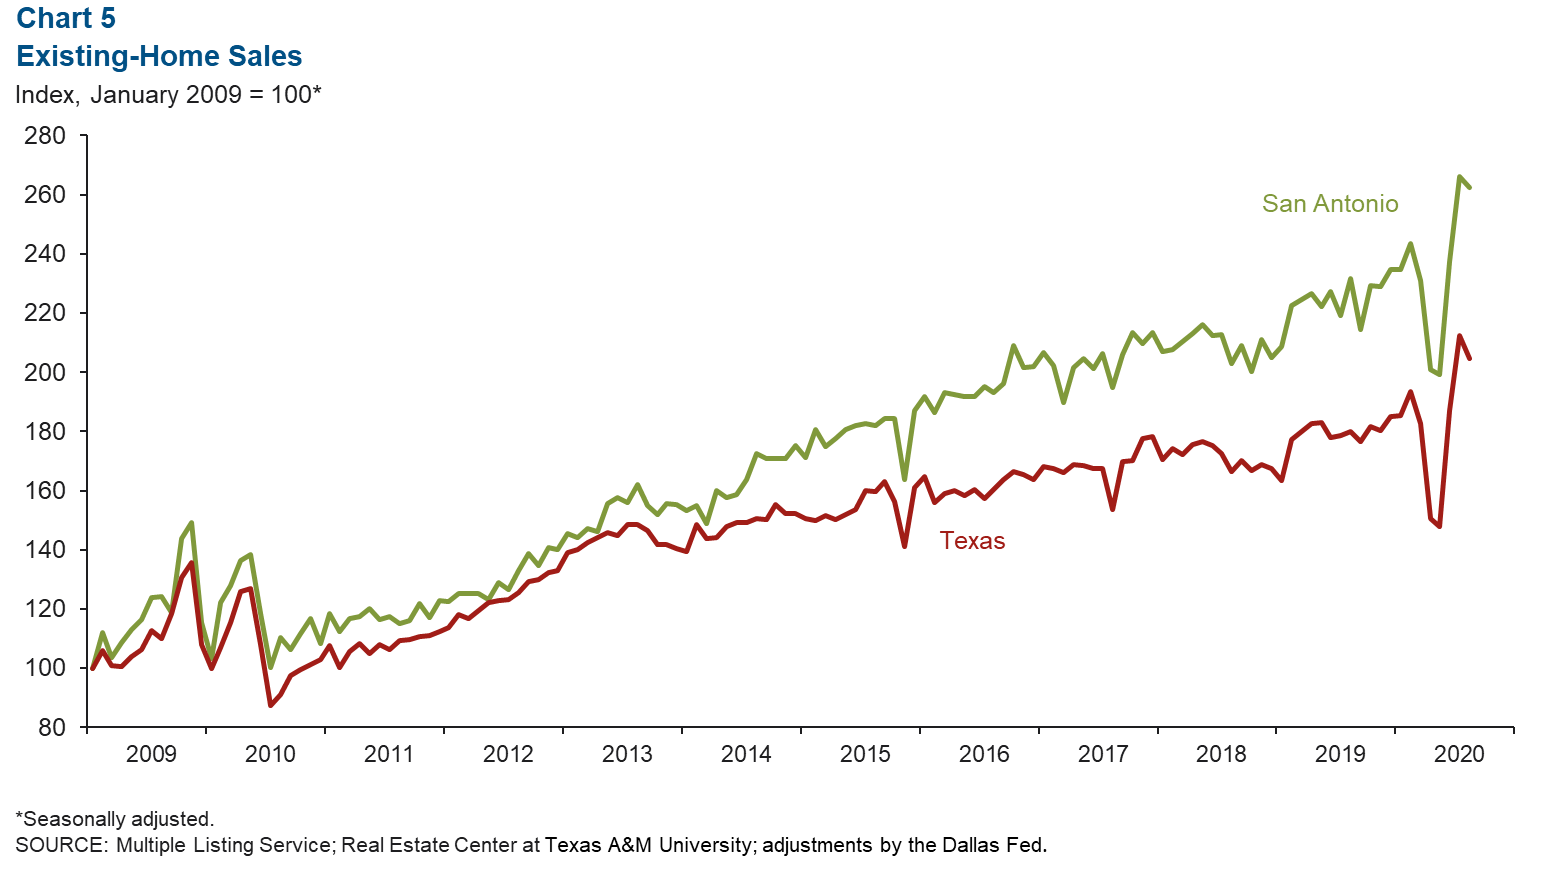
Real Estate
August existing-home sales contracted a slight 1.3 percent in San Antonio and 3.6 percent in the state (Chart 5). Home sales in San Antonio were 5.2 percent higher in the first eight months of 2020 than the same time last year. In Texas, sales were up 2.9 percent over the same period. The median price of homes sold in August was $249,821 in San Antonio—up 7.9 percent from a year ago—and $260,226 in Texas, up 6.6 percent.
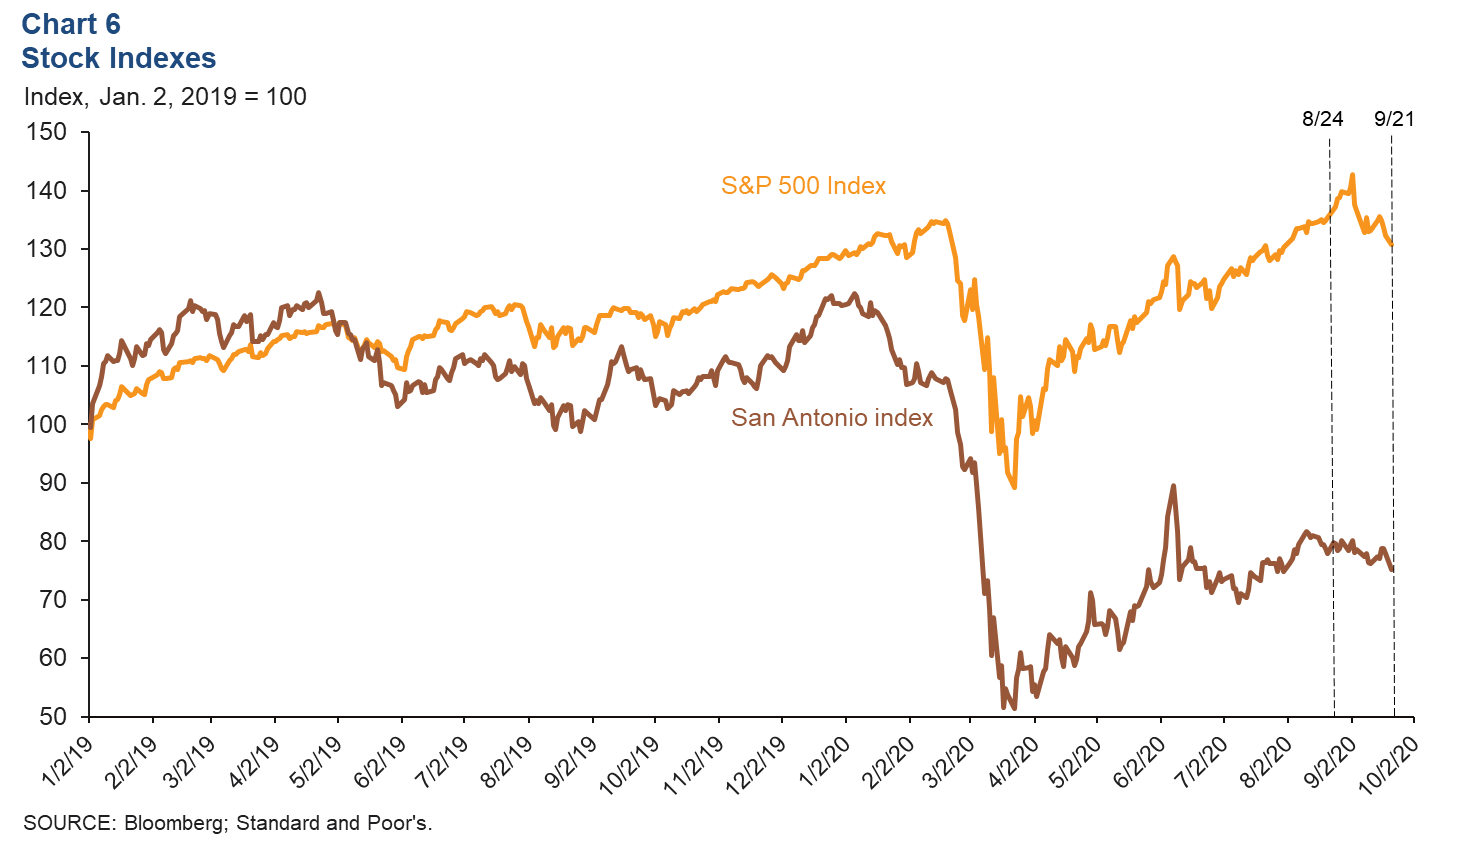
Stock Prices
Stock prices of San Antonio-based companies fell 5.8 percent from Aug. 24 to Sept. 21, while the S&P 500 fell 4.4 percent during the same period (Chart 6). Manufacturing and food service industries posted mixed performance, while other companies saw their stock value deteriorate.
NOTE: Data may not match previously published numbers due to revisions.
About San Antonio Economic Indicators
Questions can be addressed to Judy Teng at judy.teng@dal.frb.org. San Antonio Economic Indicators is published every month on the Thursday after state and metro employment data are released.