San Antonio Economic Indicators

January 6, 2021
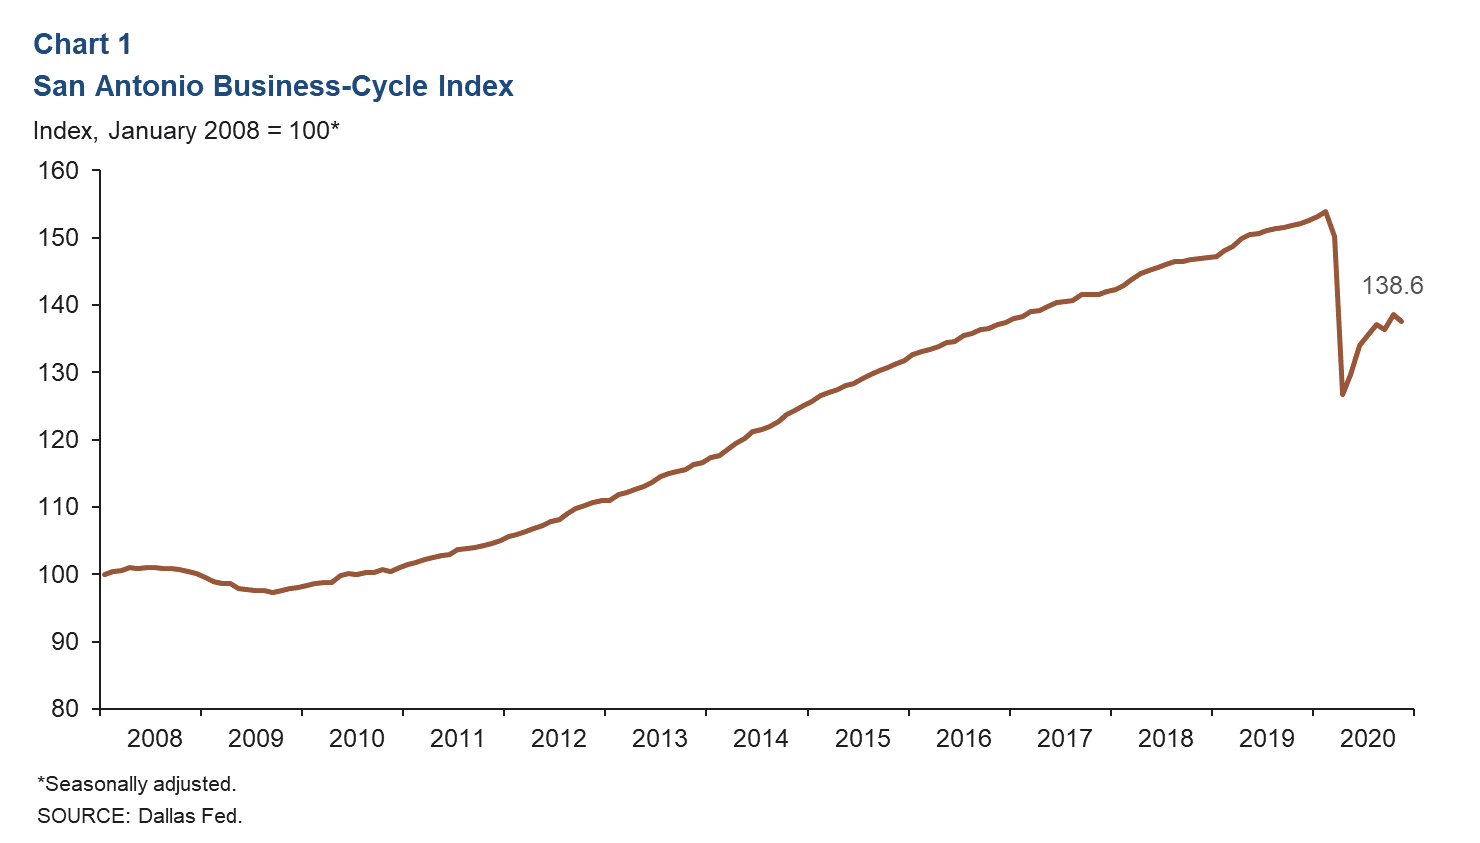
In November 2020, the San Antonio Business-Cycle Index contracted following its rebound in October. Overall, the pattern suggests a sharp slowing in the recovery since August. The unemployment rate increased sharply in November, while job growth was positive but weak. Local consumer spending improved in mid-November and early December, and the number of small businesses open increased briefly around the Thanksgiving holiday. Office space demand improved somewhat in the fourth quarter.
Business-Cycle Index
The San Antonio Business-Cycle Index—a broad measure of economic activity in the metro—declined 0.8 percent in November, suggesting some weakening in economic activity from October (Chart 1). The decline was mainly due to a sharp rise in the November unemployment rate component.
Labor Market
Unemployment Rate Ticks Up
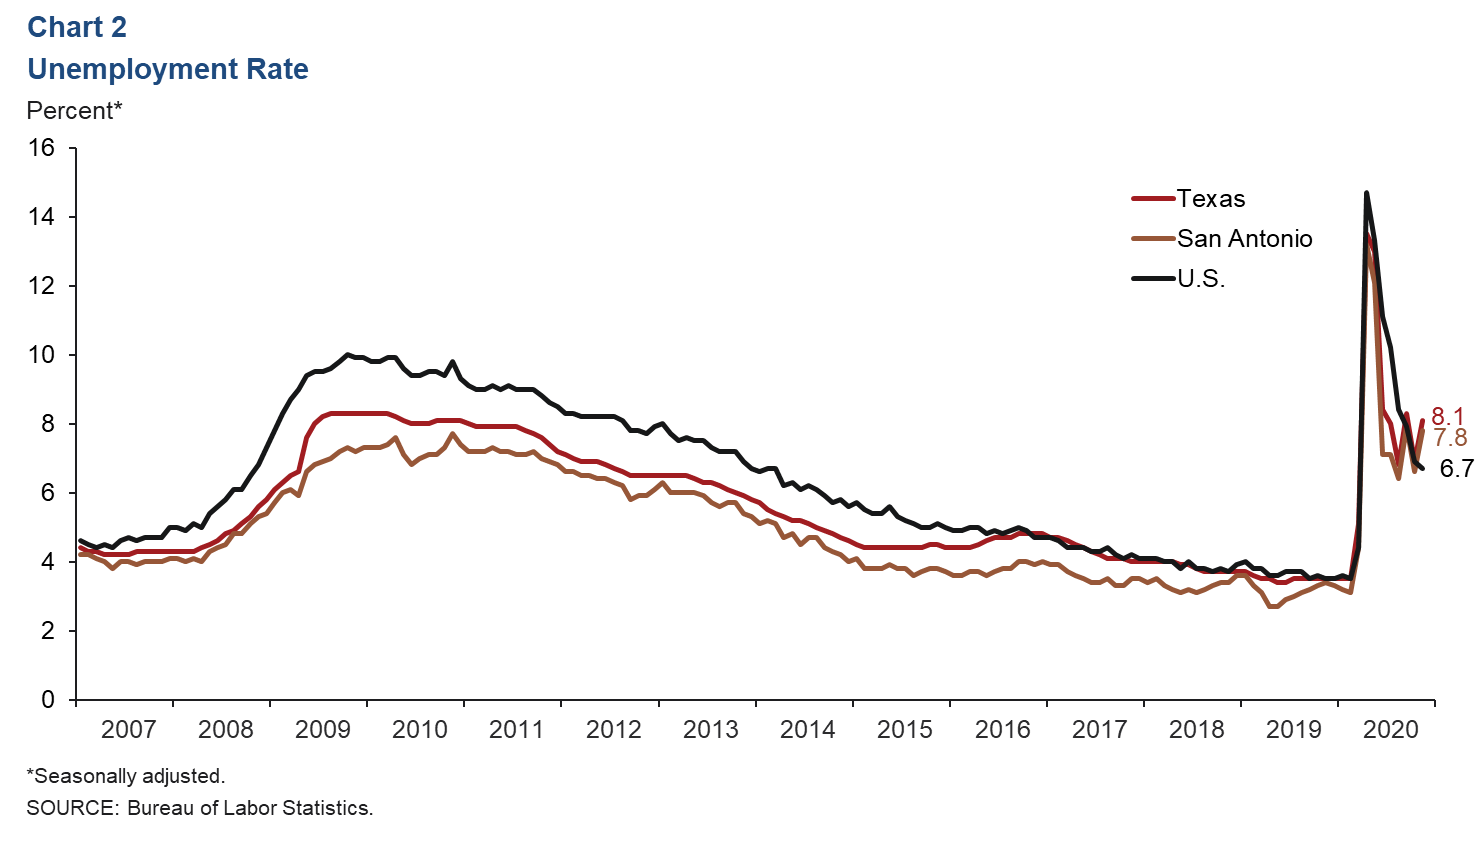
The metro’s unemployment rate increased in November to a six-month high of 7.8 percent, which is below the 8.1 percent for the state but above the 6.7 percent for the nation (Chart 2). The metro and state increases were primarily caused by a sharp increase in individuals seeking work.
Job Growth Mostly Positive Across Industries
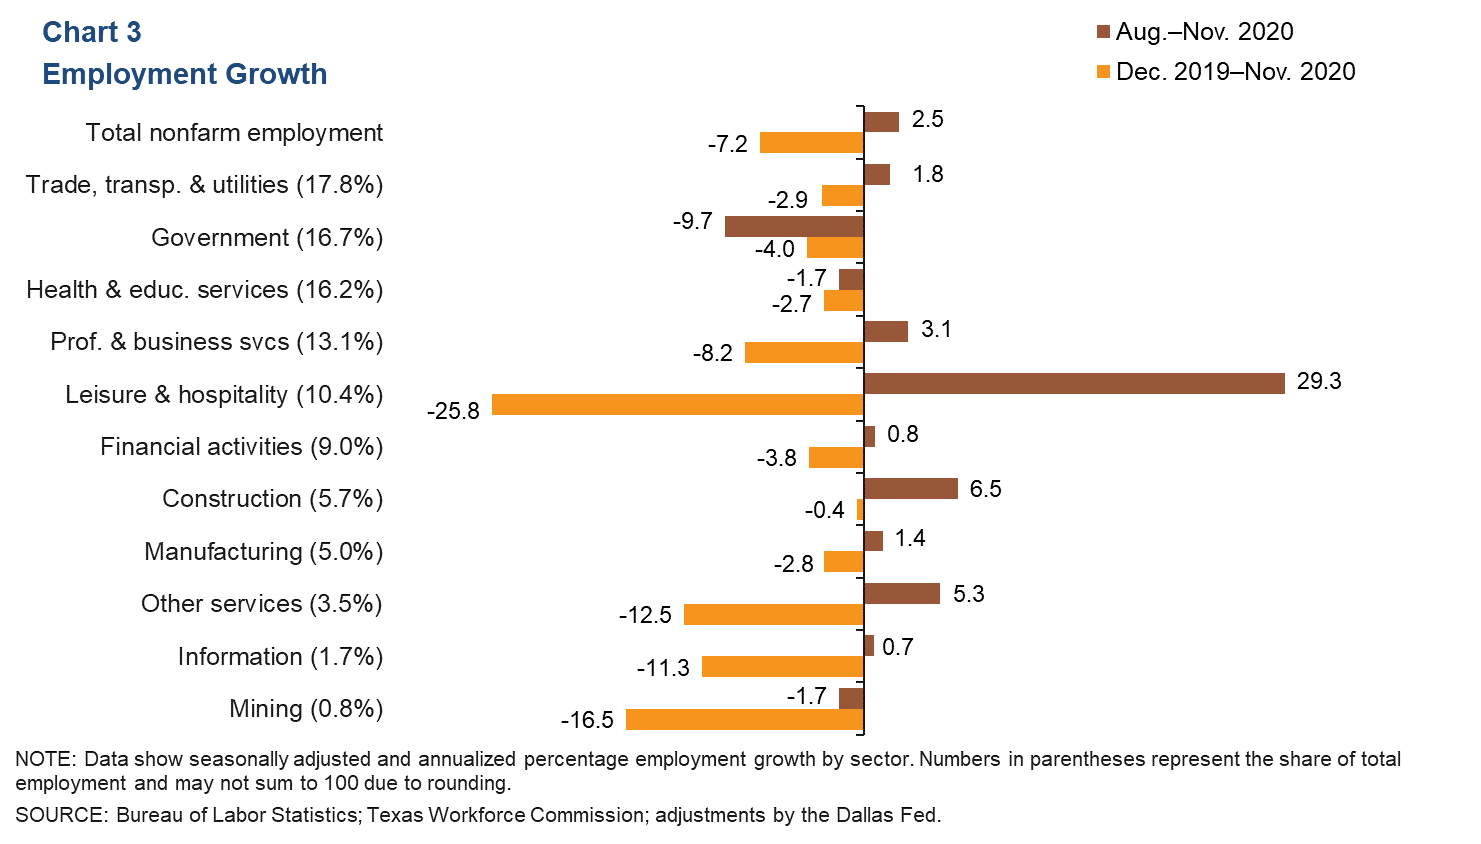
Net new payrolls in San Antonio increased an annualized 2.5 percent (6,160 jobs) in the three months ending in November, with mostly positive but weakening growth across sectors (Chart 3). The leisure and hospitality sector saw the strongest gains over the period (29.3 percent, or 6,540 jobs), followed by construction (6.5 percent, or 910 jobs) and “other services” (5.3 percent, or 470 jobs). The three sectors that posted net job losses were government (-9.7 percent, or 4,360 jobs), health and private education services (-1.7 percent, or 730 jobs) and mining (-1.7 percent, or 40 jobs). While job gains have been broad based since May, they have not been large enough to offset the losses in March and April. Through November, employment declined across all sectors, with total jobs down 7.2 percent.
Consumer Spending
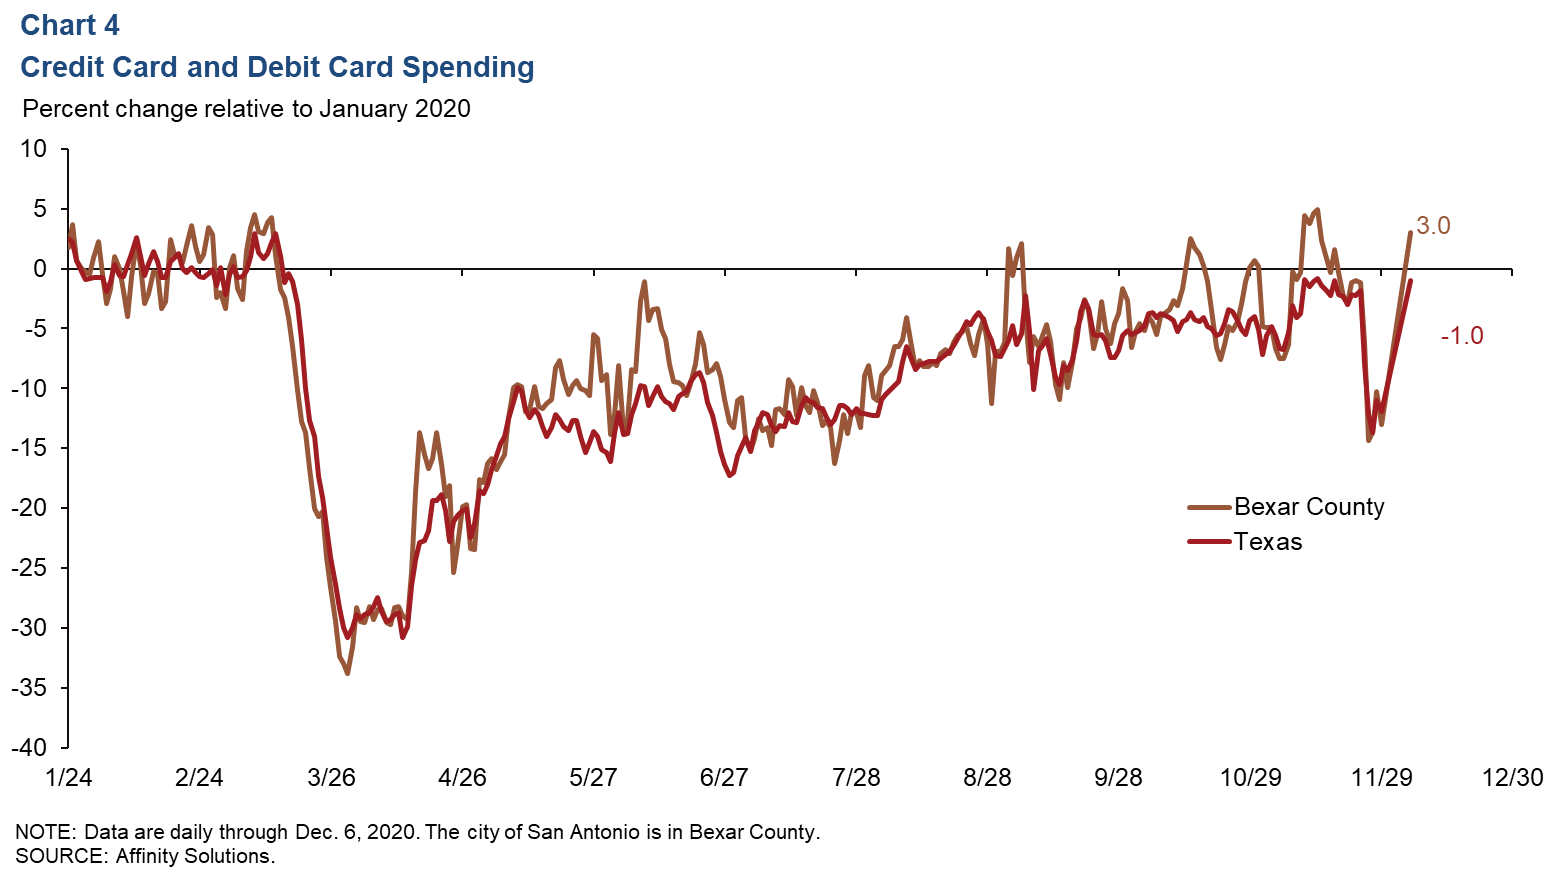
Since early April, credit and debit card spending by Bexar County residents has trended upward, surging temporarily above prepandemic levels in early September, mid-October, mid-November and early December. As of Dec. 6, spending was up 3.0 percent relative to January 2020 in Bexar County and down 1.0 percent in the state (Chart 4).
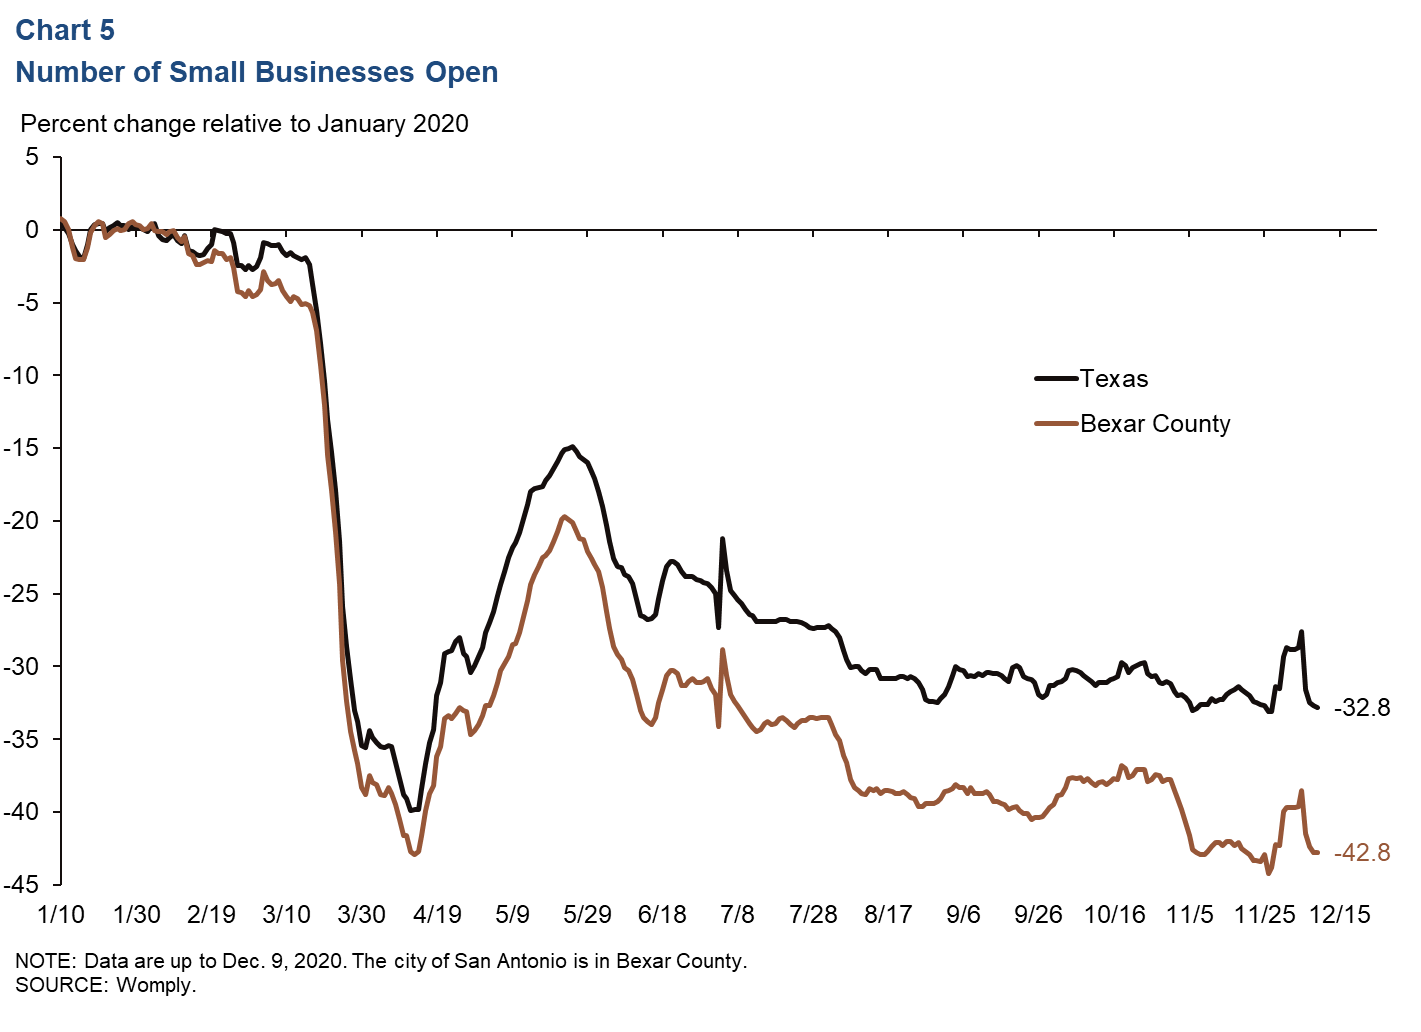
Small Business
The number of small businesses open improved briefly in late November and early December after trending downward starting in late October (Chart 5). As of Dec. 9, the number of small businesses open had returned to levels seen prior to the spike and was down 42.8 percent relative to January levels in Bexar County and down 32.8 percent in the state.
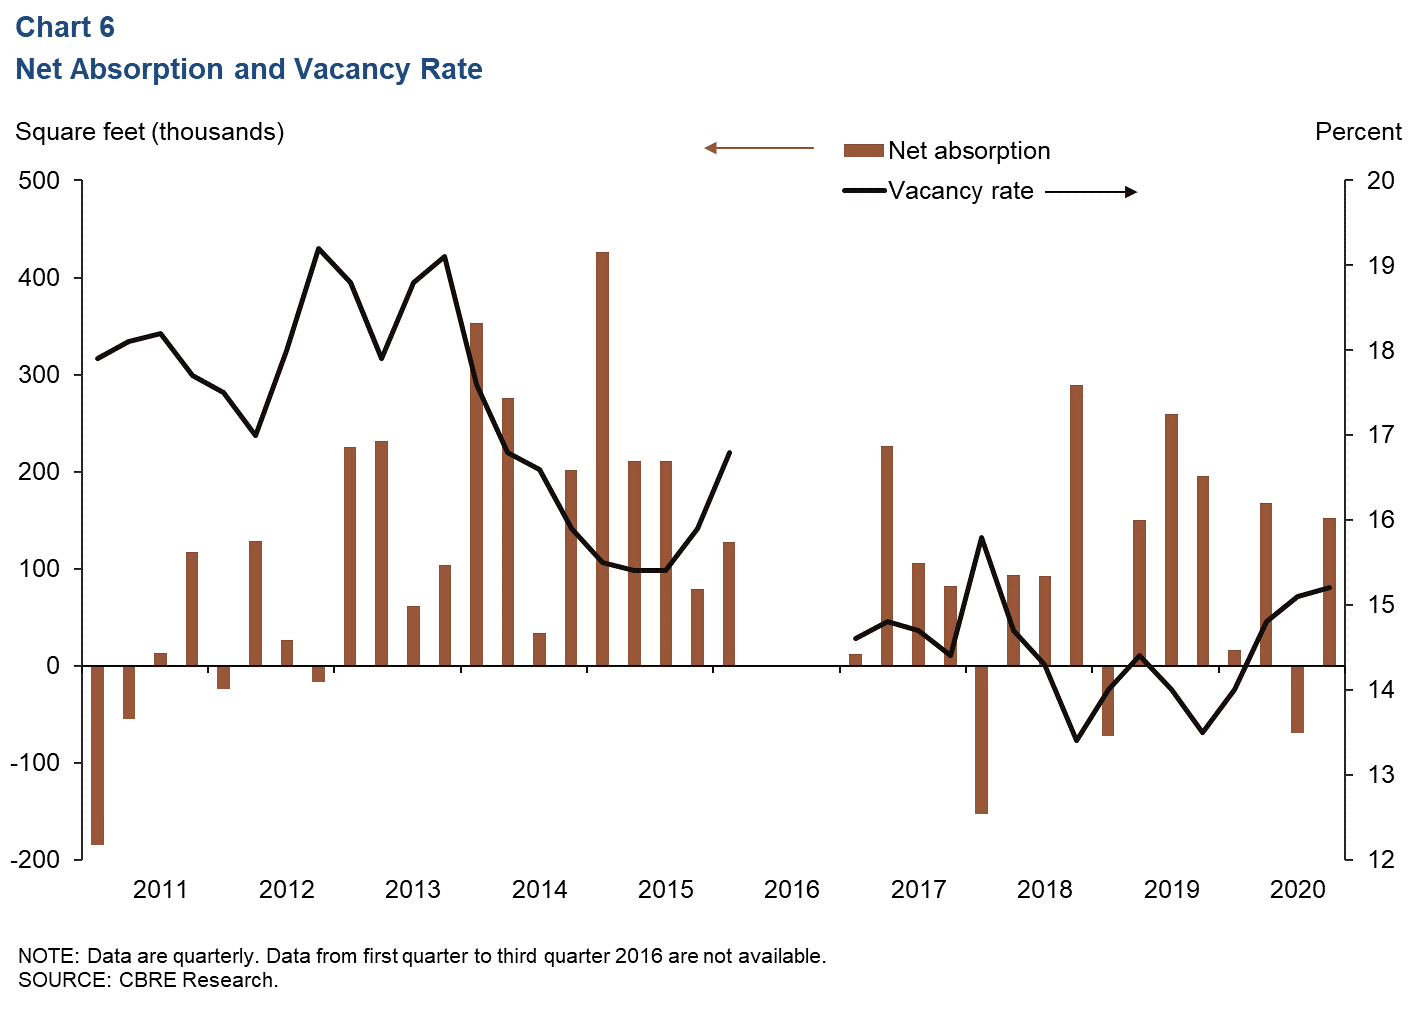
Real Estate
Demand for office space improved somewhat in the fourth quarter in San Antonio after a weak third quarter. Net absorption returned to positive territory (151,730 square feet), while the vacancy rate climbed to 15.2 percent—the highest since first quarter 2018 (Chart 6). Average asking rent fell 1.2 percent from the third quarter to $21.73 per square foot and decreased 5.3 percent from fourth quarter 2019.
NOTE: Data may not match previously published numbers due to revisions.
About San Antonio Economic Indicators
Questions can be addressed to Judy Teng at judy.teng@dal.frb.org. San Antonio Economic Indicators is published every month on the Thursday after state and metro employment data are released.