San Antonio Economic Indicators

July 1, 2021
The San Antonio Business-Cycle Index continued to increase in May. Payrolls expanded and the unemployment rate ticked down, though neither measure has returned to its prepandemic level. Local consumer spending moved sideways but remained above pre-COVID-19 levels. Home sales activity accelerated in May after a sluggish April, and COVID-19 hospitalizations continued to trend downward from January’s peak.
Business-Cycle Index
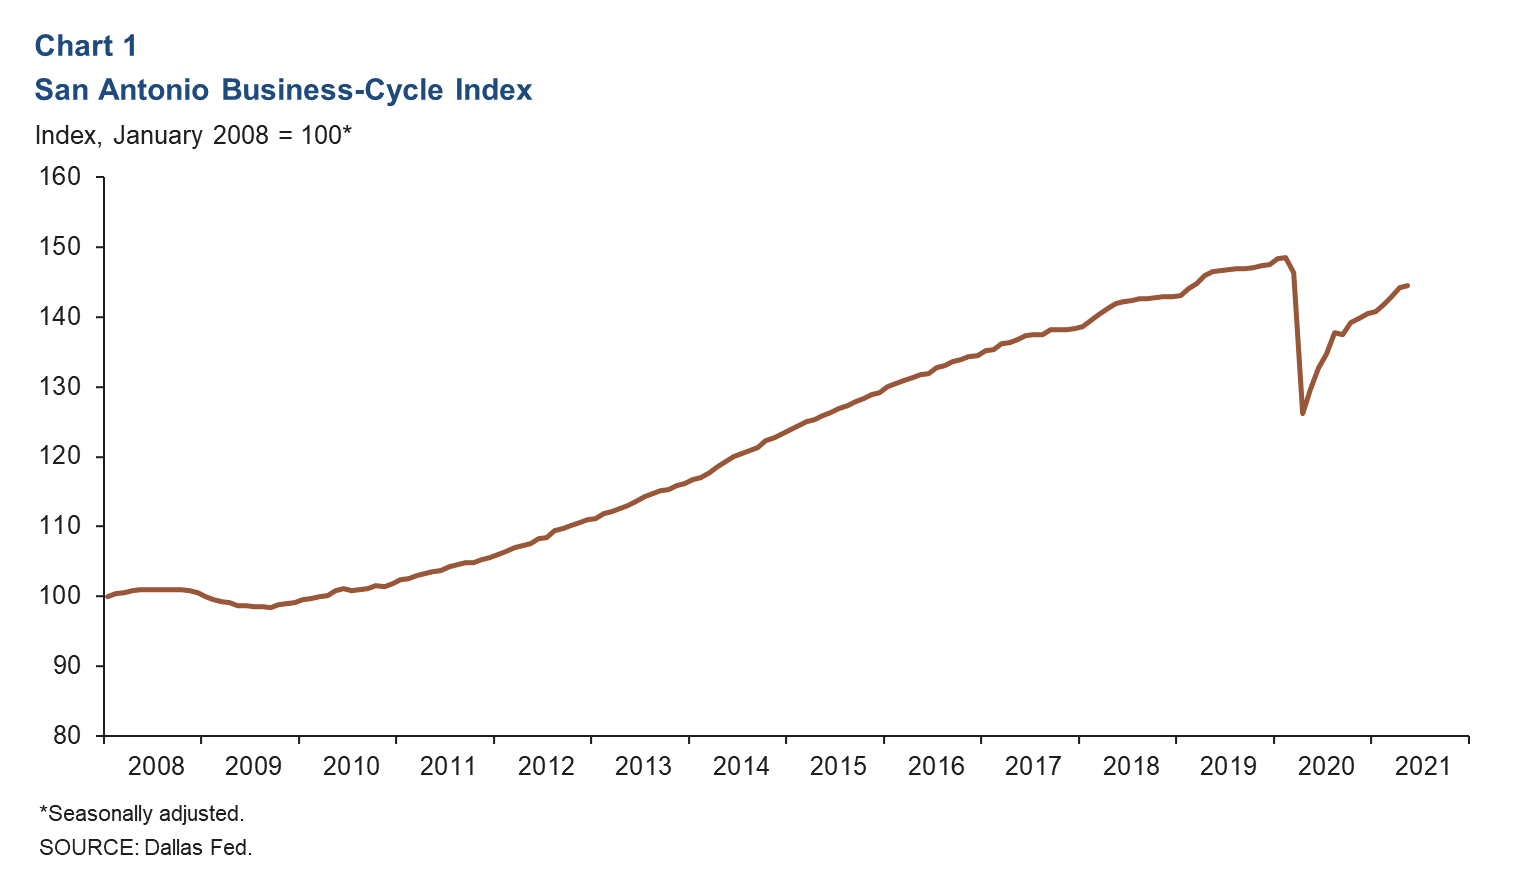
The San Antonio Business-Cycle Index—a broad measure of economic activity in the metro—decelerated to a moderate 3.3 percent expansion in May after posting strong growth of 10.8 percent in April (Chart 1). Recent activity in the index can be attributed to positive but more moderate job growth and the lower unemployment rate. Nevertheless, the index remains 2.7 percent below its February 2020 peak.
Labor Market
Unemployment Rate Ticks Down
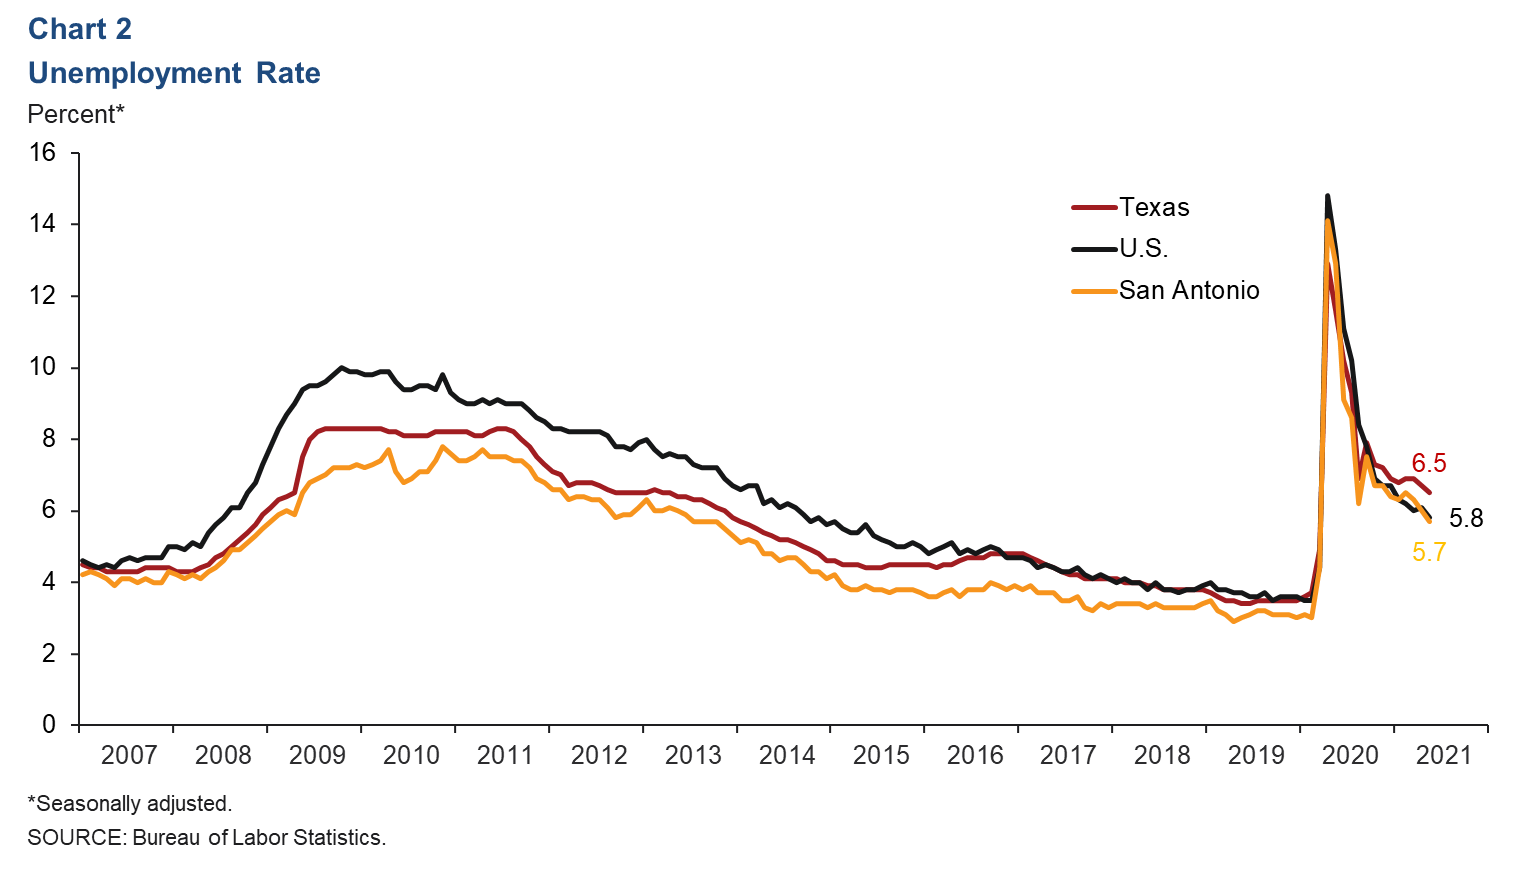
The metro’s unemployment rate declined to 5.7 percent in May, the lowest since March 2020. The state’s jobless rate fell to 6.5 percent, and the nation’s rate ticked down to 5.8 percent (Chart 2).
Recent Job Growth Largely Positive Across Sectors
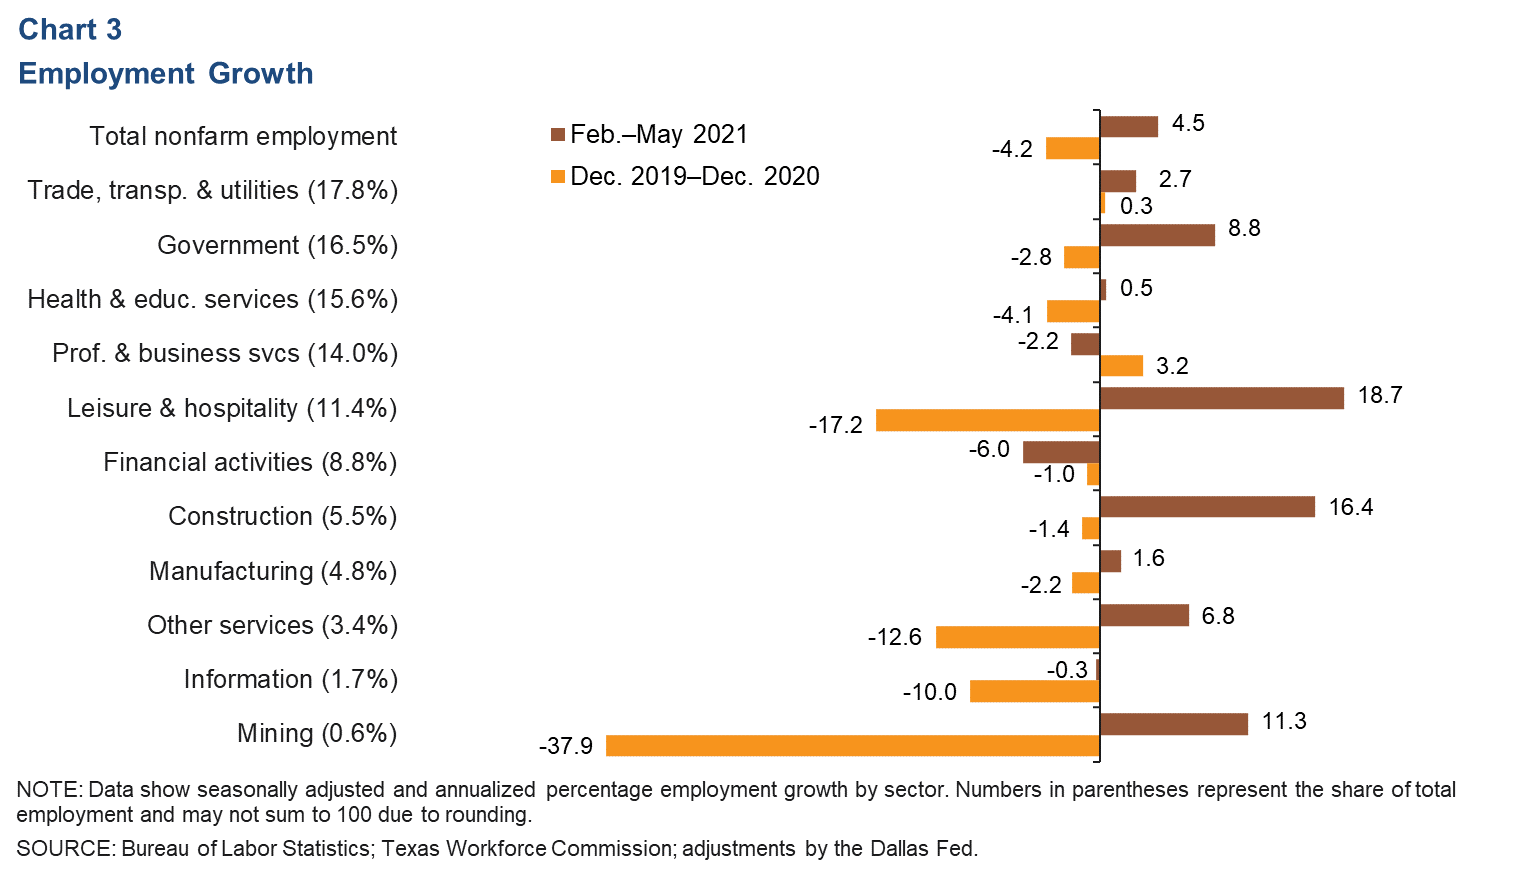
Net payrolls in San Antonio expanded an annualized 4.5 percent (11,445 jobs) in the three months ending in May, with positive performances across most sectors (Chart 3). Leisure and hospitality led the growth (18.7 percent, or 5,050 jobs) and was followed by construction (16.4 percent, or 2,180 jobs), government (8.8 percent, or 3,620 jobs) and other services (6.8 percent, or 580 jobs). Industries that posted net declines were financial activities (-6.0 percent, or 1,445 jobs), professional and business services (-2.2 percent, or 830 jobs) and information (-0.3 percent, or 15 jobs). In March and April 2020 combined, 130,511 jobs were lost as the pandemic hit. As of April 2021, 76.4 percent of those jobs had been recovered.
Consumer Spending
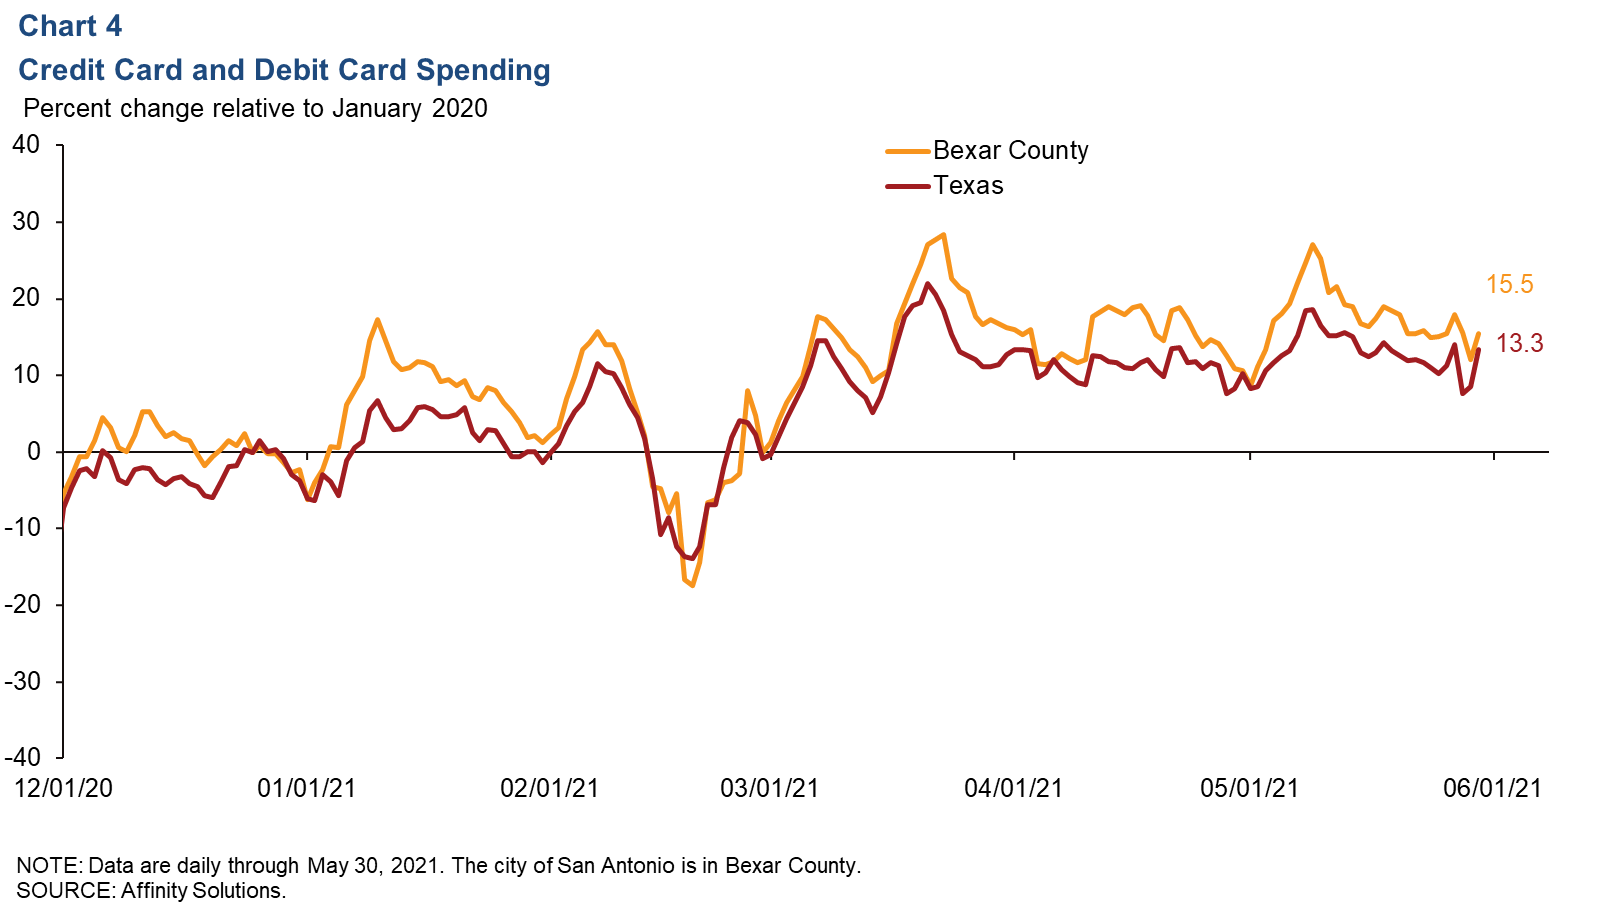
Since early February 2021, consumer spending has remained generally above January 2020 levels, except for the brief dip to below prepandemic levels during the week of Winter Storm Uri in mid-February. Spending in recent weeks has generally moved sideways. As of May 30, spending was 15.5 percent higher in Bexar County and 13.3 percent higher in Texas relative to January 2020 (Chart 4).
Real Estate
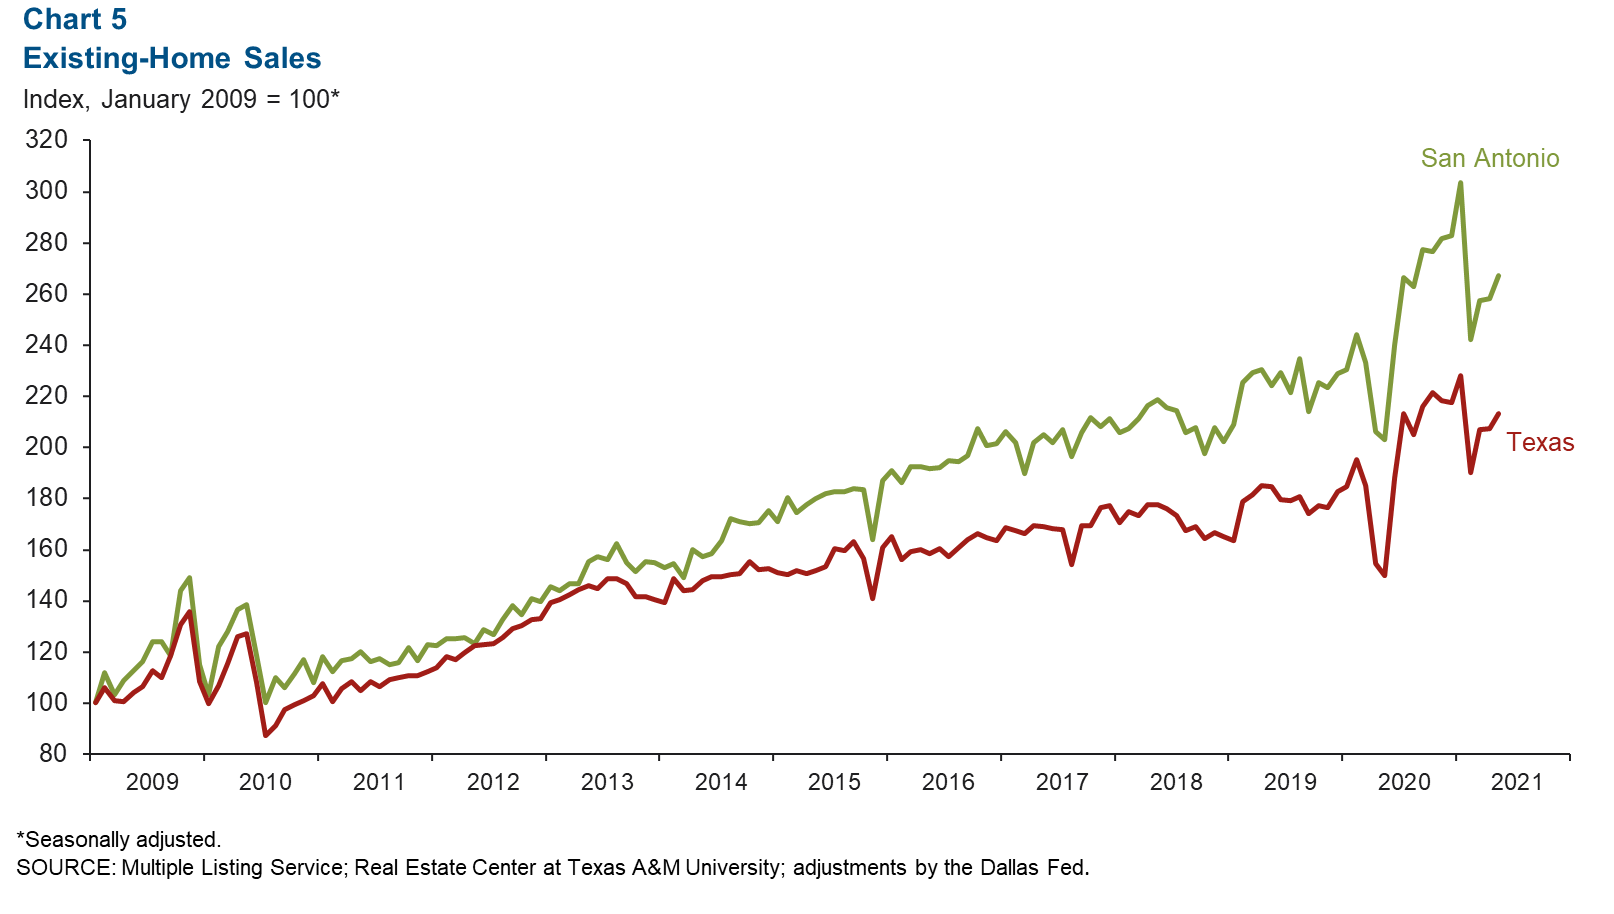
Metro existing-home sales accelerated in May (3.4 percent month/month) after expanding at a mild 0.4 percent pace in April (Chart 5). In the state, sales activity rose 2.9 percent in May. In the first five months of 2021, the metro’s home sales were up 18.9 percent compared with the same period in 2020—slightly below the state’s 20.3 percent increase. The median price of homes sold in the metro in May was $272,613—a 10.3 percent increase year over year. In the state, the median home price in May was $293,327, a 15.9 percent jump.
COVID-19 Hospitalizations
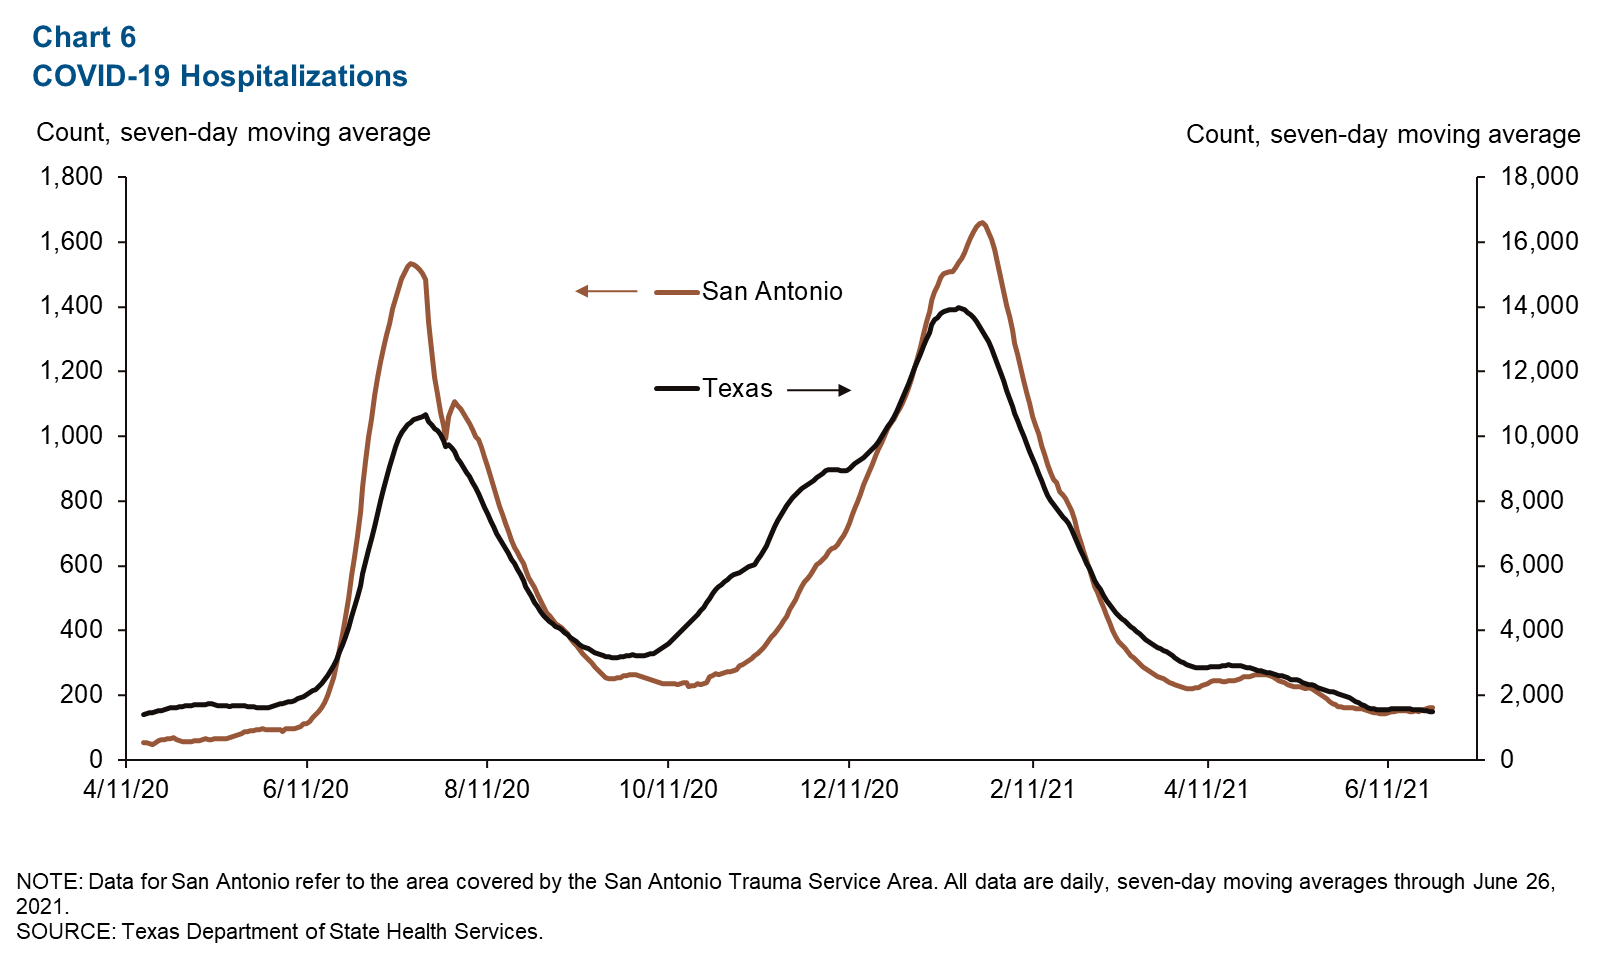
The number of people currently hospitalized with COVID-19 in San Antonio has broadly trended downward since peaking at 1,661 on Jan. 25 this year (Chart 6). In Texas, the number hospitalized topped out at 13,977 on Jan. 17. As of June 26, the numbers were 161 in San Antonio and 1,489 in Texas. The number hospitalized in San Antonio appeared to flatten out in June, however, rising only slightly from 158 at the beginning of the month.
NOTE: Data may not match previously published numbers due to revisions.
About San Antonio Economic Indicators
Questions can be addressed to Judy Teng at judy.teng@dal.frb.org. San Antonio Economic Indicators is published every month during the week after state and metro employment data are released.