San Antonio Economic Indicators

August 25, 2022
Overall economic activity in San Antonio remained positive in July. The business-cycle index continued to expand as wages increased, dining out activity stayed above prepandemic levels, and job growth remained solid. However, the unemployment rate ticked up, and the housing opportunity index declined significantly over the past quarter.
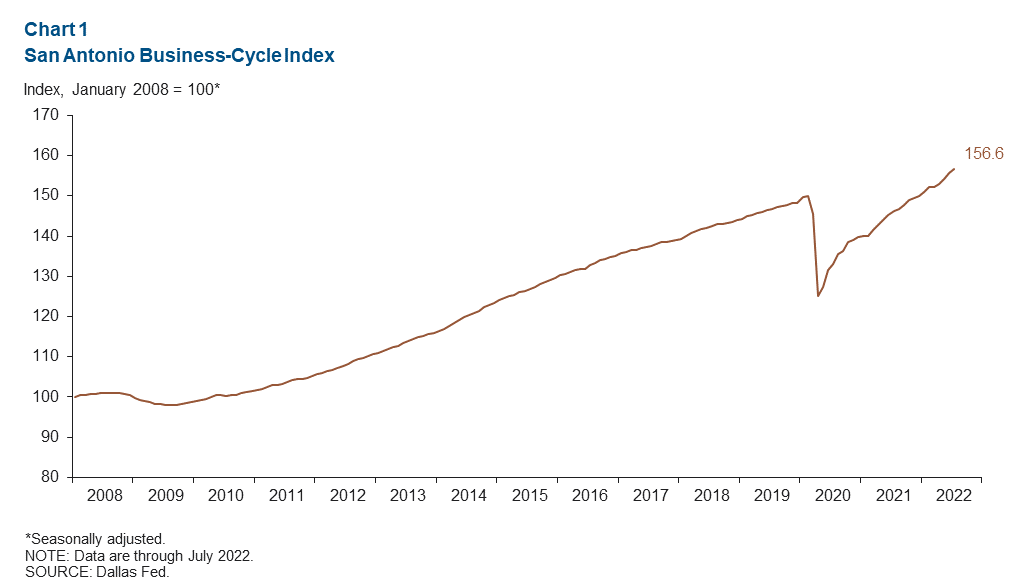
Business-cycle index
The San Antonio Business-Cycle Index —a broad measure of economic activity in the metro—grew at an annualized rate of 6.7 percent in July, slower than the 12.5 percent growth in June (Chart 1).
Labor market
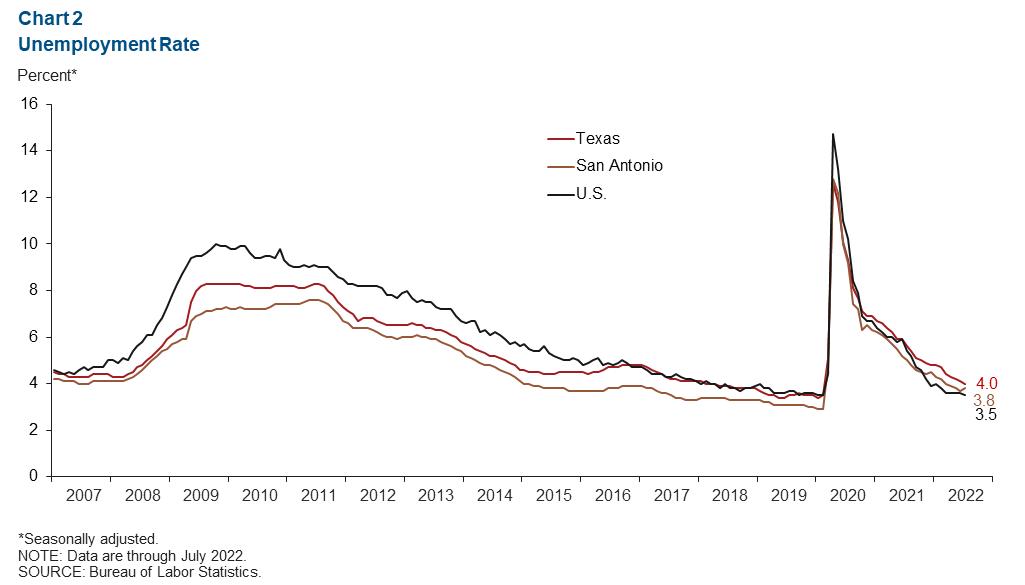
Unemployment rate increases slightly in July
The San Antonio unemployment rate increased to 3.8 percent in July, up from 3.7 percent in June and back to levels in May (Chart 2). The metro’s unemployment rate is greater than the U.S. jobless figure of 3.5 percent but below the state rate of 4.0 percent. In July , the San Antonio labor force expanded at a 5.5 percent annualized rate.
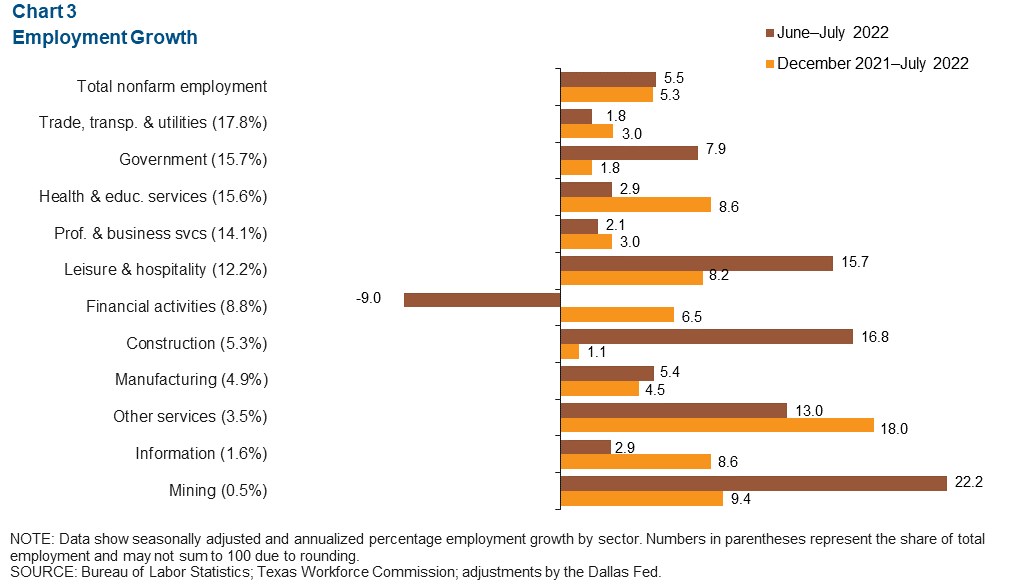
Most sectors see job gains
San Antonio payrolls expanded 5.5 percent from June to July (4,955 jobs) (Chart 3). Among the major sectors, mining grew the most at 22.2 percent (102 jobs), followed by construction, up 16.8 percent (759), and leisure and hospitality, up 15.7 percent (1,647). Financial activities was the only sector to decline, by 9.0 percent (764 jobs). With the overall increase in July, San Antonio has gained approximately 162,878 jobs since the depths of the pandemic in April 2020 and has surpassed prepandemic employment levels.
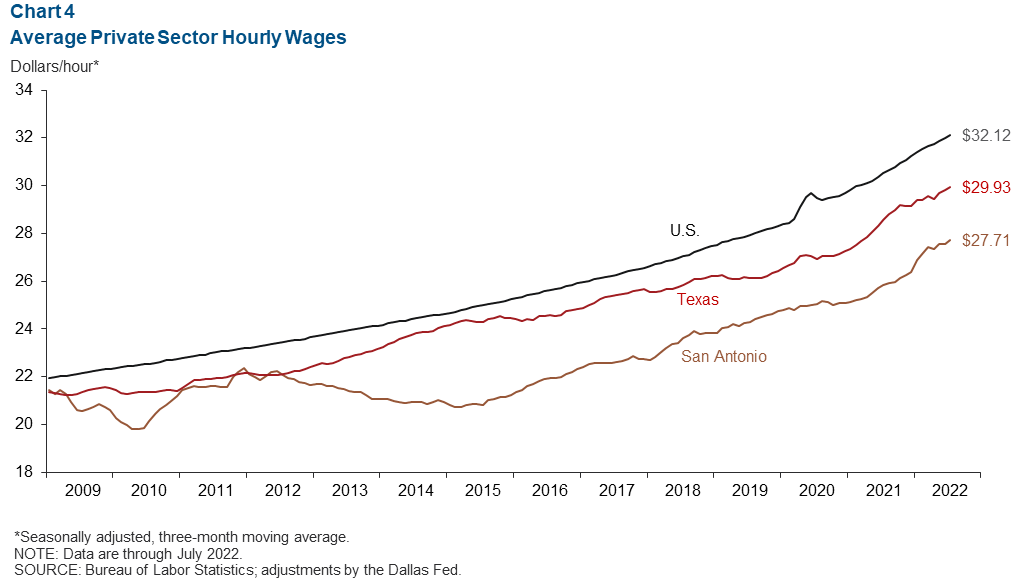
Average wages continue to climb
San Antonio wages increased in July versus the previous month (Chart 4). The three-month moving average of hourly wages in San Antonio was $27.71, below the state average of $29.93 and the national average of $32.12. Still, the metro’s 12-month wage gain of 7.2 percent outpaced Texas at 4.8 percent and the U.S. at 5.3 percent.
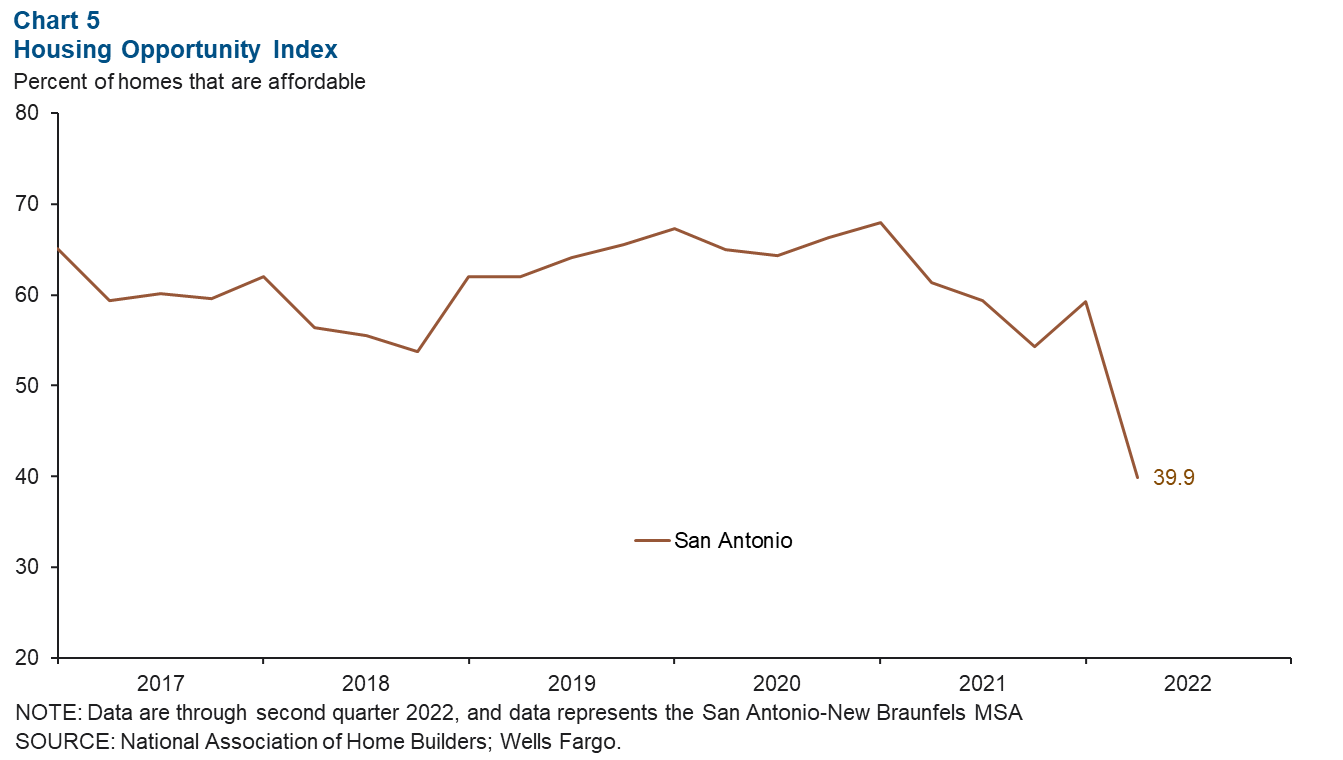
Housing affordability
In the second quarter, the San Antonio metro’s Housing Opportunity Index plummeted 19.3 percent to 39.9 percent (Chart 5 ). This is the lowest percentage of homes sold in San Antonio that are considered affordable since the index began in 2012. The sharp drop was due primarily to steadily rising home prices and mortgage rates.
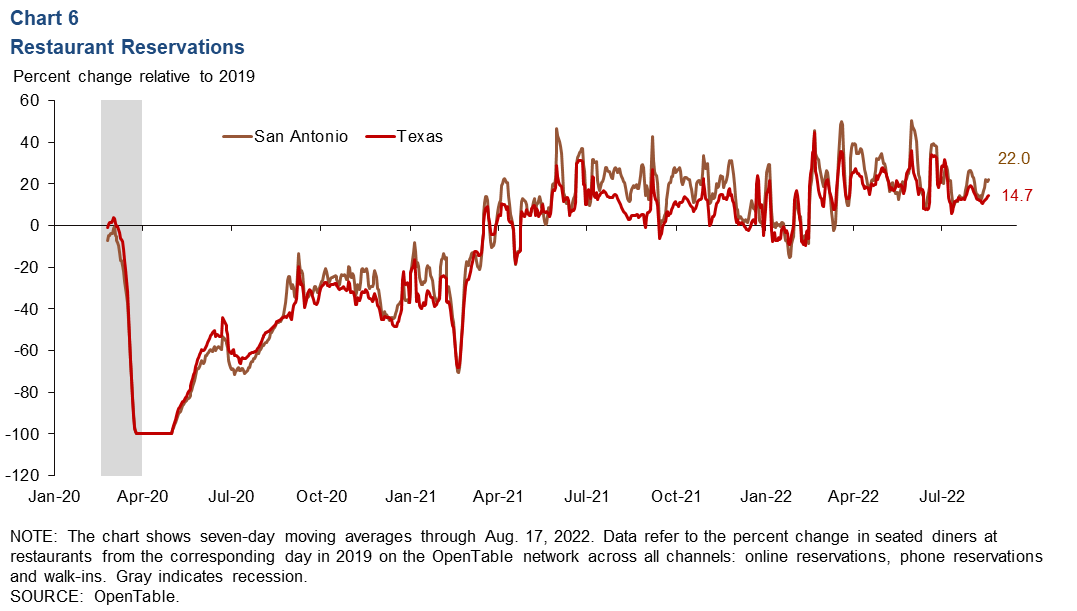
Dining activity
San Antonio dining-out activity stayed above 2019 levels through the summer and moderately increased in the past month (Chart 6 ). As of Aug. 17, dining-out activity in San Antonio was 22.0 percent higher than it was in 2019—greater than the 14.7 percent increase for Texas.
NOTES: The San Antonio payroll employment data and corresponding chart (Chart 3) were updated August 4, 2022. Data may not match previously published numbers due to revisions.
About San Antonio Economic Indicators
Questions can be addressed to Vee Kalkunte at Prithvi.Kalkunte@dal.frb.org. San Antonio Economic Indicators is published every month during the week after state and metro employment data are released.