San Antonio Economic Indicators

September 23, 2022
The San Antonio economy slowed down in August. The business-cycle index expanded marginally as unemployment and wages stayed steady, and median rent increased. However, COVID-19 hospitalizations and employment declined.
Business-cycle index
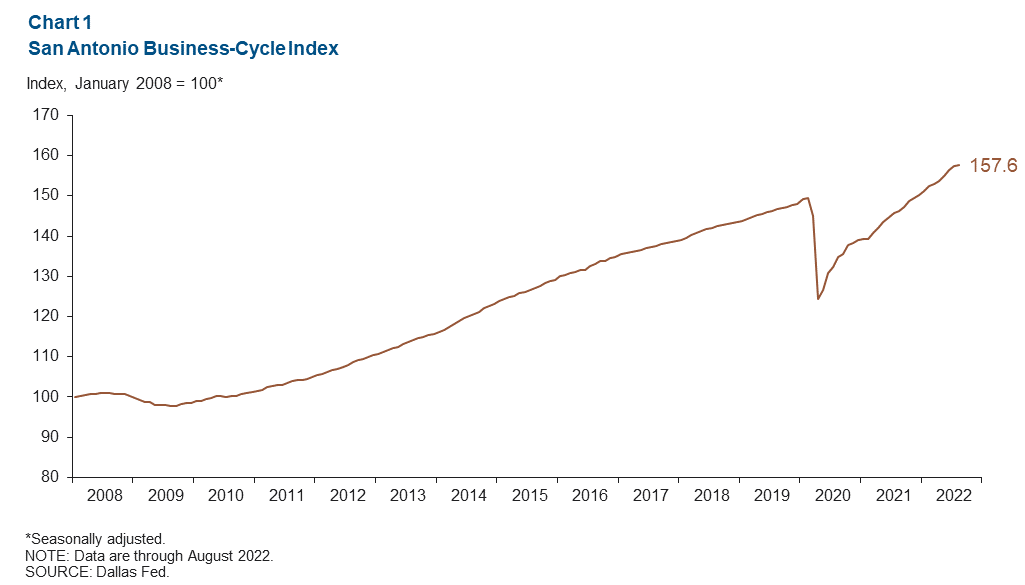
The San Antonio Business-Cycle Index —a broad measure of economic activity in the metro—grew at an annualized rate of 1.6 percent in August, slower than the 7.8 percent growth in July (Chart 1).
Labor market
Unemployment rate stays steady in August
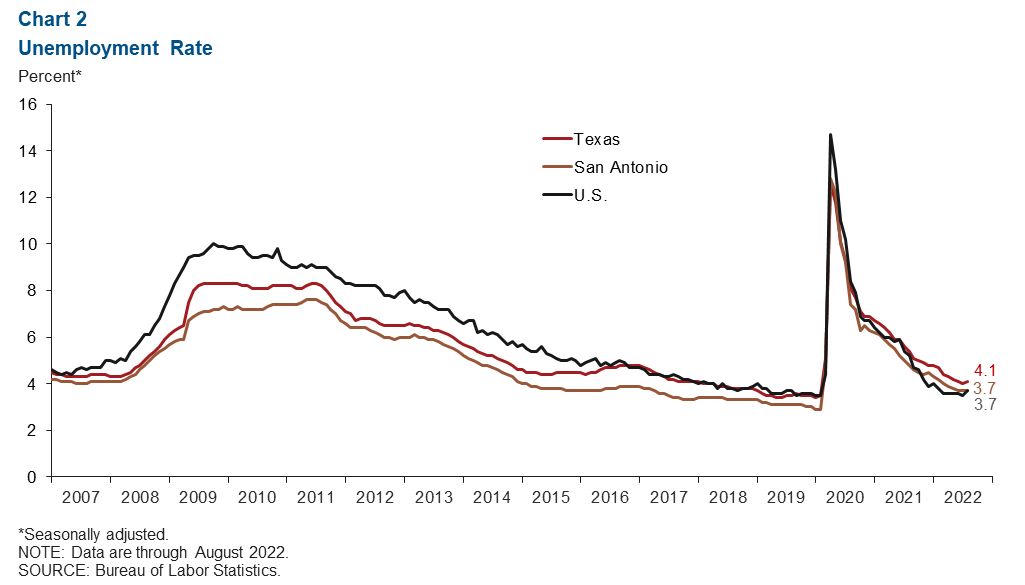
The San Antonio unemployment rate remained at 3.7 percent in August (Chart 2). The metro’s unemployment figure was the same as the U.S rate of 3.7 percent but below the state’s 4.1 percent. This month, the San Antonio labor force experienced marginal growth at a 0.7 percent annualized rate.
Jobs decline slightly
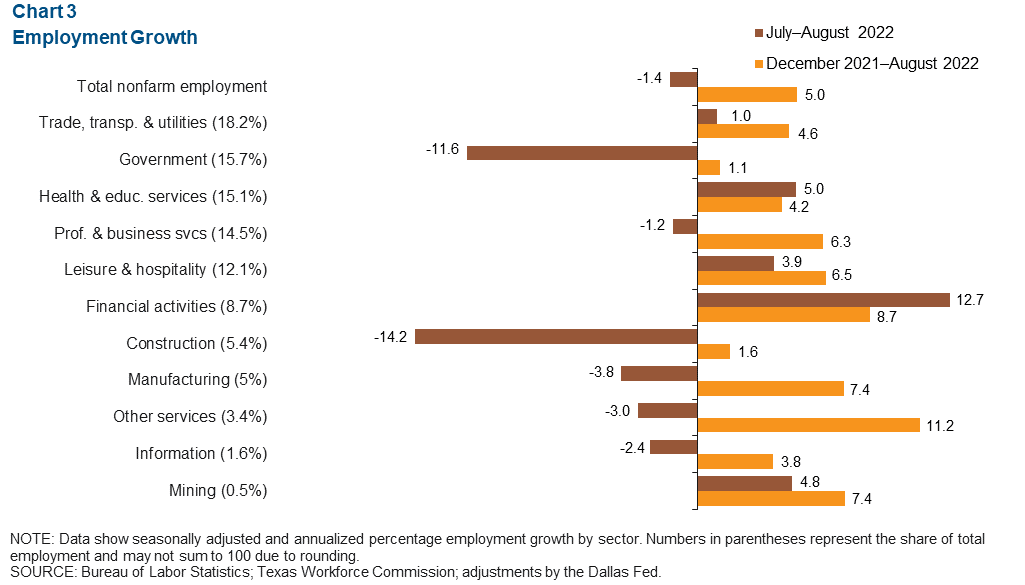
San Antonio payrolls contracted 1.4 percent from July to August (1,293 jobs) (Chart 3). Among the major sectors, financial activities grew the most at 12.7 percent (982 jobs). On the other hand, construction had the greatest decline at 14.2 percent (761 jobs), followed by the government sector at 11.6 percent (1,792 jobs). Since the depths of the pandemic in April 2020, San Antonio has gained approximately 170,096 jobs, and numbers remain above prepandemic employment.
Wage growth slows
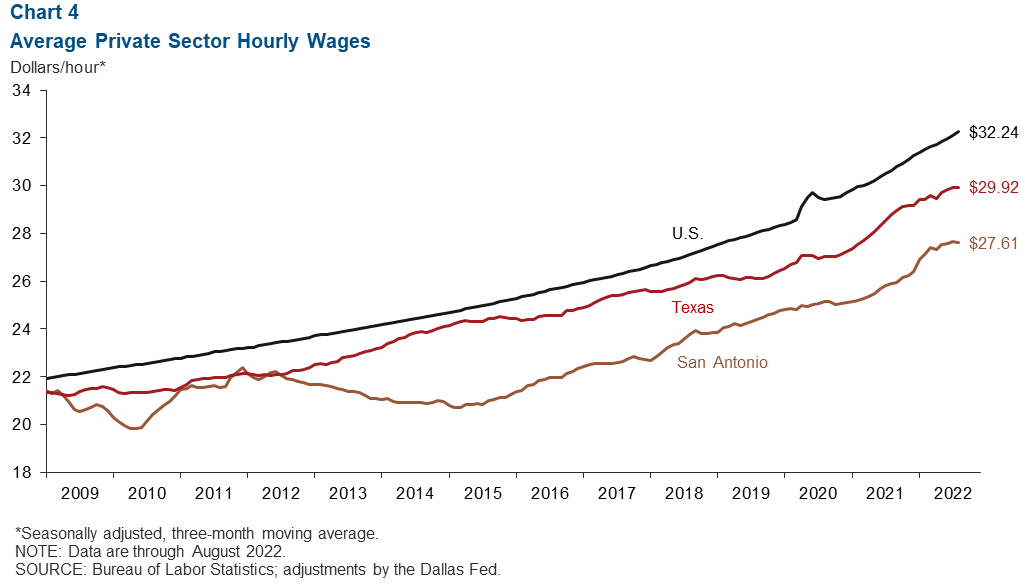
San Antonio wages stayed steady in August (Chart 4). The three-month moving average of hourly wages in San Antonio declined slightly to $27.61, below the state average of $29.92 and the national average of $32.24. The 12-month growth in wages was 6.6 percent in San Antonio, outpacing gains of 3.9 percent for Texas and 5.2 percent for the U.S.
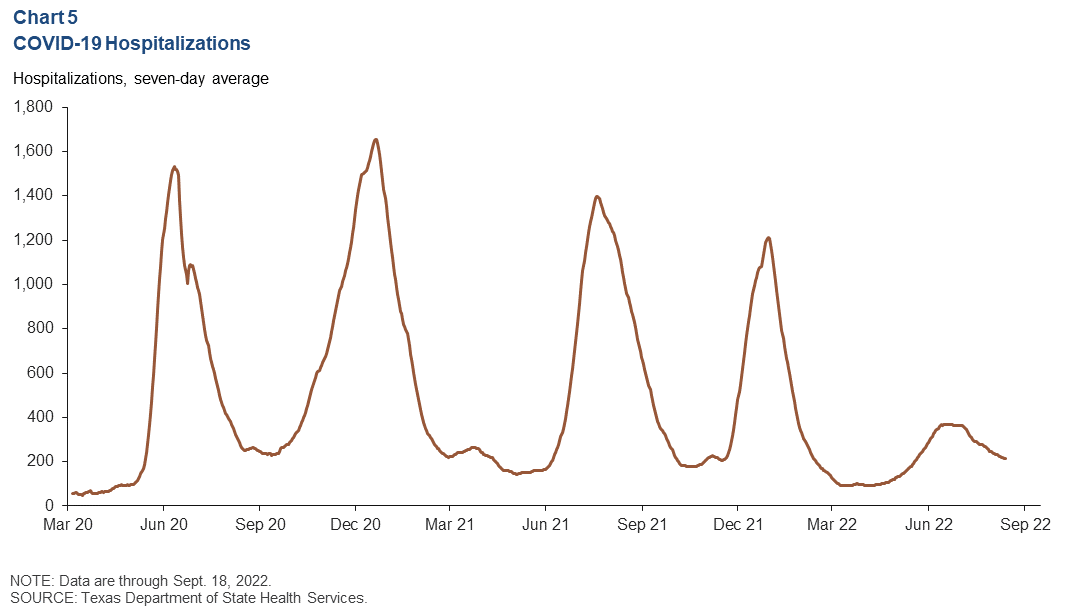
COVID-19 hospitalizations
In the week ending Sept. 18, the seven-week moving average of hospitalizations in San Antonio declined 8 percent (Chart 5). This continues a trend of declining hospitalization rates, with the numbers falling 27 percent from mid-August to mid-September.
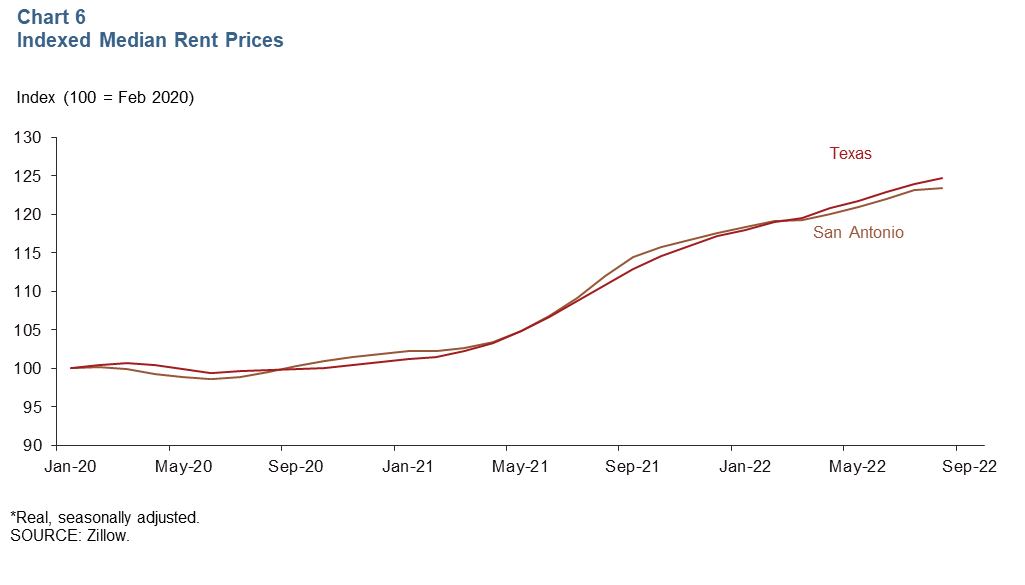
Rent prices
In August, rent prices in San Antonio increased 10.3 percent year over year, slowing from July’s annual growth of 12.9 percent. Rent price increases are slowing; the annualized monthly rate increased 2.8 percent in August compared with 11.6 percent in July. Total median rent has increased 23.5 percent in San Antonio since February 2020—less than the national average of 25.7 percent (Chart 6).
NOTES: The San Antonio payroll employment data and corresponding chart (Chart 3) were updated August 4, 2022. Data may not match previously published numbers due to revisions.
About San Antonio Economic Indicators
Questions can be addressed to Vee Kalkunte at Prithvi.Kalkunte@dal.frb.org. San Antonio Economic Indicators is published every month during the week after state and metro employment data are released.