San Antonio Economic Indicators

March 15, 2023
| San Antonio economy dashboard (January 2023) | |||
| Job growth (annualized) Nov. '22–Jan. '23 |
Unemployment rate |
Avg. hourly earnings |
Avg. hourly earnings growth y/y |
| 0.2% | 3.7% | $27.65 | 2.7% |
The San Antonio economy slowed in January, as the business-cycle index stayed steady, wages declined, and the unemployment rate ticked up. Single-family permits for new-home construction continued to fall, and housing affordability declined further.
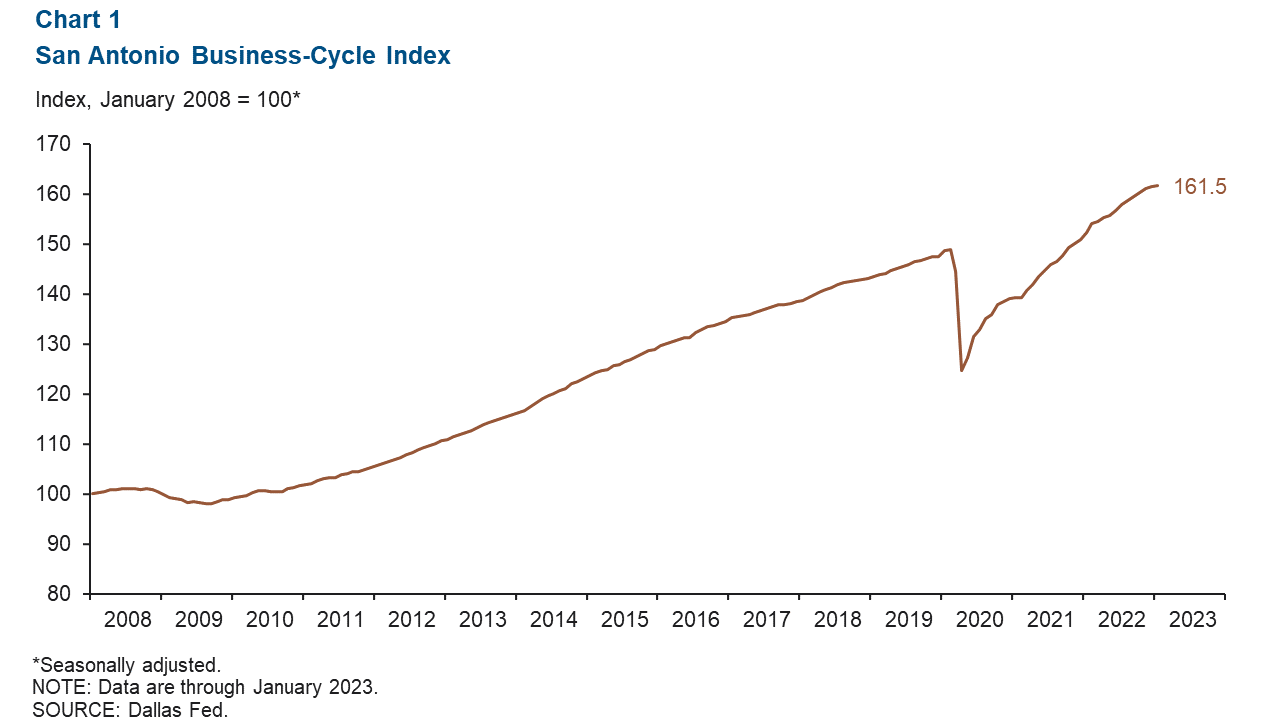
Business-cycle index
The San Antonio Business-Cycle Index—a broad measure of economic activity in the metro—grew 1.6 percent in January, slightly less than the 1.7 annualized growth in November (Chart 1).
Labor market
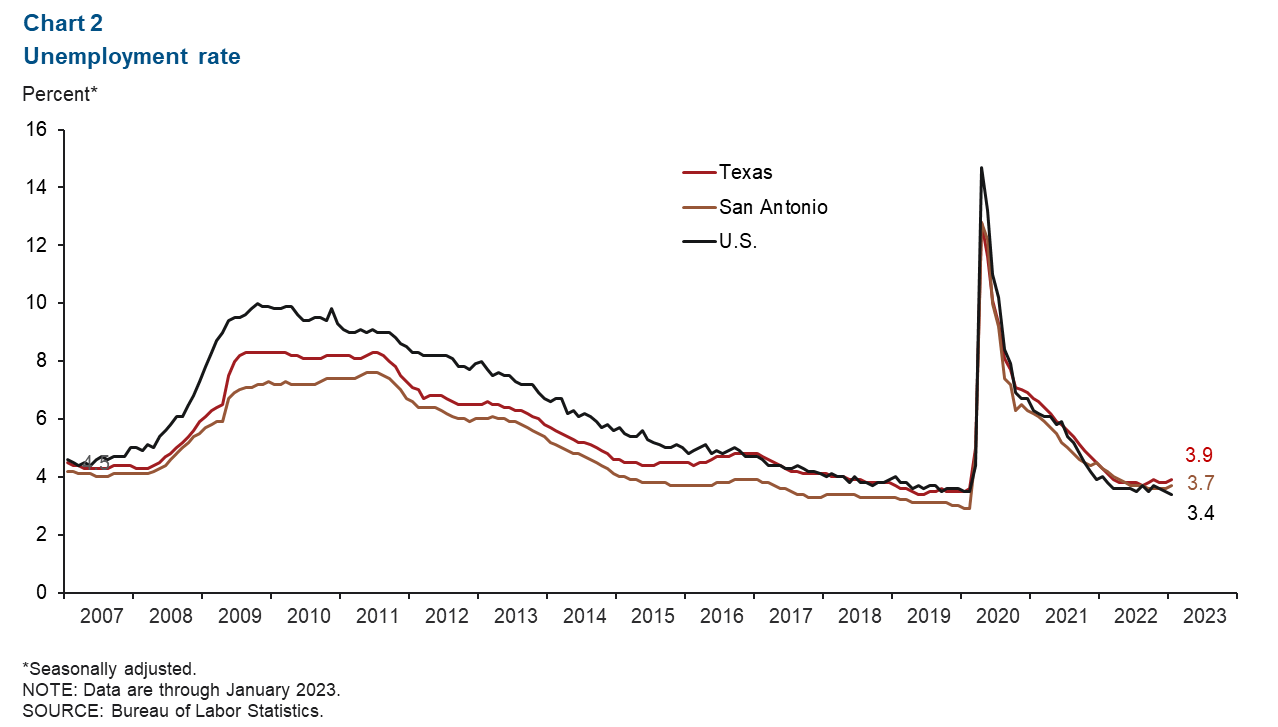
Unemployment rate edges up
San Antonio’s unemployment rate increased slightly to 3.7 percent in January (Chart 2). The metro’s unemployment rate was higher than the U.S unemployment rate of 3.4 percent but lower than the state’s 3.9 percent. This month, San Antonio’s labor force increased by an annualized 9.7 percent.
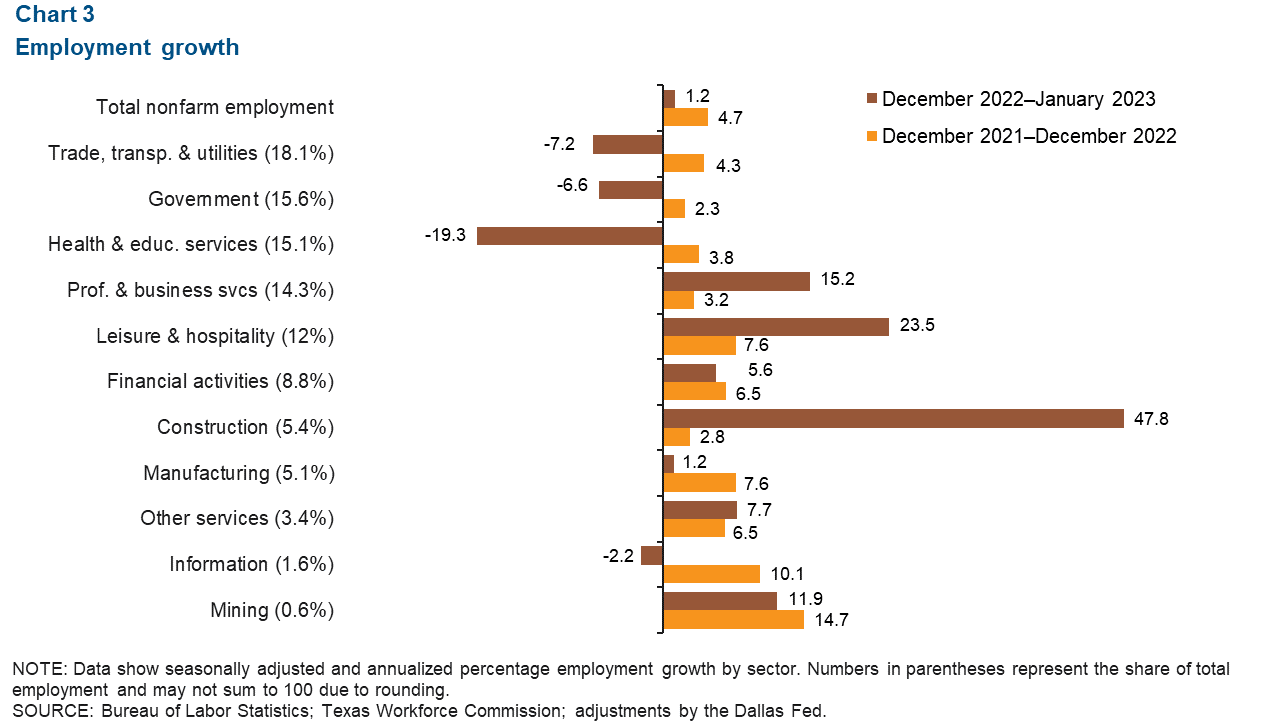
Jobs increase moderately at start of year
San Antonio payrolls increased an annualized 1.2 percent from December 2022 to January 2023 (1,177 jobs) (Chart 3). Construction experienced the most growth (47.8 percent, or 2,022 jobs) followed by leisure and hospitality (23.5 percent, or 2,511 jobs). The sectors that experienced the most declines were education and health services (19.3 percent, or 3,045 jobs), and trade, transportation and utilities (7.2 percent, or 1,286 jobs).
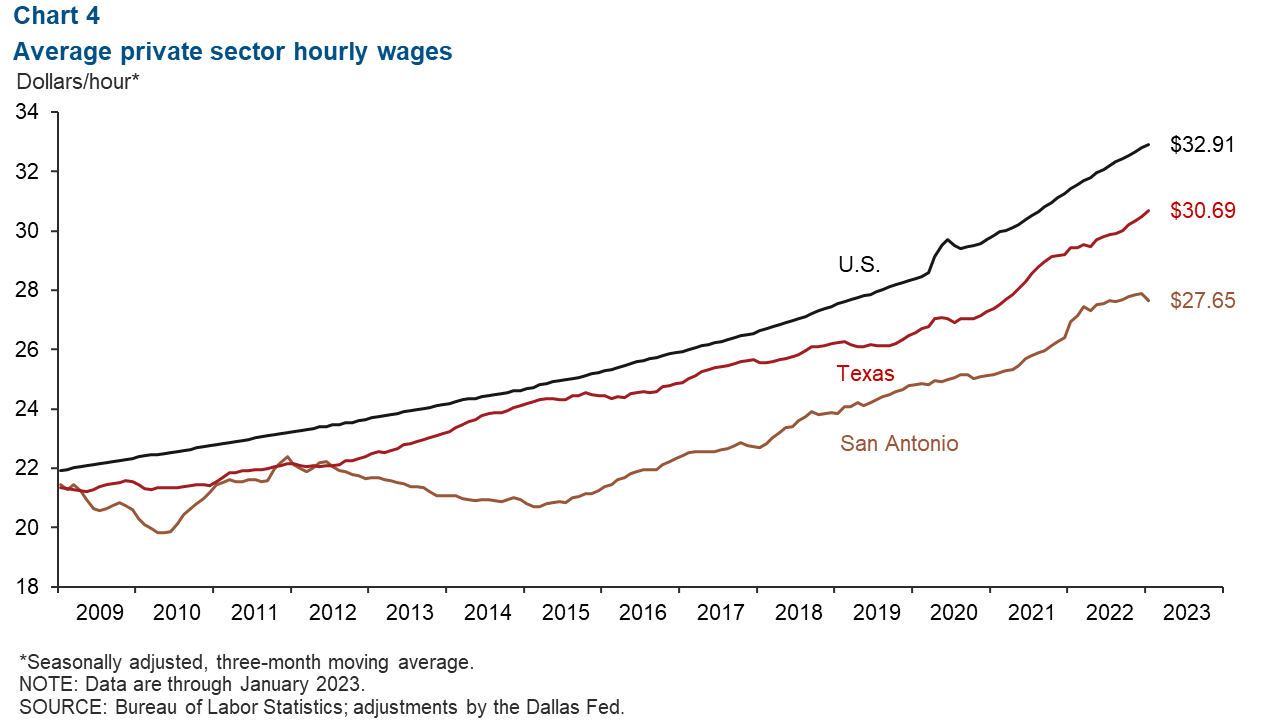
San Antonio wages fall
San Antonio wages decreased an annualized 9.6 percent in January (Chart 4). The three-month moving average of wages in San Antonio was $27.65, below both the state average of $30.69 and the national average of $32.91. In the past year, San Antonio’s wages increased 2.7 percent—lower than gains of 4.2 percent in Texas and 4.7 percent in the U.S.
Housing market
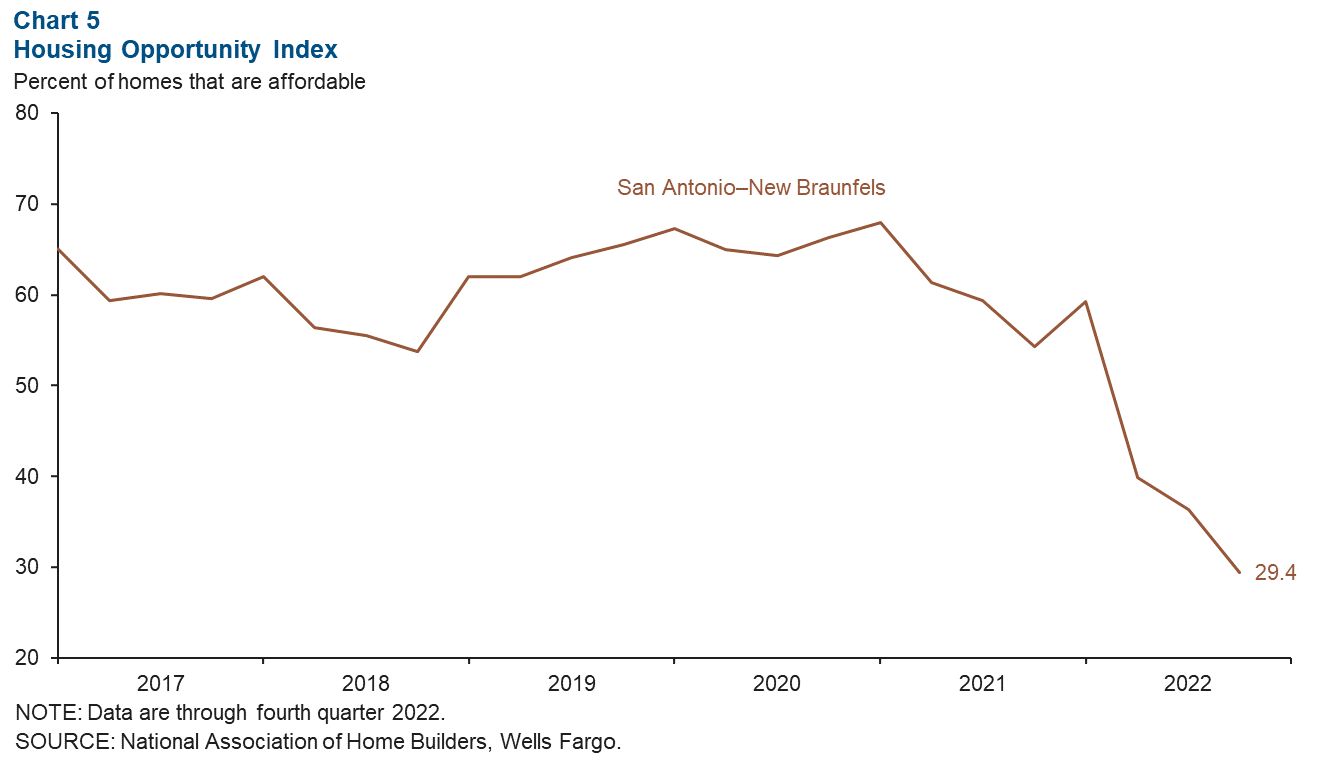
Housing affordability continues to decrease
In fourth quarter 2022, the San Antonio metro’s Housing Opportunity Index dropped 6.9 percent to 29.4 percent (Chart 5). In 2022, the index, which reflects what percentage of current homes sold are affordable to the median income earner in San Antonio, declined 29.8 percent. This is indicative of higher home prices and higher mortgage rates.
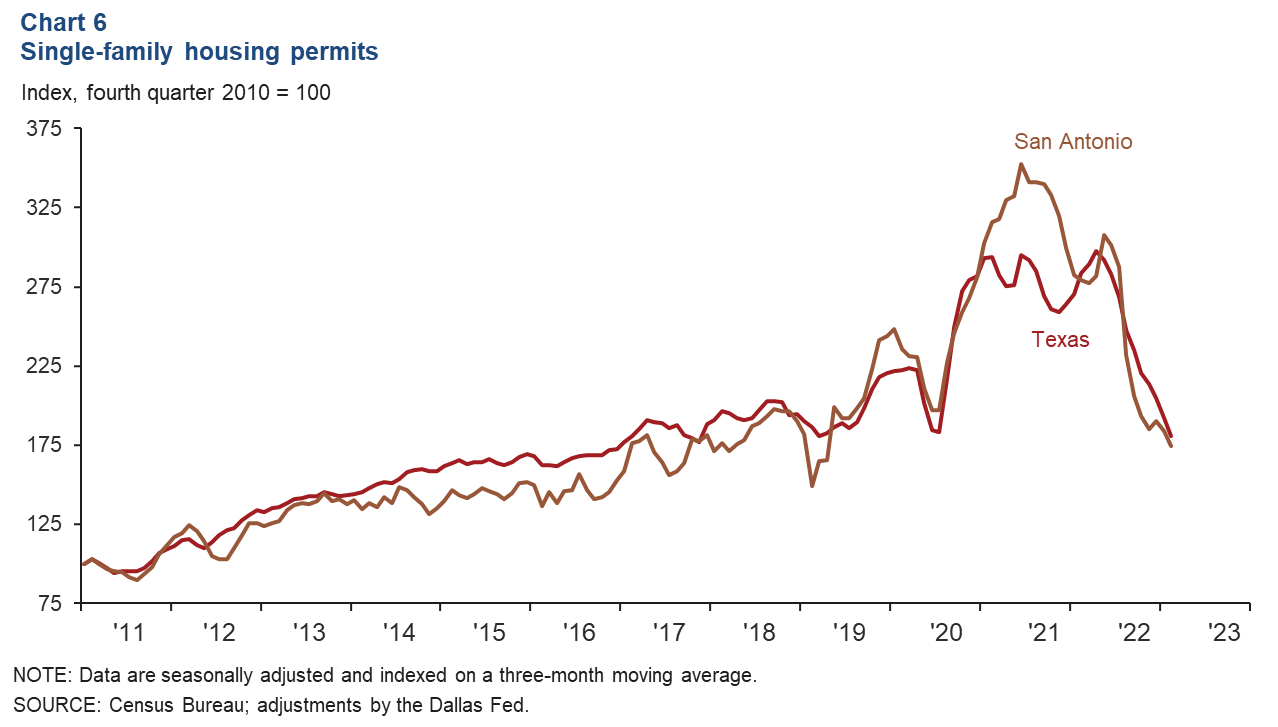
Housing permits drop to early pandemic levels
In January, San Antonio’s single-family permits fell an annualized 84.4 percent following a decrease of 32.9 percent in all of 2022 (Chart 6). This is a greater drop than Texas’ 41.8 percent annualized decline in January, and current permit levels are at rates last seen in May 2020 during the early stage of the COVID-19 pandemic.
NOTE: Data may not match previously published numbers due to revisions.
About San Antonio Economic Indicators
Questions or suggestions can be addressed to Vee Kalkunte at Prithvi.Kalkunte@dal.frb.org. San Antonio Economic Indicators is published every month during the week after state and metro employment data are released.