San Antonio Economic Indicators

| San Antonio economy dashboard (June 2023) | |||
| Job growth (annualized) March–June '23 |
Unemployment rate |
Avg. hourly earnings |
Avg. hourly earnings growth y/y |
| 2.2% | 3.4% | $27.94 | 1.5% |
San Antonio payroll jobs declined in June as the metro experienced mixed employment growth across sectors. In contrast, unemployment decreased as the labor force contracted. Existing-home sales fell, and single-family permits continued to rebound.
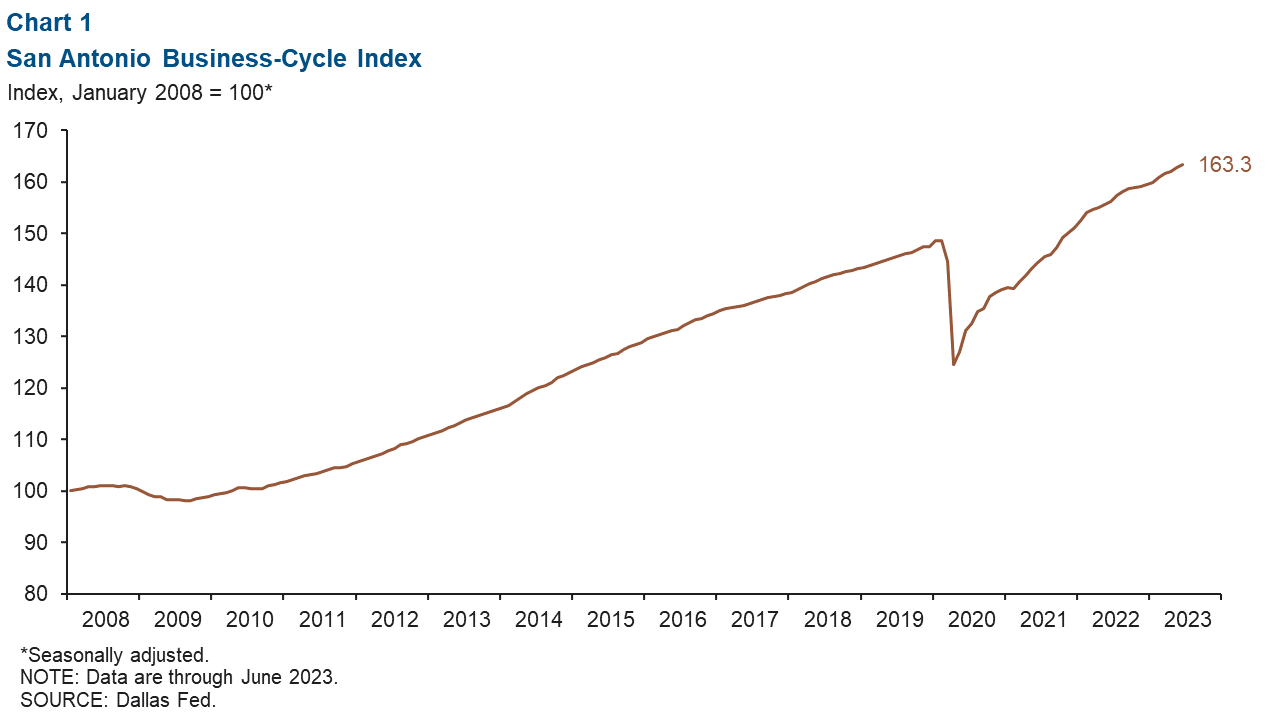
Business-cycle index
The San Antonio Business-Cycle Index—a gauge of economic conditions in the metro—rose 4.0 percent from May to June, compared with a 5.2 percent increase from April to May (Chart 1).
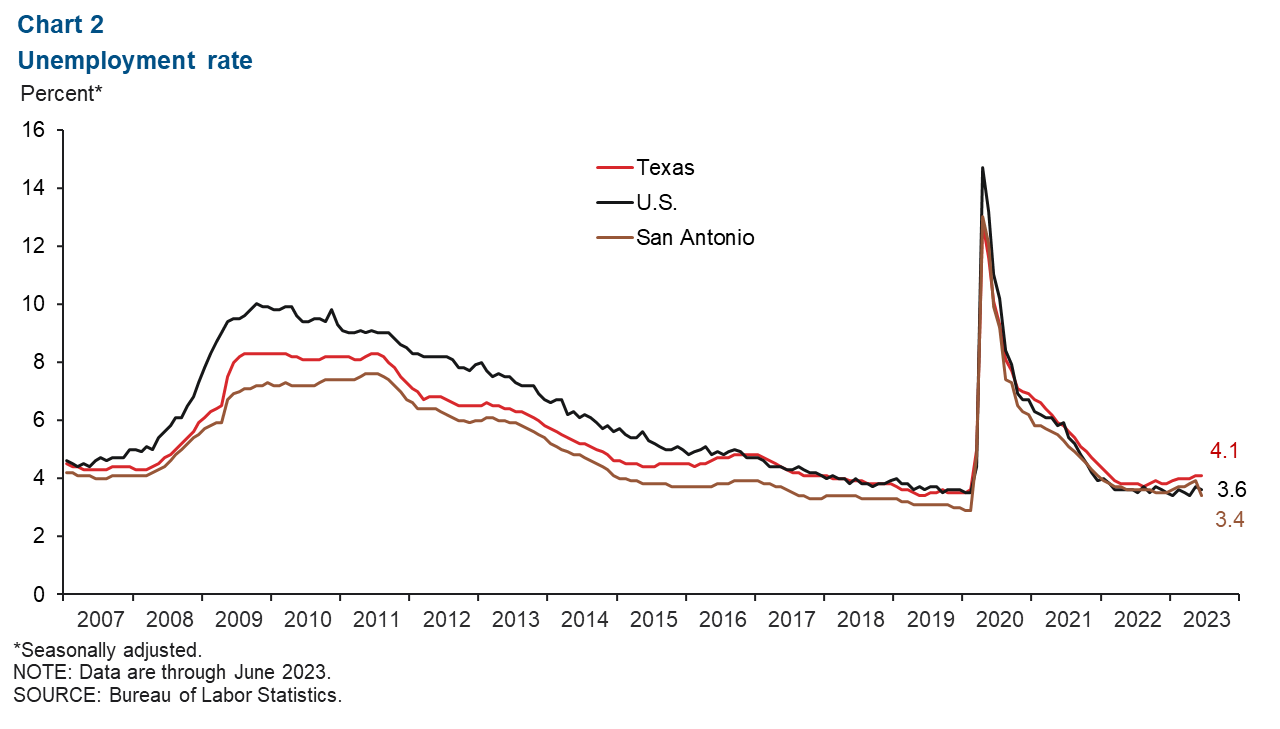
Labor market
Unemployment rate drops
The San Antonio unemployment rate declined from 3.9 percent in May to 3.4 percent in June, largely due to changes in the civilian labor force (Chart 2). The jobless rate is now lower in the metro than in the state (4.1 percent) and the U.S. (3.6 percent). In May, San Antonio’s labor force declined an annualized 6.2 percent following five months of growth.
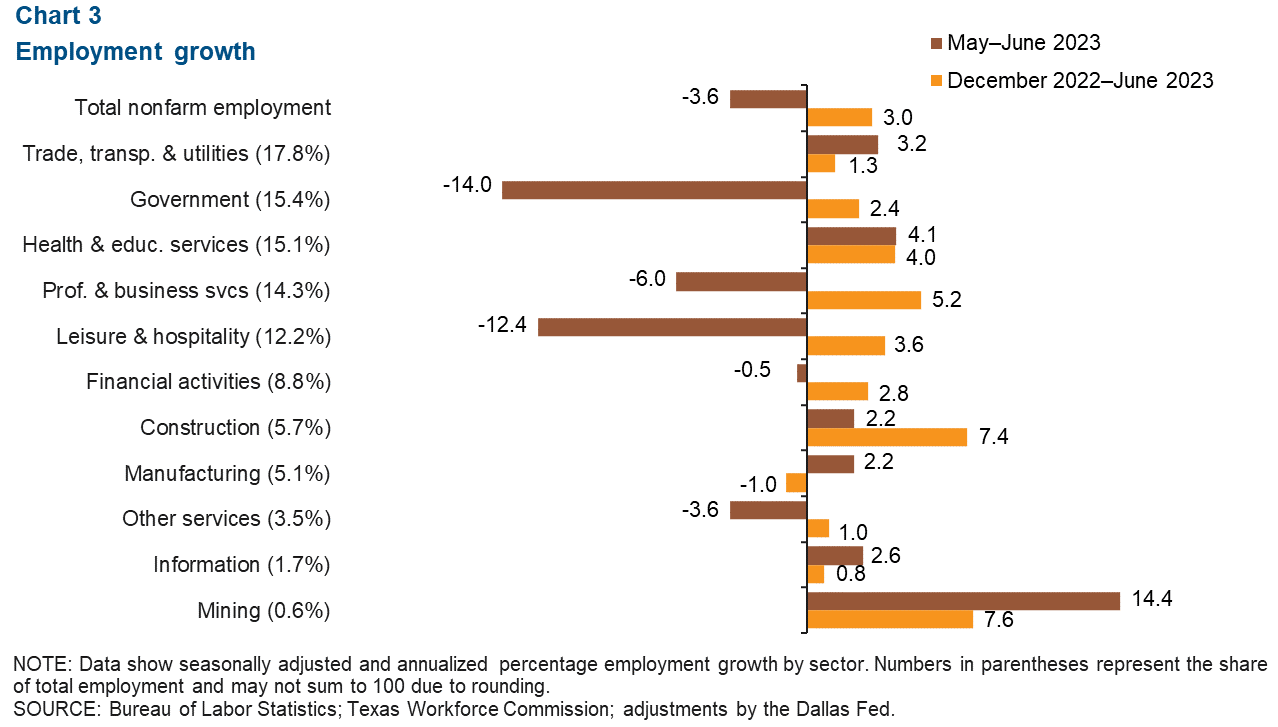
Employment growth mixed
San Antonio payrolls decreased an annualized 3.6 percent from May to June (3,486 jobs) (Chart 3). Job losses were led by the government sector (14.0 percent, or 2,253 jobs), leisure and hospitality (12.4 percent, or 1,562 jobs) and professional and business services (6.0 percent, or 854 jobs). Mining experienced significant growth (14.4 percent, or 84 jobs), while health and education services saw modest growth (4.1 percent, or 581 jobs). Year to date, total nonfarm employment has grown 3.0 percent in San Antonio, compared with gains of 3.2 percent in Texas and 2.2 percent in the U.S.
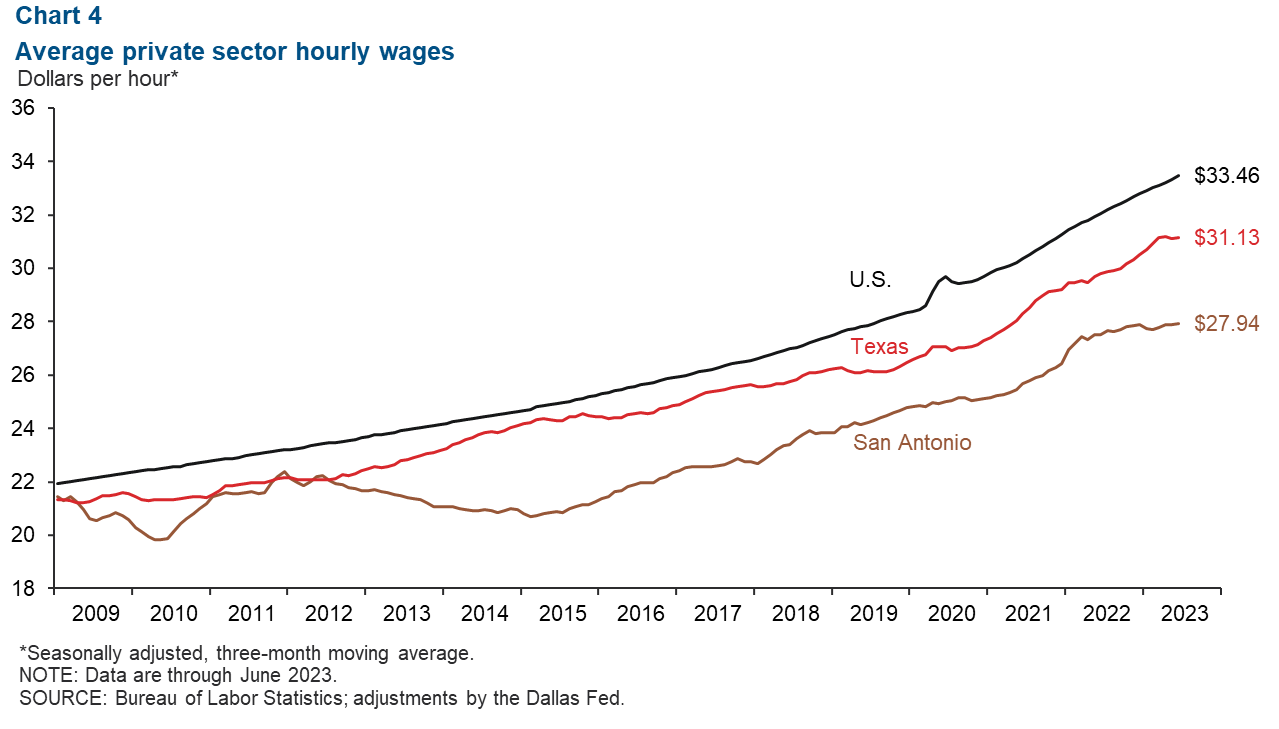
San Antonio wages inch up
San Antonio wages increased an annualized 1.7 percent in June (Chart 4). The three-month moving average of hourly wages was $27.94, below both the state average of $31.13 and the national average of $33.46. In the past year, San Antonio’s wages have increased 1.5 percent—less than gains of 4.5 percent in Texas and 4.4 percent in the U.S.
Housing market
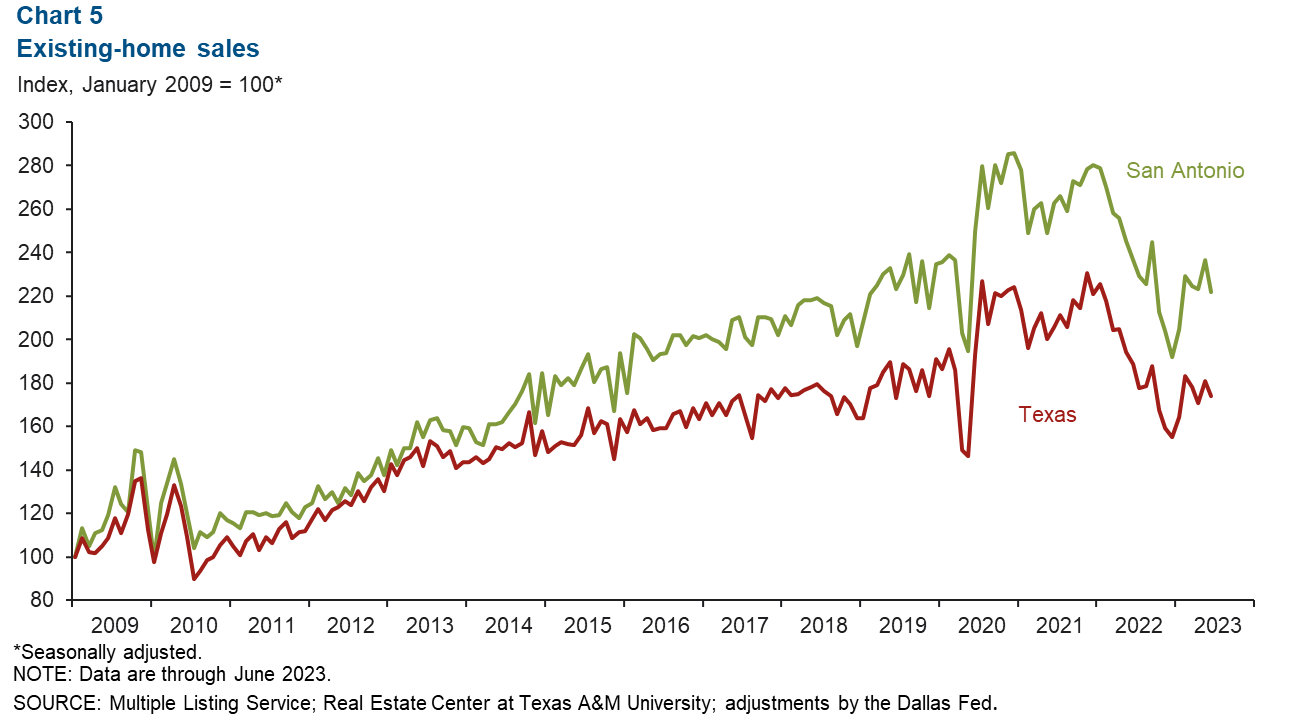
Existing-home sales decline
San Antonio’s existing-home sales fell 6.1 percent in June (Chart 5), greater than the state’s decline of 3.9 percent. Though sales rebounded in recent months from lows in late 2022, they are down 6.1 percent year over year. Sales across the state are also down (7.9 percent) compared with last June. High mortgage rates and low inventories of homes available for sale are hindering existing-home sales.
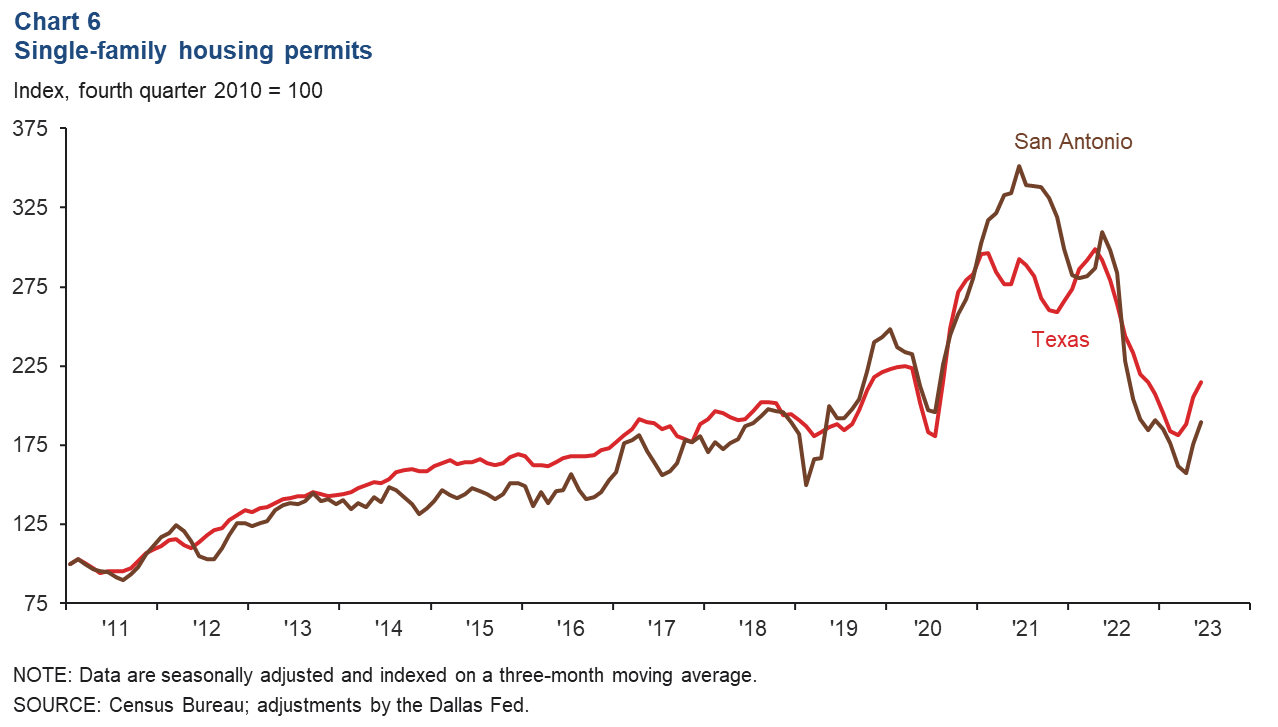
Single-family housing permits rise
San Antonio’s single-family housing permits have rebounded, up an annualized 7.9 percent in June (Chart 6). That is higher than the state’s 4.7 percent increase for the month. Year over year, however, San Antonio single-family permits are down 36.5 percent, greater than Texas’ 23.1 percent decline.
NOTE: Data may not match previously published numbers due to revisions.
About San Antonio Economic Indicators
Questions or suggestions can be addressed to Vee Kalkunte at Prithvi.Kalkunte@dal.frb.org. San Antonio Economic Indicators is published every month during the week after state and metro employment data are released.