Southern New Mexico Economic Indicators

Third Quarter 2023
| Las Cruces economy dashboard, September 2023 | |||
| Job growth (annualized) June–Sept. '23 |
Unemployment rate |
Avg. hourly earnings |
Avg. hourly earnings y/y |
| -0.5% | 4.4% | $26.20 | -2.1% |
The Las Cruces economy was weak in the third quarter. Employment fell broadly, and the unemployment rate increased. Home listings surged, but home prices were little changed. Trade volumes rose in August but were down year-over-year. The oil and gas drilling rig count declined in September and October, and crude oil production softened. Potash prices stabilized while copper prices cooled.
Labor market
Payrolls contract
Las Cruces employment fell an annualized 0.5 percent (-100 jobs) in the third quarter (Chart 1). Employment declines were broad based across sectors, with the largest losses in leisure and hospitality (-346), government (-253) and professional and business services (-249).
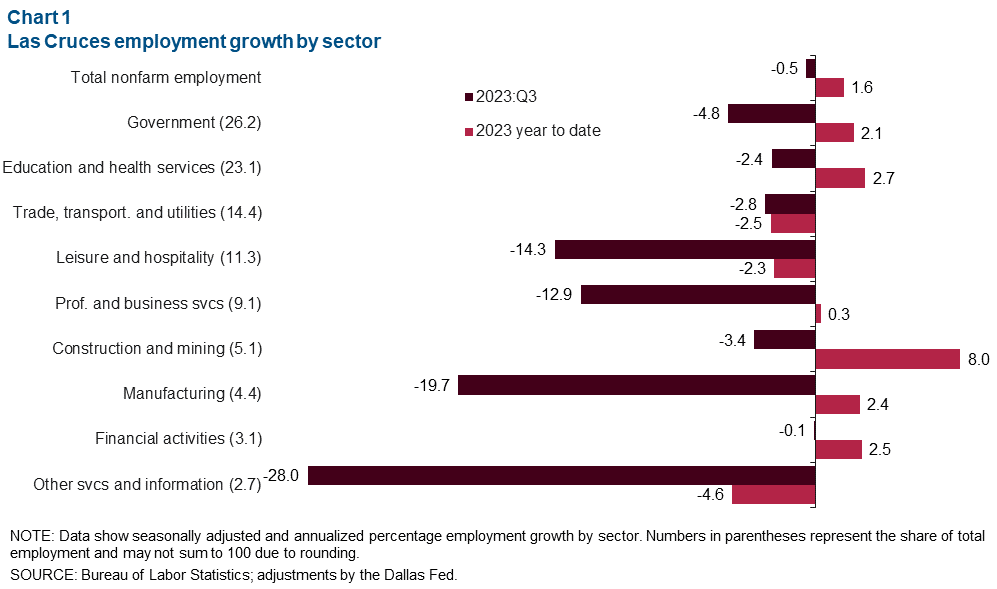
Despite contracting payrolls in the third quarter, total nonfarm employment has grown 1.6 percent year-to-date (900 jobs) due to moderate employment growth in the first and second quarters. Employment growth was driven by education and health services (362), government (315), and construction and mining (224). Meanwhile, the trade, transportation and utilities (-213), leisure and hospitality (-152), and other services and information (-75) sectors lost jobs this year.
Unemployment rises
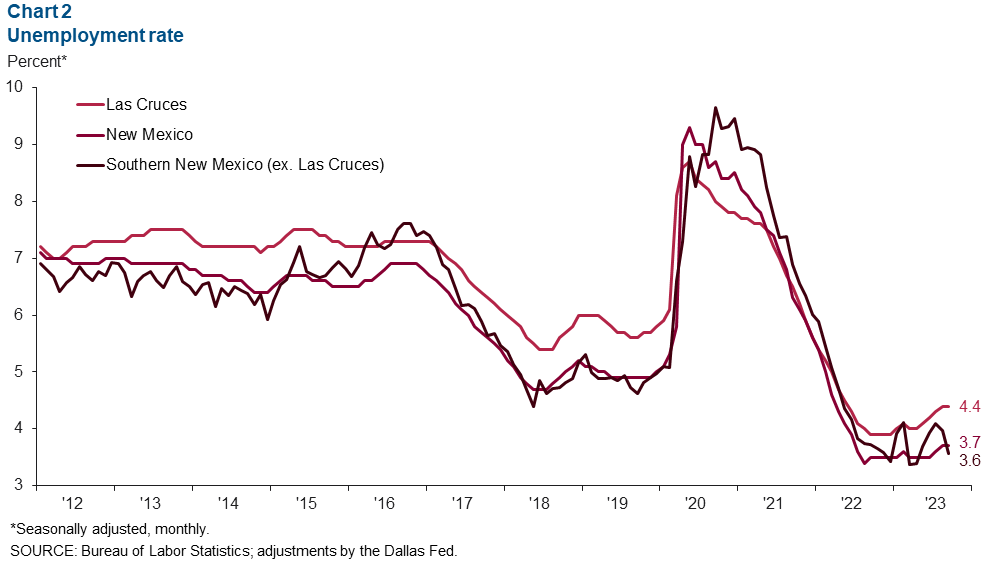
Las Cruces’ unemployment rate increased from 4.2 percent in June to 4.4 percent in September (Chart 2). Unemployment in southern New Mexico, excluding Las Cruces, dipped to 3.6 percent in the third quarter. Statewide unemployment edged up to 3.7 percent.
Housing
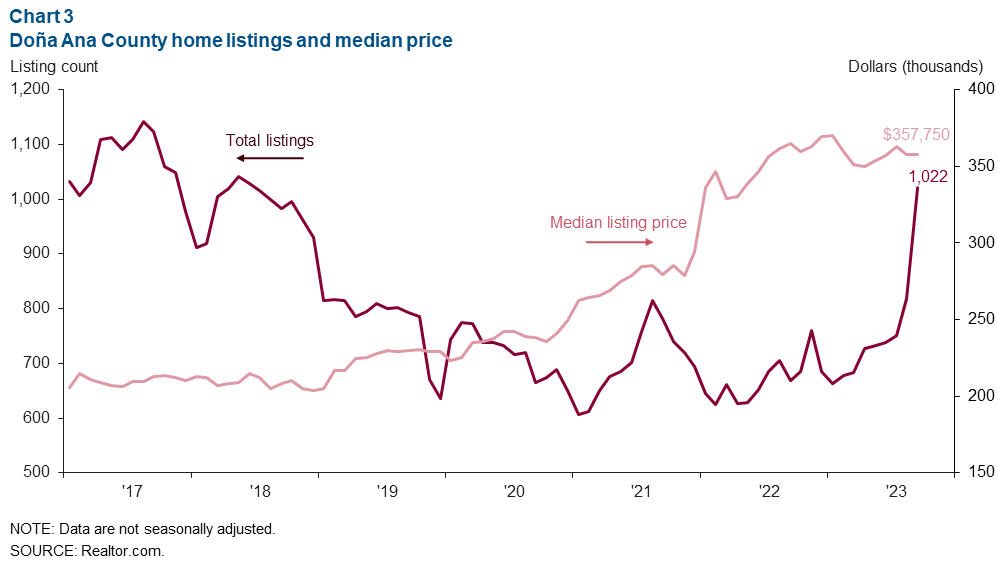
The housing market in Doña Ana County, home to Las Cruces, saw a 38.5 percent spike in total listings in the third quarter (Chart 3). Listings rose from 738 in June to 1,022 in September. Meanwhile, median home prices remained relatively stable, growing only 0.3 percent in the third quarter to $357,750 in September.
Cross-border trade
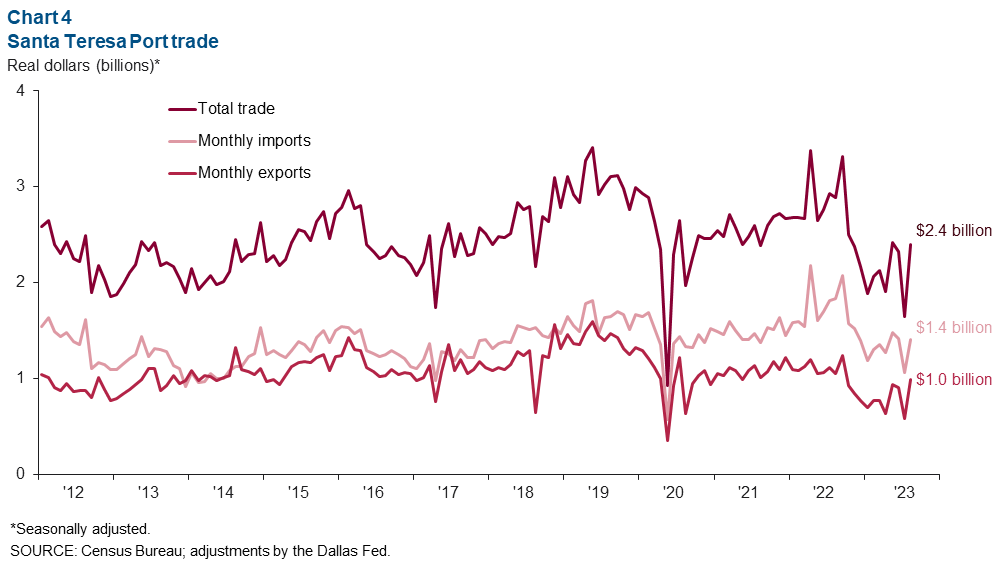
Monthly trade through the Santa Teresa port totaled $2.4 billion in August, down 17.1 percent from August 2022 (Chart 4). Exports fell 6.1 percent from August 2022, while imports fell 23.4 percent. However, month-over-month trade rose strongly in August up 45.9 percent.
Commodity markets
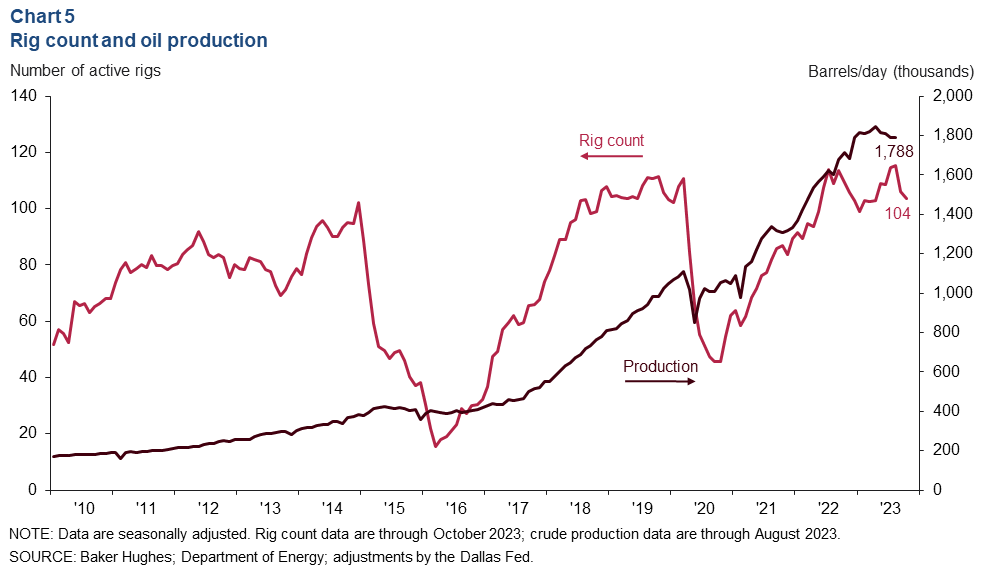
Rig count falls; crude production cools
The New Mexico rig count declined from 106 in September to 104 in October (Chart 5). The decline comes after the rig count reached a record high of 115 in July and August. Crude oil production also softened, falling from 1,808 barrels a day in June to 1,788 in August. However, production was up 11.5 percent year over year in August.
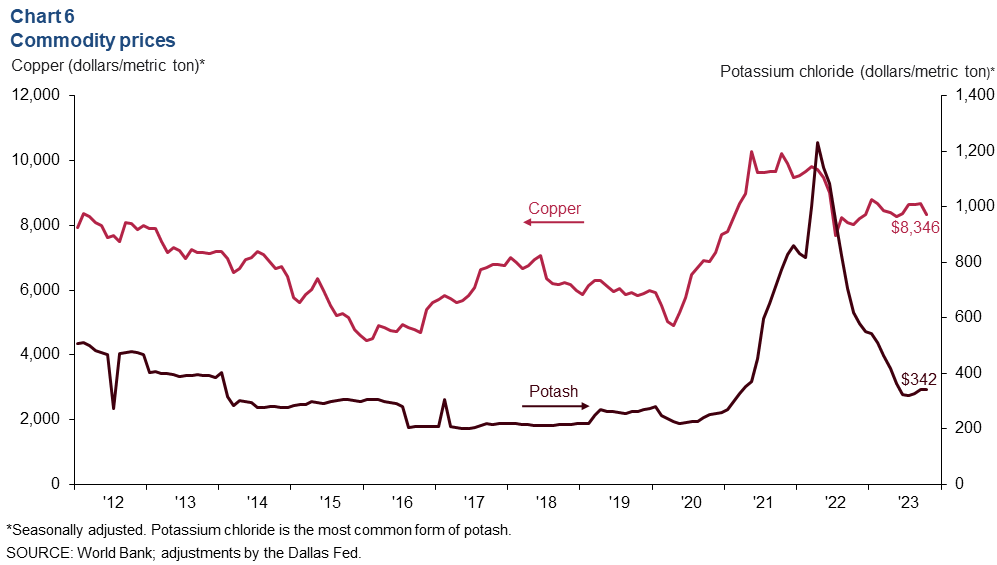
Potash prices plateau while copper prices soften
In addition to oil and natural gas, southern New Mexico’s economy is dependent on commodities such as potash, copper and silver. Potassium chloride is the most common form of potash. The price of potash, which is used in fertilizer, increased dramatically after producer Russia invaded Ukraine in early 2022 and was hit with sanctions. Potash prices peaked in April 2022 and declined significantly since then. In recent months potash prices have begun to plateau and ticked up in October, reaching $342 per metric ton (Chart 6). Meanwhile, copper prices fell 3.7 percent in October to $8,346 per ton.
NOTES: Data may not match previously published numbers due to revisions. All New Mexico counties within the Federal Reserve’s Eleventh District are counted as part of southern New Mexico. Las Cruces is excluded from southern New Mexico to better gauge unemployment levels outside the region’s largest population center.
About Southern New Mexico Economic Indicators
Questions or suggestions can be addressed to Aparna Jayashankar at Aparna.Jayashankar@dal.frb.org. Southern New Mexico Economic Indicators is released quarterly.