Southern New Mexico Economic Indicators

Third Quarter 2024
| Las Cruces economy dashboard, September 2024 | |||
| Job growth (annualized) June–Sept. '24 |
Unemployment rate |
Avg. hourly earnings |
Avg. hourly earnings y/y |
| 0.0% | 4.9% | $25.40 | -3.7% |
Economic activity was sluggish in Las Cruces in the third quarter. Employment was flat, and unemployment continued to rise. Hourly earnings slid further continuing a pattern since early 2023. Crude oil production hit new highs in July, but the rig count was flat year over year in September. Copper prices in September are higher relative to the beginning of the year; however, potash prices have ticked down over the same period.
Labor market
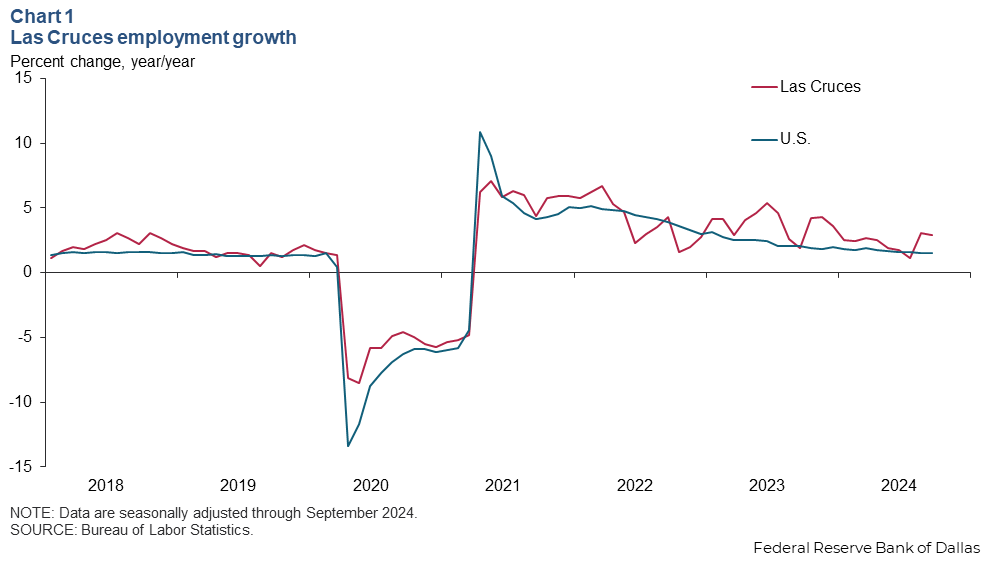
Las Cruces payrolls hold steady in the third quarter
Payrolls were flat in Las Cruces in the third quarter as gains in education and health services and construction and mining were offset by losses in other sectors. Year over year, Las Cruces grew robustly, with employment rising 2.9 percent (2,300 jobs) in September (Chart 1). Government and education and health services were leaders in growth. Payrolls in construction and mining, manufacturing and trade, transportation and utilities were flat.
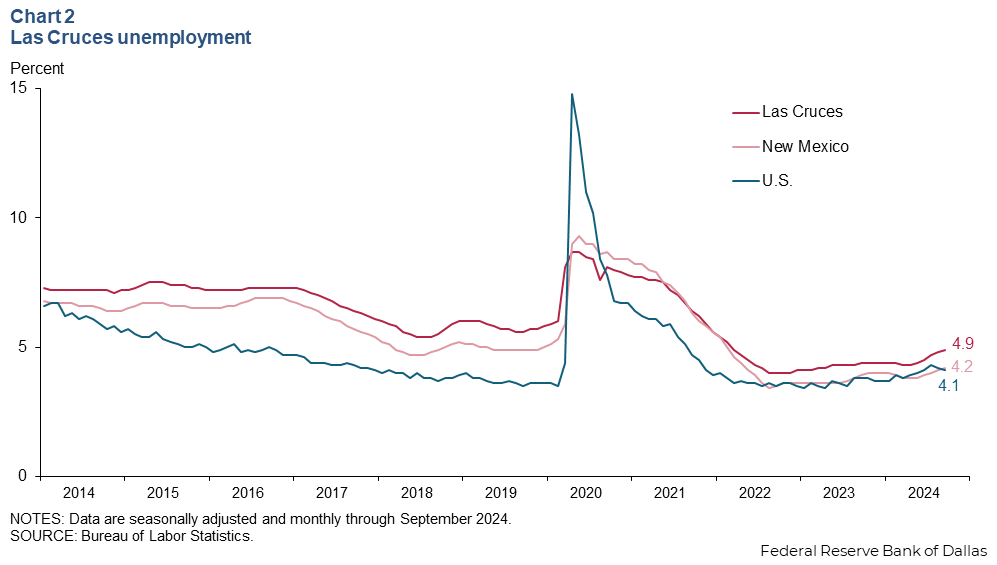
Unemployment increases
The unemployment rate in Las Cruces ticked up to 4.9 percent in September, the highest level since March 2022 (Chart 2). New Mexico’s unemployment rate similarly increased to 4.2 percent in September. While the state and metro unemployment rates have been ticking up, national unemployment has slid in recent months. The U.S. unemployment rate in September was 4.1 percent, a decline from July’s 4.3 percent.
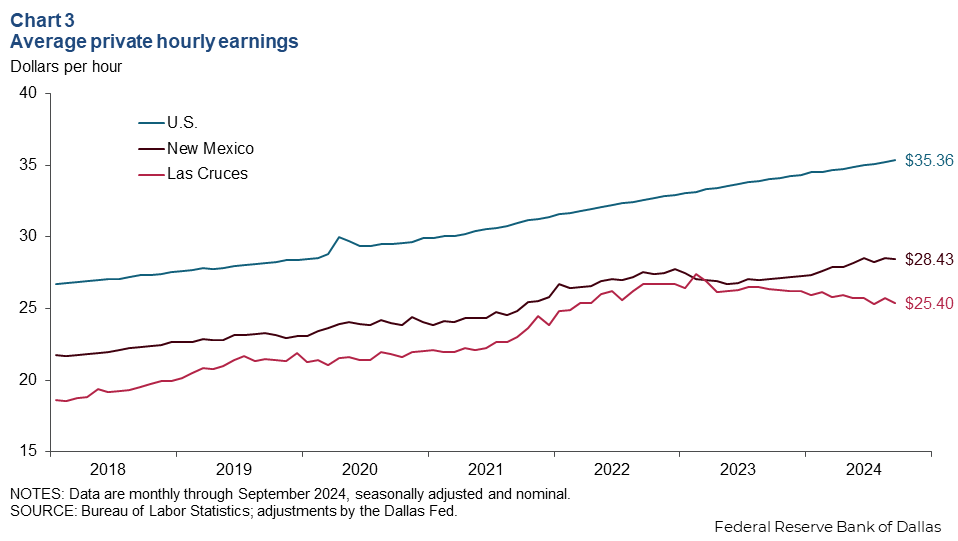
Hourly earnings continue to slide in the metro area
Nominal hourly earnings in Las Cruces continued to tick down. In September, seasonally adjusted average hourly private earnings were $25.40, down from $25.71 in August (Chart 3). Hourly earnings were down 3.7 percent from September 2023. Statewide earnings also ticked down to $28.43 in September from $28.56 in August. However, earnings have been steadily rising in New Mexico since early 2023 and were up 5.2 percent year over year in September. U.S. hourly earnings exceeded both New Mexico and Las Cruces at $35.36; however, the nation’s 4.0 percent year-over-year wage growth in September lagged the state’s increase.
Commodity markets
Crude oil production reaches new highs
Production of crude oil in New Mexico reached 2.04 million barrels per day (mb/d) in July 2024 (Chart 4). The state has been experiencing rapid growth in oil and natural gas production as drillers tap into the productive Delaware Basin in the southeast corner of the state. In July 2023, the state produced 1.75 mb/d of crude oil.
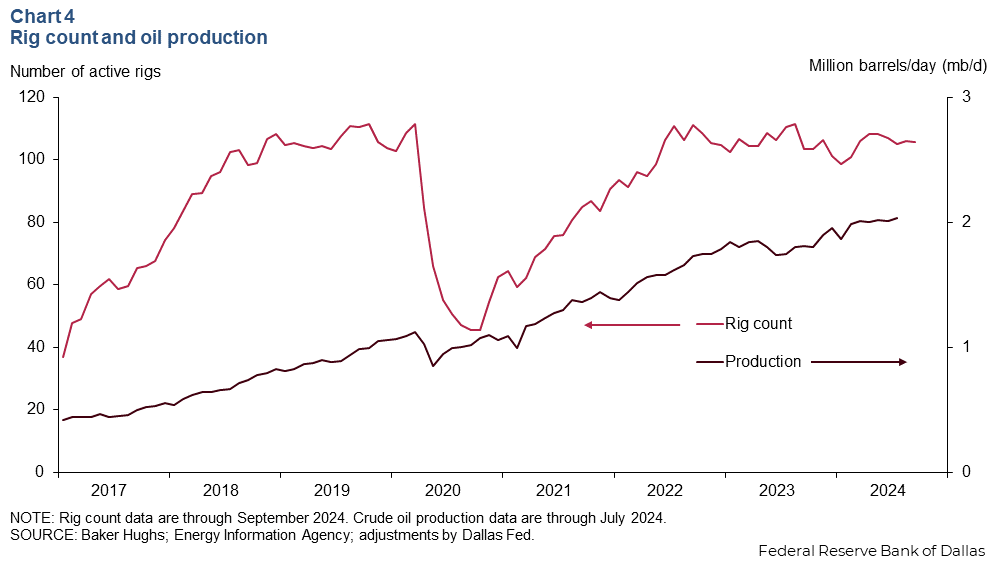
The average monthly rig count in New Mexico was 106 rigs in September 2024. This is little changed from 103 active rigs in September 2023. Recent improvements in oil field efficiency allowed energy production to expand without an increase in the rig count.
Copper prices tick up and potash prices cool
In addition to oil and natural gas, southern New Mexico also produces commodities such as potassium chloride, copper and silver. The price of potassium chloride, which is used in fertilizer, increased dramatically after Russia, a major producer, was hit with sanctions after its invasion of Ukraine in early 2022. Potassium chloride is a form of potash. Potassium chloride prices in September 2024 were $281 per metric ton, down from $318 in January 2024 and well below its recent peak of $1,209 in April 2022 (Chart 5).
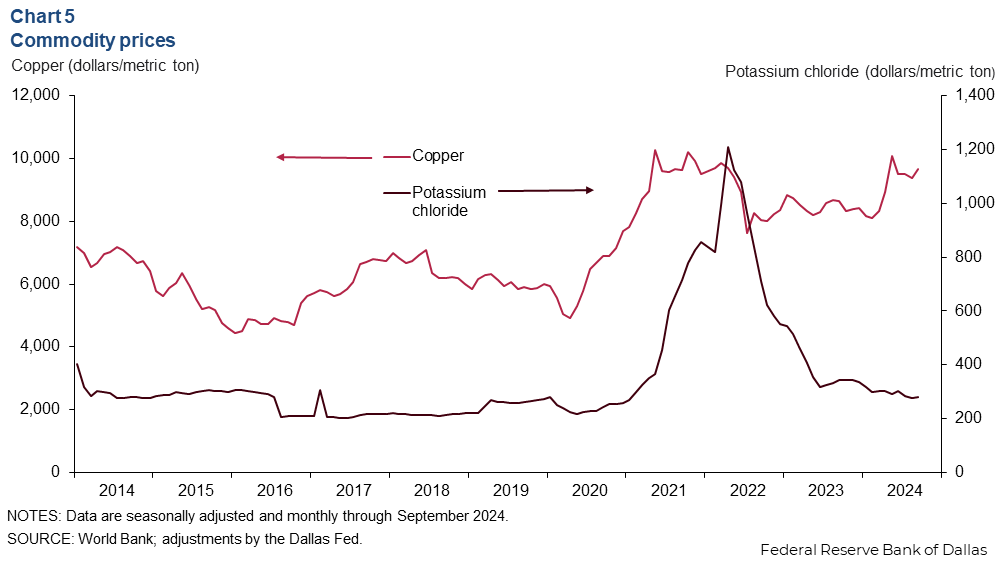
Copper prices in September were $9,664 per metric ton. This is up from $8,159 in January but down from a mid-year spike in May when prices rose to over $10,000 per metric ton.
NOTES: Data may not match previously published numbers due to revisions. All New Mexico counties within the Federal Reserve’s Eleventh District are counted as part of southern New Mexico.
About Southern New Mexico Economic Indicators
Questions or suggestions can be addressed to Robert Leigh at Robert.Leigh@dal.frb.org. Southern New Mexico Economic Indicators is released quarterly.