Southern New Mexico Economic Indicators

| Las Cruces economy dashboard, June 2025 | |||
| Job growth (annualized) March '25–June '25 |
Unemployment rate |
Avg. hourly earnings |
Avg. hourly earnings y/y |
| 2.0% | 4.4% | $24.82 | -3.6% |
Employment in Southern New Mexico grew in the second quarter. The unemployment rate fell but remained higher than the state and nation. Oil production fell from March through May, and the rig count held steady in July but was down from March. Copper and potash prices rose in the second quarter, while trade activity declined in May.
Labor market
Las Cruces employment grows robustly
Employment in Las Cruces grew at an annualized 2.0 percent (400 jobs) in the second quarter of 2025 (Chart 1). The leisure and hospitality, professional and business services, and education and health sectors posted the strongest job growth. Employment contracted in several sectors including the large trade, transportation and utilities sector, which makes up nearly 15 percent of the metro area’s employment. Manufacturing, financial activities, and information and other services also posted job declines, but these sectors are relatively small.
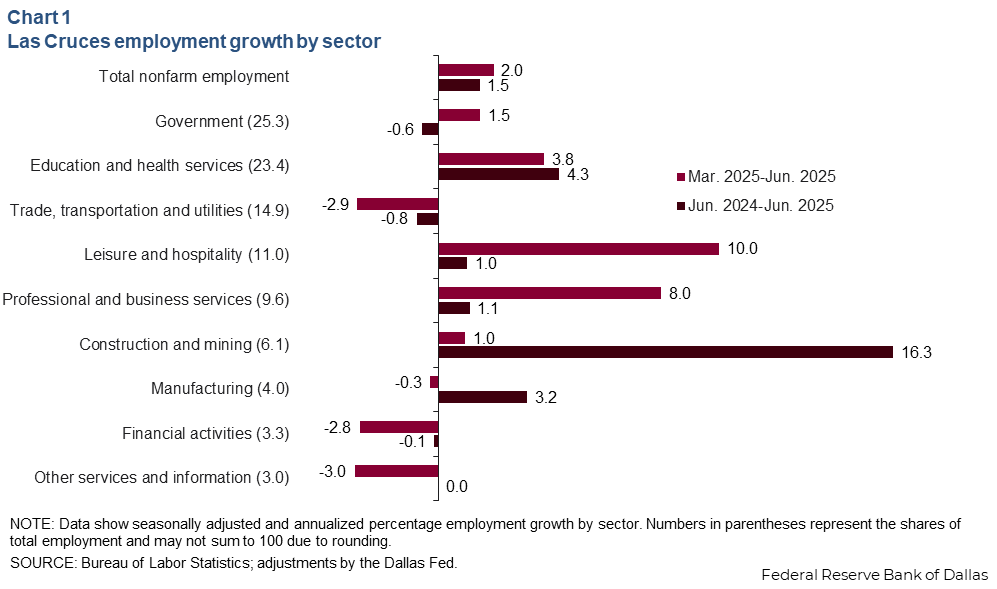
Year over year, employment in Las Cruces grew 1.5 percent (1,200 jobs) in June. Construction and mining employment grew 16.3 percent (700 jobs). This sector is relatively small and may be subject to larger revisions. The education and health services sector grew a robust 4.3 percent (790 jobs). The government and trade, transportation and utilities sectors posted slight declines, falling 0.6 percent (-120 jobs) and 0.8 percent (-100 jobs), respectively.
Unemployment ticks down
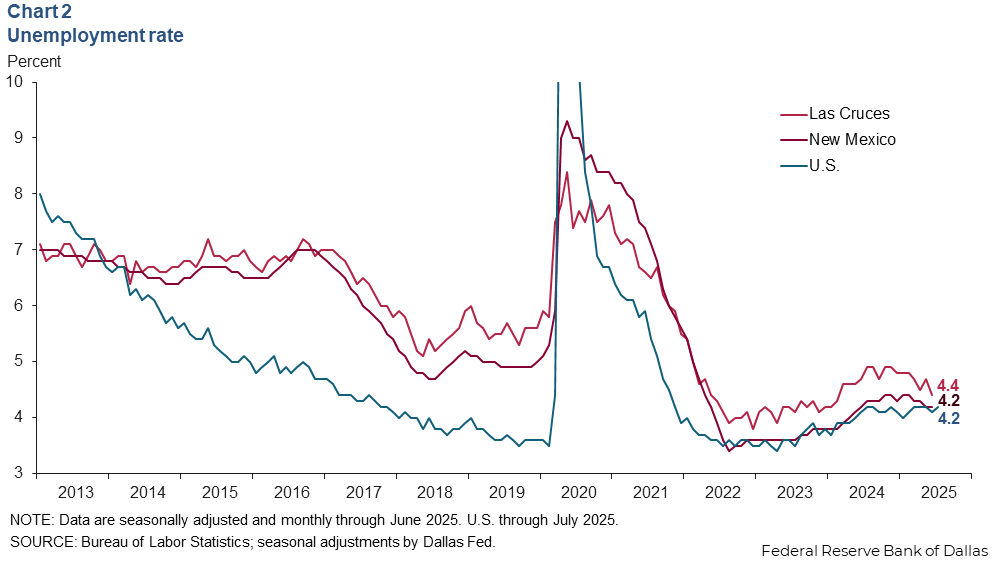
The unemployment rate in Las Cruces declined to 4.4 percent in June 2025 (Chart 2). This is below the 4.7 percent jobless rate in March but notably higher than the state and national jobless rates. New Mexico’s unemployment rate was 4.2 percent in June, down from 4.3 percent in March. The national unemployment rate ticked up to 4.2 percent in July from 4.1 percent in June but was unchanged from March.
Commodities
Oil production falls
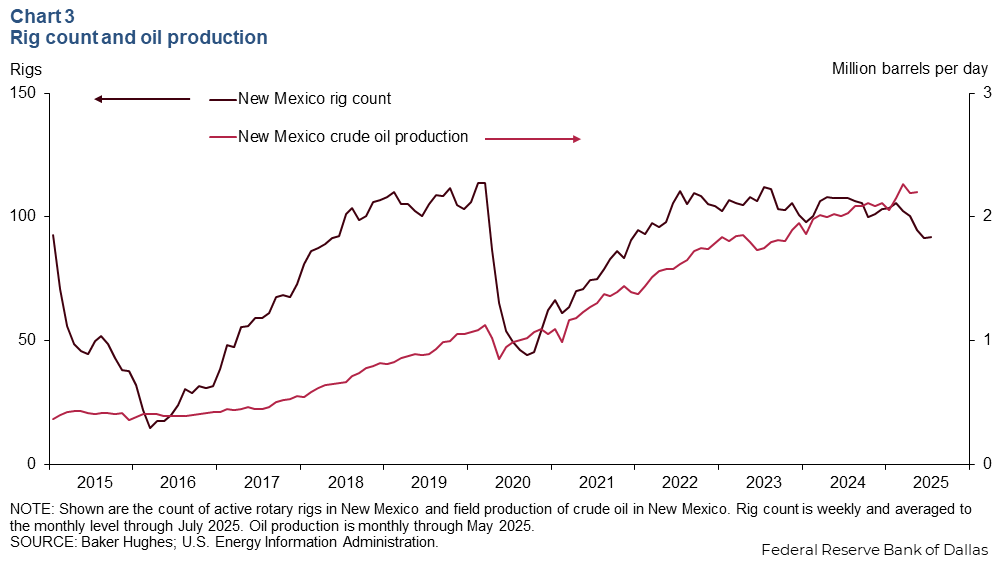
New Mexico’s production of crude oil ticked down from 2.27 million barrels per day (mb/d) in March to 2.20 mb/d in May (Chart 3). Year over year, oil production in the state grew 8.9 percent. The number of active rotary rigs in New Mexico ticked down to 92 in July from 103 in March.
Copper prices surge
In addition to oil and natural gas, southern New Mexico also produces commodities such as potassium chloride and copper. The three-week moving average of copper spot prices ticked down to $5.45 per pound the week ending August 1 from an all-time high of $5.56 per pound the week ending July 25 in part due to shifting trade policies (Chart 4).
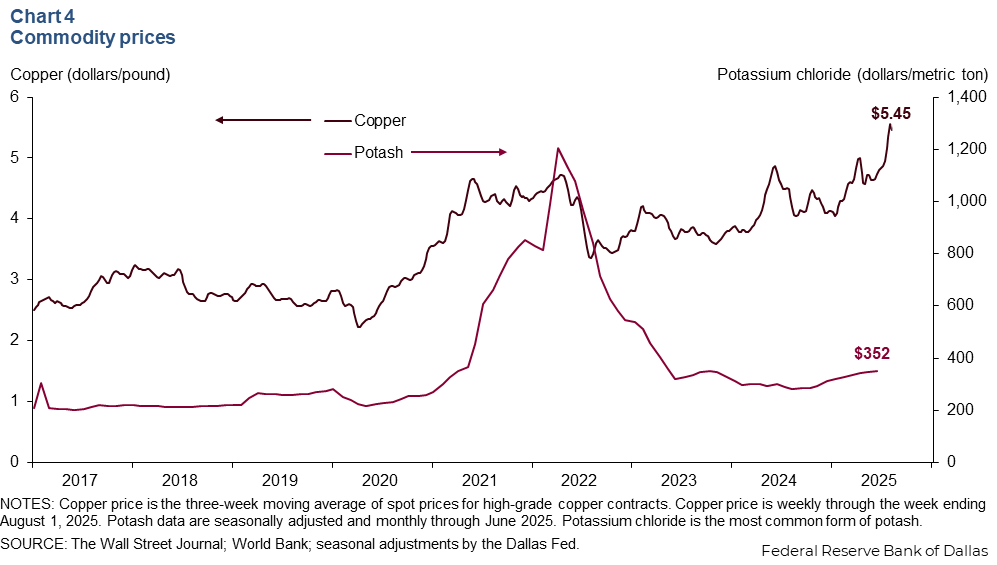
Potassium chloride is a form of potash, which is commonly used in fertilizer. Potassium chloride prices rose to $352 per metric ton in June. Prices have been rising steadily since third quarter 2024. Year over year, potassium chloride prices were up 17 percent.
Trade
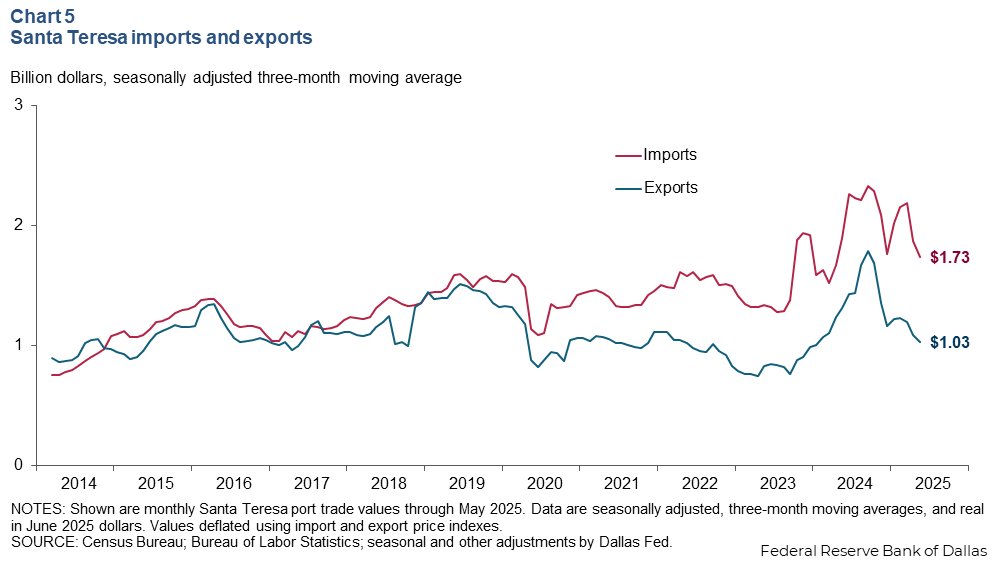
The three-month moving average of real import values through the Santa Teresa port declined to $1.73 billion in May 2025 (Chart 5). Real exports similarly fell to $1.03 billion. From May 2024 to May 2025, imports fell 21 percent while exports fell 9 percent.
NOTES: Data may not match previously published numbers due to revisions. All New Mexico counties within the Federal Reserve’s Eleventh District are counted as part of southern New Mexico.
About Southern New Mexico Economic Indicators
Questions or suggestions can be addressed to Robert Leigh at Robert.Leigh@dal.frb.org. Southern New Mexico Economic Indicators is released quarterly.