Southern New Mexico Economic Indicators

| Las Cruces economy dashboard, August 2025 | |||
| Job growth (annualized) May '25–August '25 |
Unemployment rate |
Avg. hourly earnings |
Avg. hourly earnings y/y |
| 4.0% | 4.9% | $24.58 | -4.4% |
Economic activity increased moderately in Las Cruces, N.M., in the third quarter. Employment rose, and unemployment was flat. Annual growth in home price indexes showed a price surge in the second quarter, but more timely sale price data showed flat prices in August. Apartment rent growth was subdued in August, while home building permits declined in the third quarter. Crude oil production in the state hit new highs in July, and the rig count increased slightly during the third quarter. Meanwhile, copper prices increased in October.
Labor market
Las Cruces grew moderately with payroll employment rising 1.7 percent (1,400 jobs) from August 2024 to August 2025 (Chart 1). Mining, logging and construction and education and health services were leaders in growth during the period, while payroll employment in trade, transportation and utilities declined.
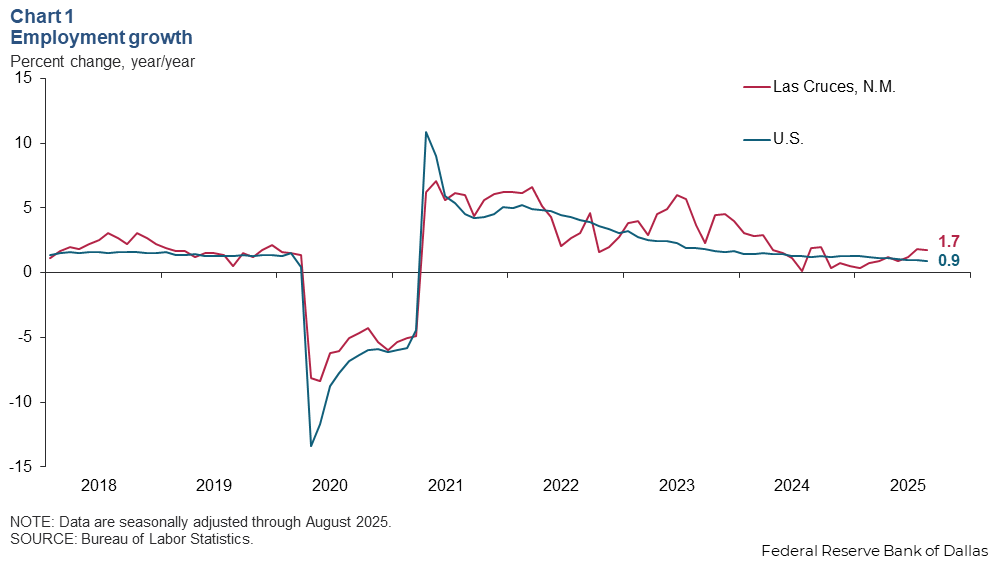
In the three months ending in August, payroll employment increased an annualized 4.0 percent in Las Cruces. Growth was mostly driven by the education and health services and trade, transportation and utilities sectors.
Residential real estate
Home price growth surges in the second quarter
Home prices accelerated in the second quarter. Year-over-year growth in the Las Cruces Federal Housing Finance Administration (FHFA) house price index increased to 6.6 percent in the second quarter from 1.4 percent in the first quarter (Chart 2). This is significantly higher than the nation’s 3.8 percent year-over-year growth rate in the second quarter. The median sale price for single-family homes in Las Cruces calculated by Zillow dipped 0.3 percent year over year in August 2025, while U.S. median sale prices grew 1.9 percent.
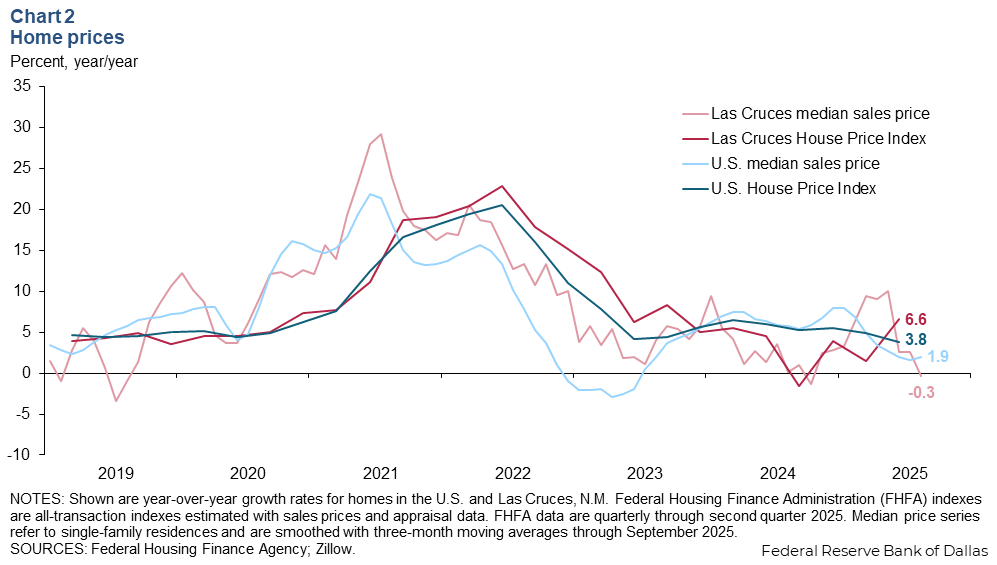
The FHFA price index is a repeat sales index that tracks the value of the same homes over time and gives a more accurate but less timely view of home price trends than sales price data. The index includes both sales and appraisals. In contrast, the median home sale price tracks homes sold in a given month. It is more timely but can be skewed based on the changing composition of homes selling at that time.
Apartment rent growth slows
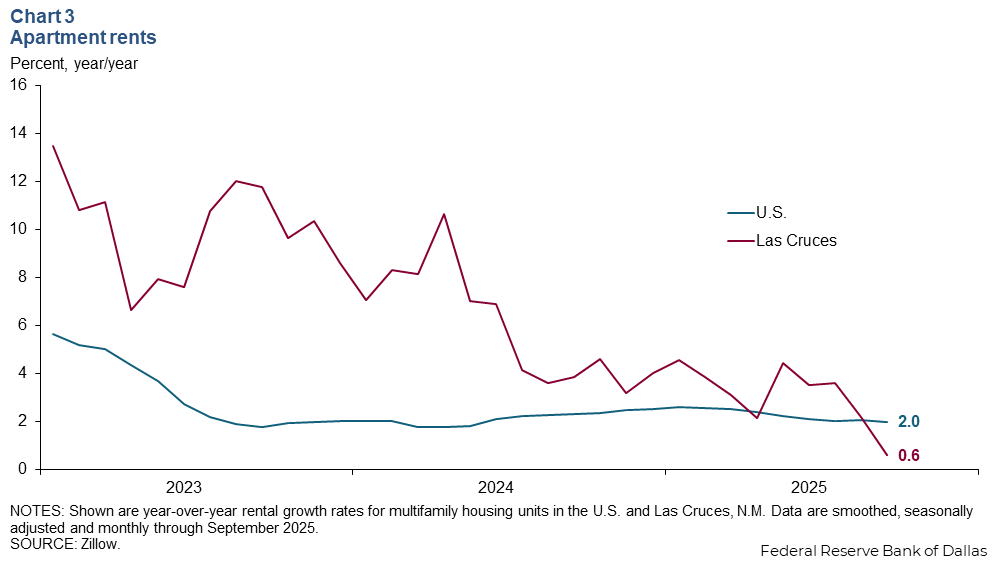
Nominal apartment rents for new leases measured by the Zillow Observed Rent Index grew 0.6 percent year over year in September (Chart 3). Rent growth in Las Cruces has slowed notably since 2023 despite limited new construction. Rents in the nation were up 2.0 percent year over year in September.
Single-family building permits decline
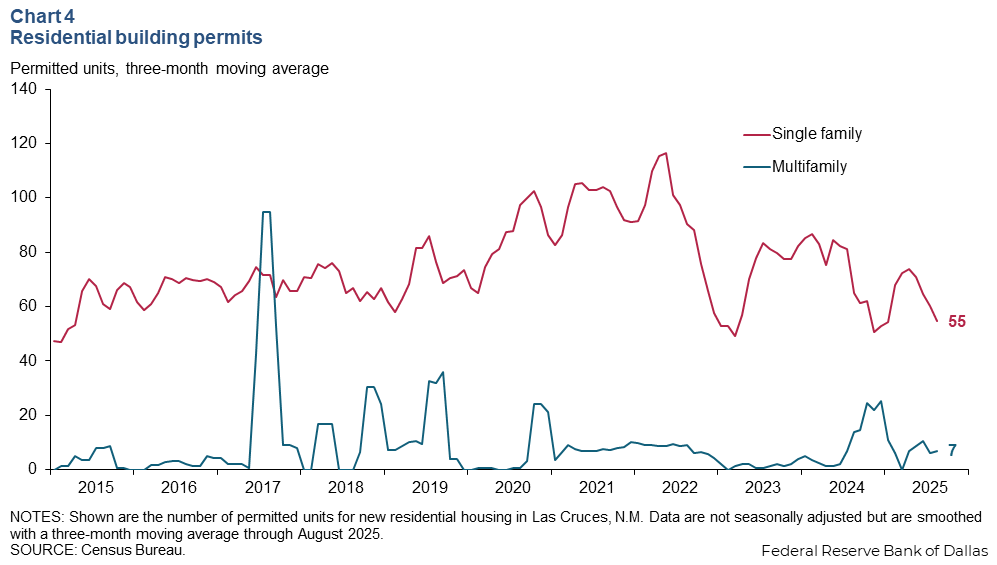
The three-month moving average of building permits for single-family homes in Las Cruces fell in August from June 2025 (Chart 4). Year over year, permits declined 15.9 percent in August. Single-family permits peaked this year at 74 units in April. Multifamily building activity remains quite muted with only seven new units permitted in August 2025.
Commodity markets
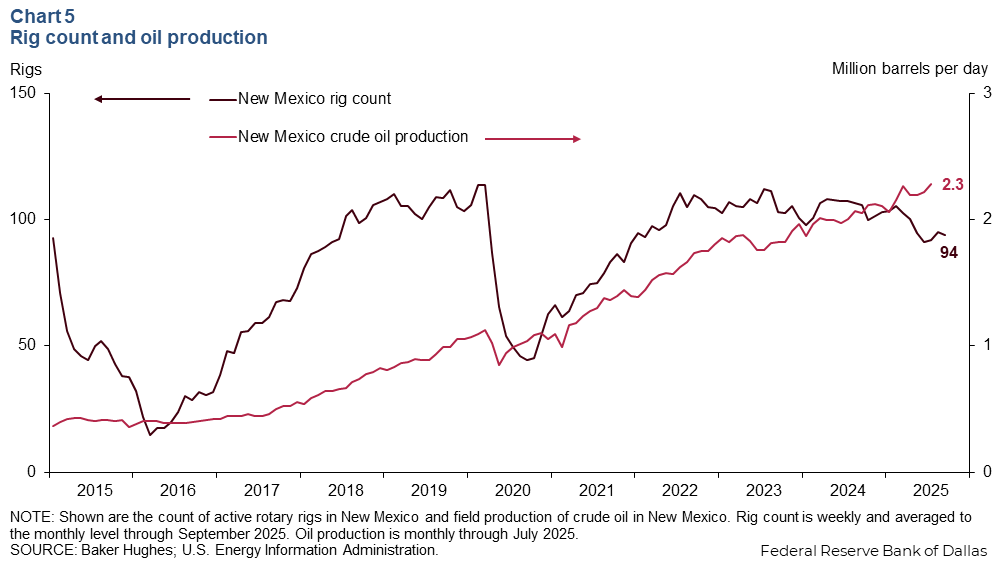
Crude oil production reaches new highs
New Mexico’s production of crude oil increased to 2.3 million barrels per day in July 2025 (Chart 5). Year over year, oil production in the state grew 13.8 percent. The number of active rotary rigs in New Mexico ticked up to 94 in September from 91 in June. The rig count has declined notably year to date in response to low oil prices.
Copper prices remain volatile
In addition to oil and natural gas, southern New Mexico also produces commodities such as potassium chloride and copper. The three-week moving average of copper spot prices increased to $4.96 per pound in the week ending October 17 from $4.60 the week ending September 26 (Chart 6).
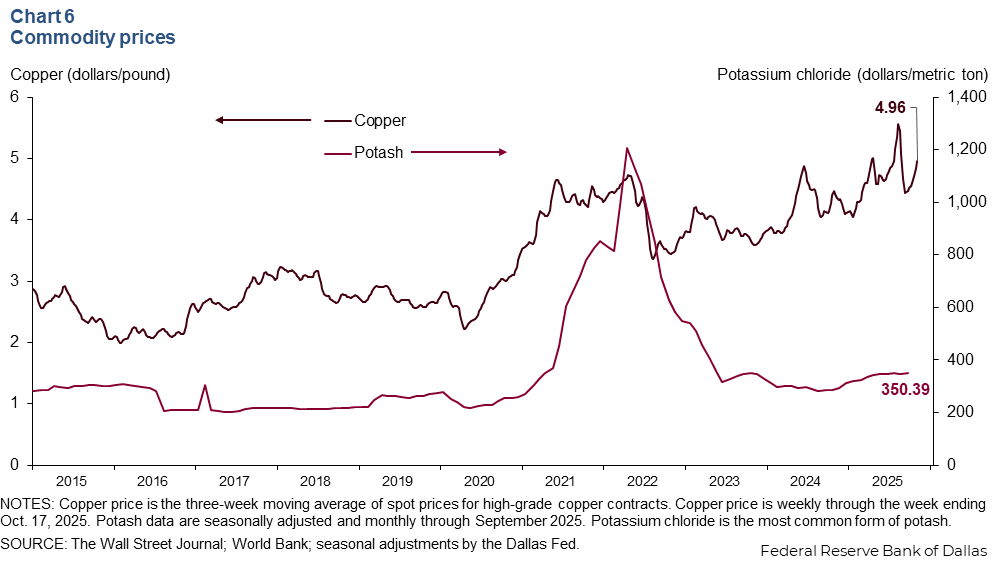
Due to trade uncertainty, copper prices surged to an all-time high of $5.56 per pound in July before dropping to $4.43 in late August. Prices have subsequently risen since then.
Potassium chloride is a form of potash and is commonly used in fertilizer. Potassium chloride prices ticked up to $350.39 per metric ton in September from $348.10 in June. Year over year, potassium chloride prices were up 23.1 percent in September.
NOTES: Data may not match previously published numbers due to revisions. All New Mexico counties within the Federal Reserve’s Eleventh District are counted as part of southern New Mexico.
About Southern New Mexico Economic Indicators
Questions or suggestions can be addressed to Robert Leigh at Robert.Leigh@dal.frb.org. Southern New Mexico Economic Indicators is released quarterly.