Texas Economic Indicators

Texas’ economic expansion accelerated in August after moderating in July. Employment growth strengthened and was widespread across major metros and industries. The Texas Leading Index dipped but remained elevated, and energy sector indicators were mostly flat. Exports rose in July, and the volume of loans held by Texas banks expanded in the second quarter.
Labor Market
Texas Employment Strengthens in August
Texas employment climbed 4.6 percent in August, following downwardly revised July growth of 1.0 percent. Year to date, the state has added jobs at a 3.0 percent annualized rate (Chart 1). The Dallas Fed’s Texas Employment Forecast predicts 2.8 percent job growth in 2018 (December/December), with an 80 percent confidence band of 2.3 to 3.3 percent. The Texas unemployment rate edged down to 3.9 percent in August, matching the U.S. rate and remaining well below its long-run (January 1990–December 2017) average of 5.8 percent.
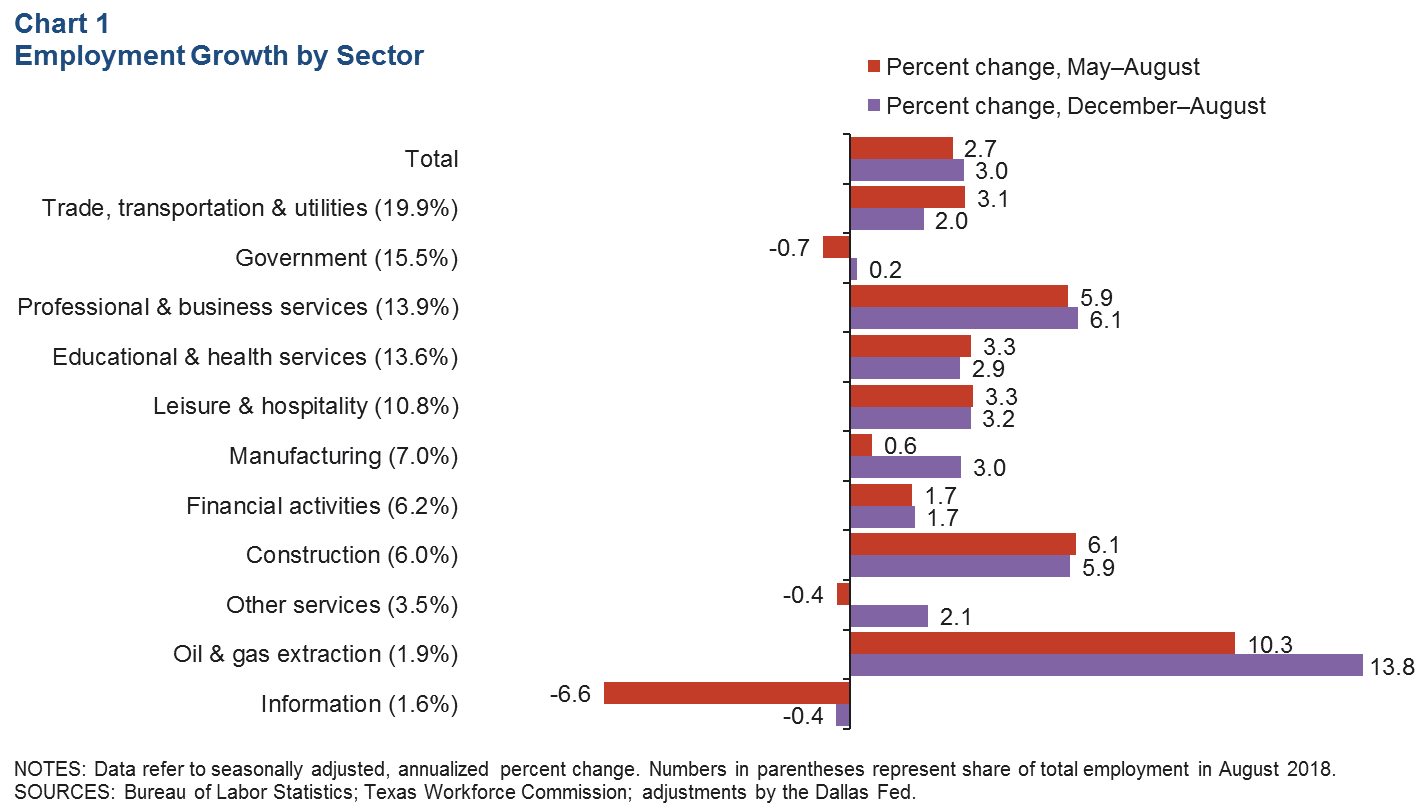
Payrolls in the oil and gas sector swelled 13.6 percent in August, and year to date, oil and gas employment has led growth among the state’s major sectors. The state’s six largest sectors each expanded by 3 percent or more in August, and the only sector to decline in the month—and so far this year—was information, indicative of widespread growth across sectors.
Job Gains Widespread Across Texas Metros
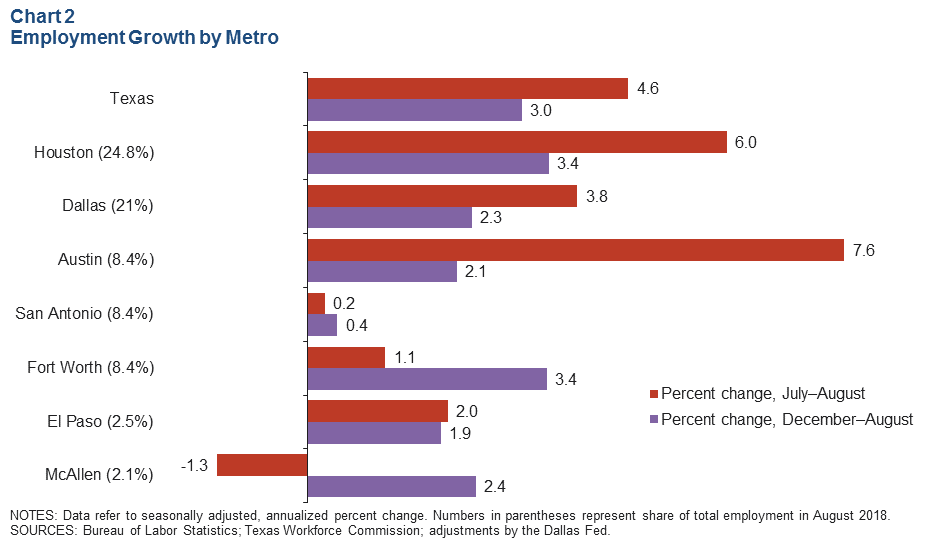
All the major metros have added jobs year to date, and all except McAllen added jobs in August (Chart 2). Austin payrolls advanced 7.6 percent in August, recovering from a steep 6.8 percent decline in July. Houston’s employment also rose significantly, expanding 6.0 percent in August following soft 0.6 percent growth in July.
Texas Leading Index
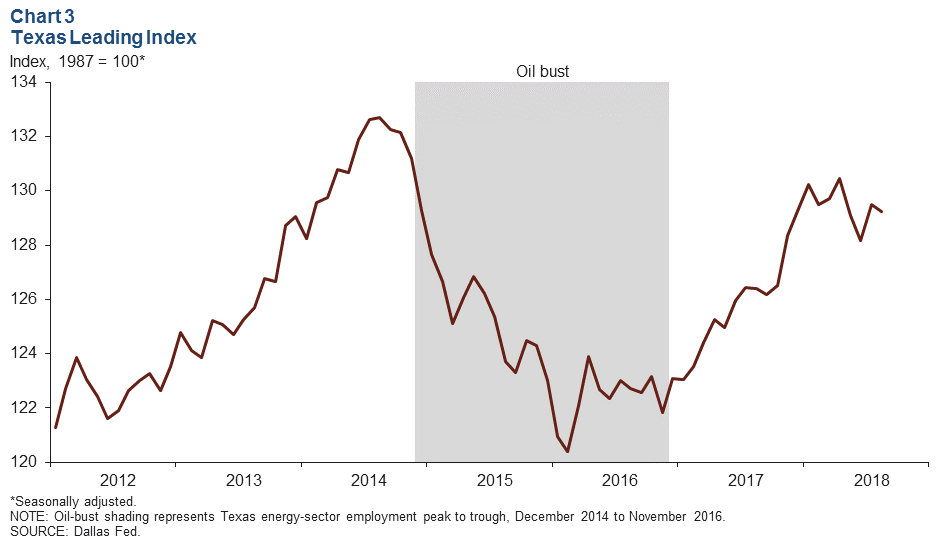
The Texas Leading Index, a composite of eight indicators that tend to change direction before the overall economy does, sheds light on the future of the state’s economy. In August, the estimated value of the index dipped 0.2 percent but was 7.4 percent above its low point during the oil bust (Chart 3). The Texas value of the dollar was the largest drag on the index in August, while the Texas stock index was the most significant positive contributor.
Energy Sector Activity
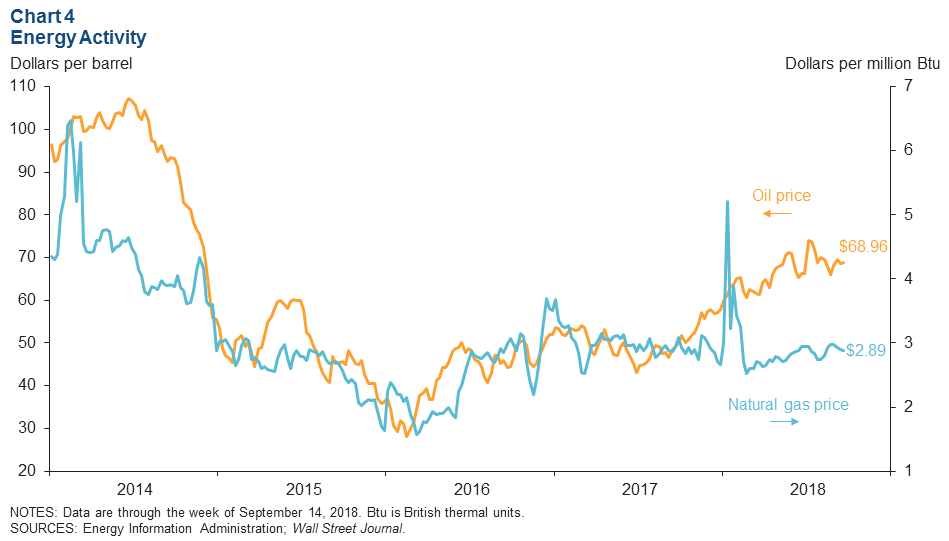
Oil prices rose by 45 cents the week of Sept. 14 to $68.96 per barrel and were 40.5 percent above year-ago levels (Chart 4). Natural gas prices were flat that week at $2.89 per million British thermal units and were 2.1 percent below year-ago levels. The Texas rig count slid by three rigs the week of Sept. 14 to 525 rigs. The rig count was up 16.2 percent year over year, with 73 more active rigs.
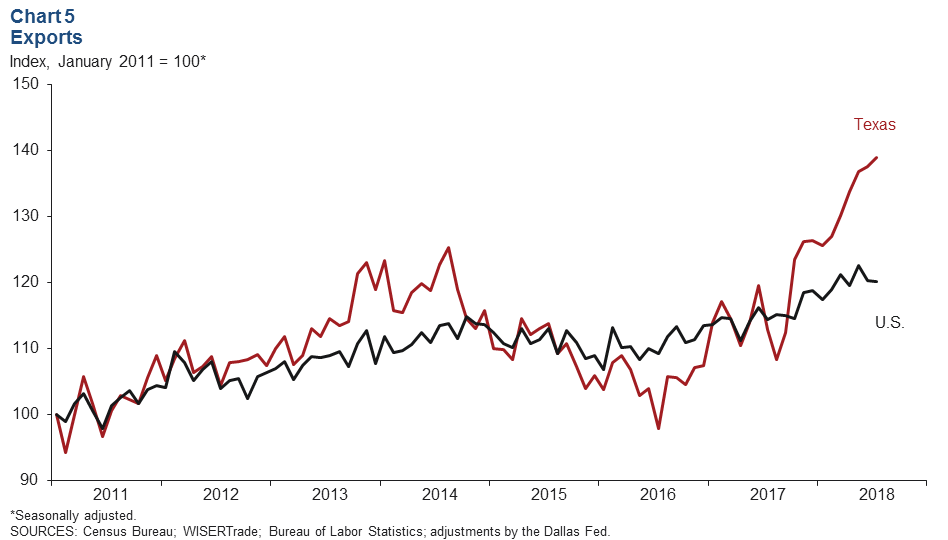
Exports
Texas exports rose 1.0 percent in July, while U.S. exports held steady (Chart 5). This year through July, exports have expanded 15.9 percent in Texas and 5.2 percent in the U.S. compared with the same period in 2017.
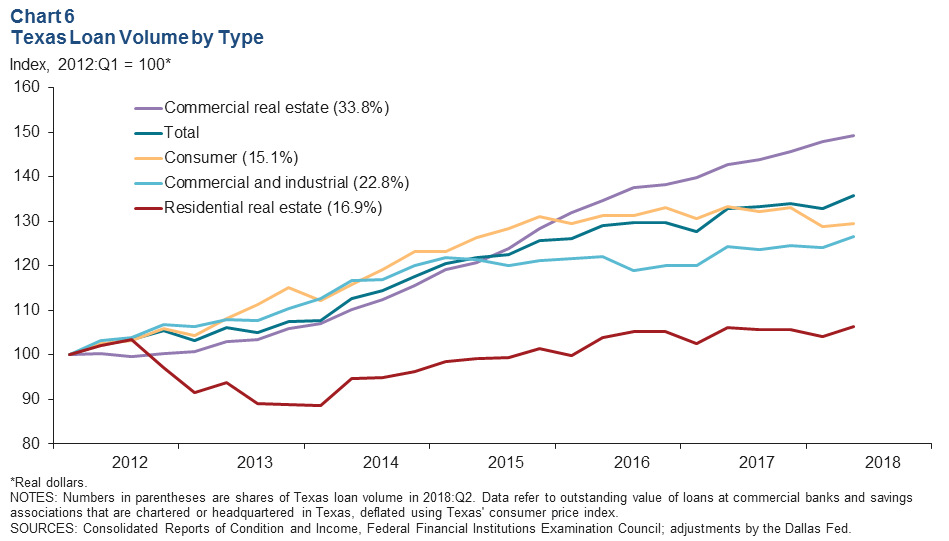
Banking
Banks headquartered in Texas held $313.1 billion dollars in total loans in second quarter 2018. Commercial real estate loans made up the largest share at 33.8 percent, followed by commercial and industrial loans at 22.8 percent, residential real estate loans at 16.9 percent and consumer loans at 15.1 percent. Year over year, statewide loan volume has grown 2.2 percent, bolstered by 4.6 growth in commercial real estate loans (Chart 6). Among loans held by banks headquartered in Texas, banks headquartered in Dallas–Fort Worth made up 40 percent of these loans, well above the share accounted for by banks in other major metros—a result of the metro’s concentration in the financial services sector.
NOTE: Data may not match previously published numbers due to revisions.
About Texas Economic Indicators
Questions can be addressed to Stephanie Gullo at stephanie.gullo@dal.frb.org. Texas Economic Indicators is published every month on the Monday after Texas employment data are released.