Texas Economic Indicators

Texas economic growth remained healthy in October. The state added jobs at a strong pace, with the expansion widespread across metros and most industries. Unemployment set a record low in the state and ticked down in most of its major metros. The Texas Business Outlook Surveys indicated that manufacturing output and service sector activity continued to expand in October, though at a slower pace than in September. Potential headwinds to the state economy include a historically tight labor market and a recent decline in oil prices.
Labor Market
Employment Growth Steps Up in October
Texas employment expanded 2.7 percent in October, following September's upwardly revised 2.4 percent growth. Year to date, the state has added jobs at a 2.9 percent annualized rate—above its long-run average of 2.0 percent (Chart 1). The Dallas Fed's Texas Employment Forecast predicts 2.9 percent job growth in 2018 (December/December), with an 80 percent confidence band of 2.5 to 3.3 percent.
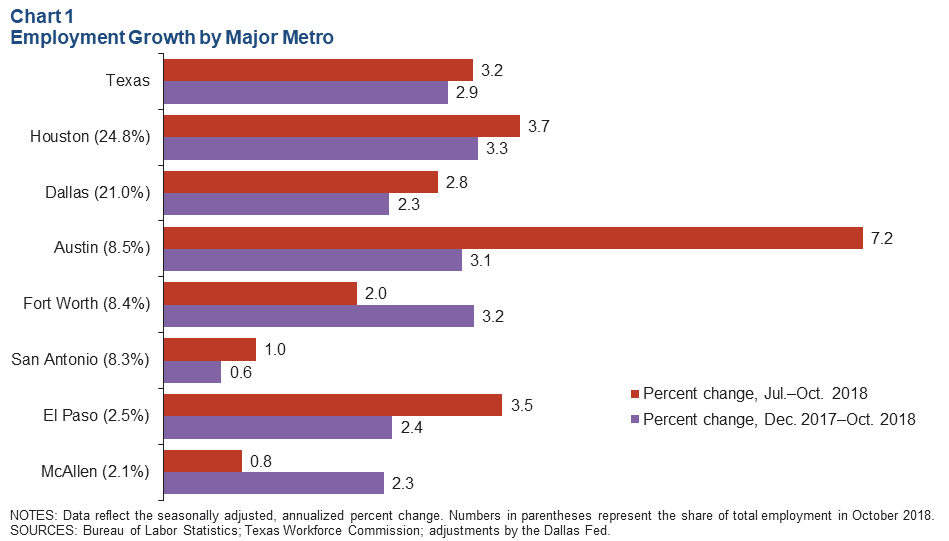
All the major metros added jobs in October and year to date. Houston payrolls advanced an annualized 3.3 percent this year through October—the fastest among the major metros. San Antonio payrolls inched up 0.6 percent—the slowest among the major metros.
The government and information sectors both shed jobs in October and year to date, while employment in the other major sectors increased. Payrolls in the oil and gas sector swelled 13.9 percent in October, outpacing growth in other major sectors. The oil and gas sector has also expanded the fastest so far this year.
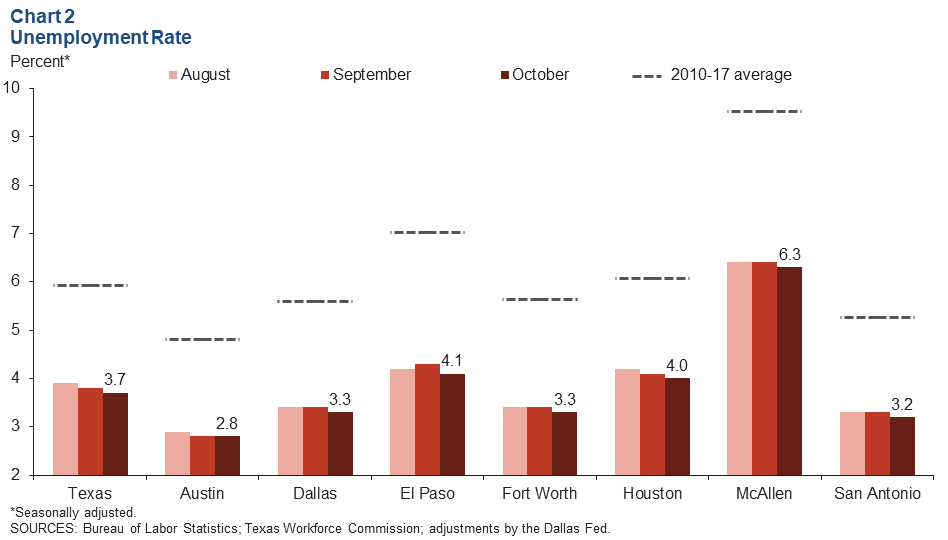
Unemployment Sets a Record Low
The Texas unemployment rate ticked down to 3.7 percent in October, once again setting a record low for the series, which dates back to 1976 (Chart 2). The U.S. unemployment rate held steady at 3.7 percent, its lowest point since December 1969. Unemployment was unchanged in Austin but dipped in every other major Texas metro. Jobless rates are significantly below postrecession averages in all major metros.
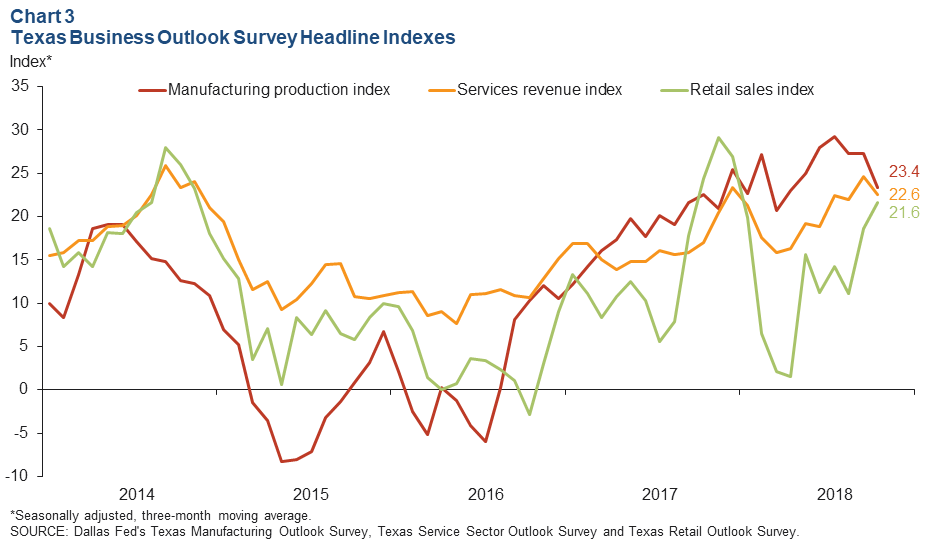
Texas Business Outlook Surveys
The three-month moving averages of the Texas Business Outlook Surveys' headline indexes indicated continued growth in October (Chart 3). The three-month moving average of the retail index rose as a higher share of retail firms noted growth in sales. The three-month moving averages of the manufacturing production and services revenue indexes remained positive but fell. All three headline indexes were above their postrecession averages.
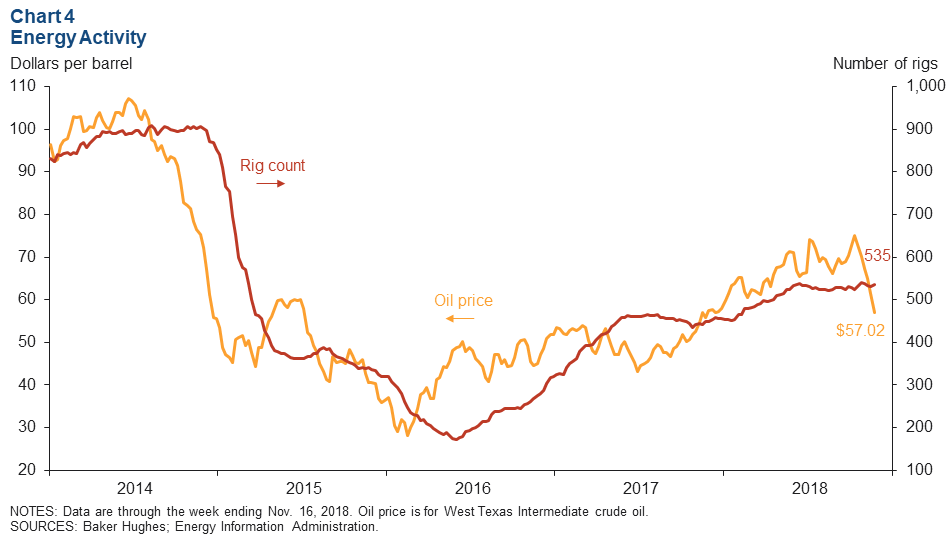
Energy Sector Activity
Oil prices have fallen from a nearly four-year high of $75.13 per barrel to $57.02 over the past six weeks, but they remain above the 2017 average of $50.83 (Chart 4). The Texas rig count has been relatively stable for about six months and inched up to 535 active rigs as of Nov. 16. The current rig count is 24 percent above its 2017 average of 431 rigs.
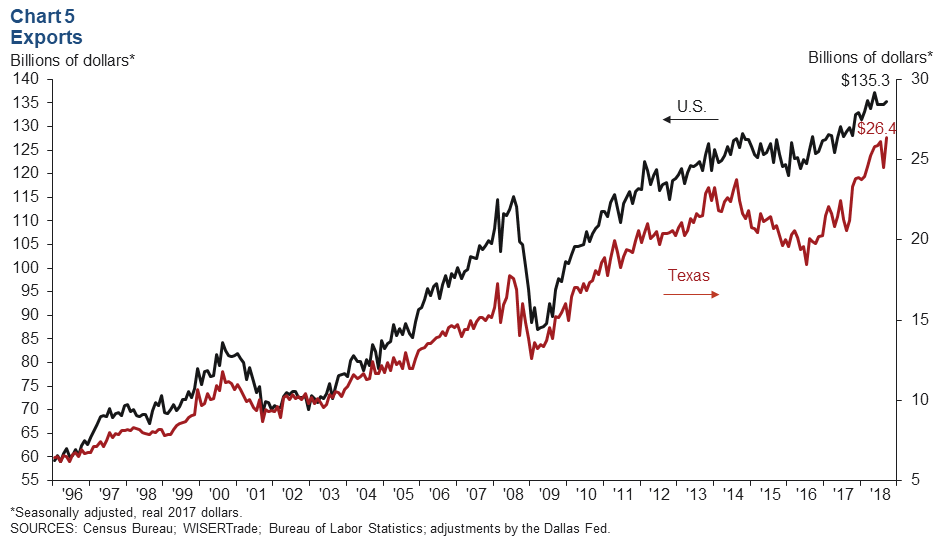
Exports
Texas exports rose 7.6 percent in September, while U.S. exports inched up 0.5 percent (Chart 5). Inflation-adjusted Texas exports totaled $26.4 billion in the month, the highest level in the history of the series, while the U.S. exported $135.3 billion of goods, just below its peak level reached in May of this year. This year through September, exports have expanded 17.2 percent in Texas and 5.0 percent in the U.S. compared with the same period in 2017.
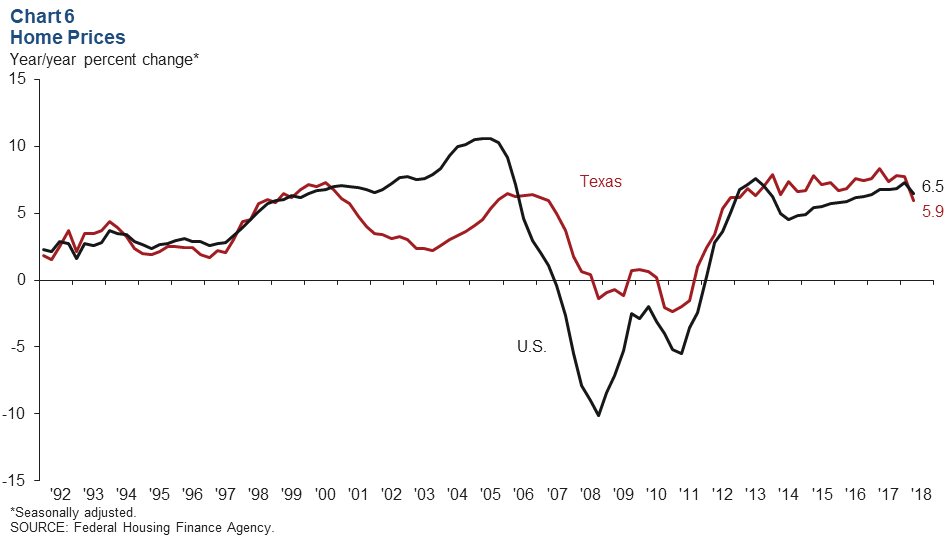
Housing
Texas and U.S. home price appreciation slowed in the second quarter (the latest estimate available), according to the Federal Housing Finance Agency purchase-only House Price Index (Chart 6). The Texas index was up 5.9 percent year over year in the second quarter, and the U.S. index was up 6.5 percent; both rates of increase were slower than in the previous quarter. The Fort Worth index rose 8.6 percent over the same period, the fastest among the major Texas metros, followed by Dallas, Houston and Austin.
NOTE: Data may not match previously published numbers due to revisions.
About Texas Economic Indicators
Questions can be addressed to Stephanie Gullo at stephanie.gullo@dal.frb.org. Texas Economic Indicators is published every month on the Monday after Texas employment data are released.