Texas Economic Indicators

Texas economic growth moderated in November. The state added jobs at a softer pace, with employment declining in some metros and industries. Unemployment held steady in the state and nation at historically low levels, indicating that labor markets remain tight. The Texas Manufacturing Outlook Survey indicated that manufacturing output continued to expand in November, though at a notably slower pace than in October. Third-quarter exports and loan volumes and November home sales posted modest growth.
Labor Market
Employment Growth Downshifts
Texas employment expanded 1.4 percent in November following October’s upwardly revised 3.1 percent growth, pulling the three-month annualized rate through November down to 2.3 percent (Chart 1). Year to date, the state has added jobs at a 2.4 percent annualized rate—above its long-run average of 2.0 percent but below previous estimates. The Dallas Fed’s Texas Employment Forecast predicts 2.4 percent job growth in 2018 (December/December), with an 80 percent confidence band of 2.2 to 2.6 percent. The forecast shifted down in December due to downward revisions to second-quarter job growth, a decline in the Texas Leading Index, and November’s slower job growth.
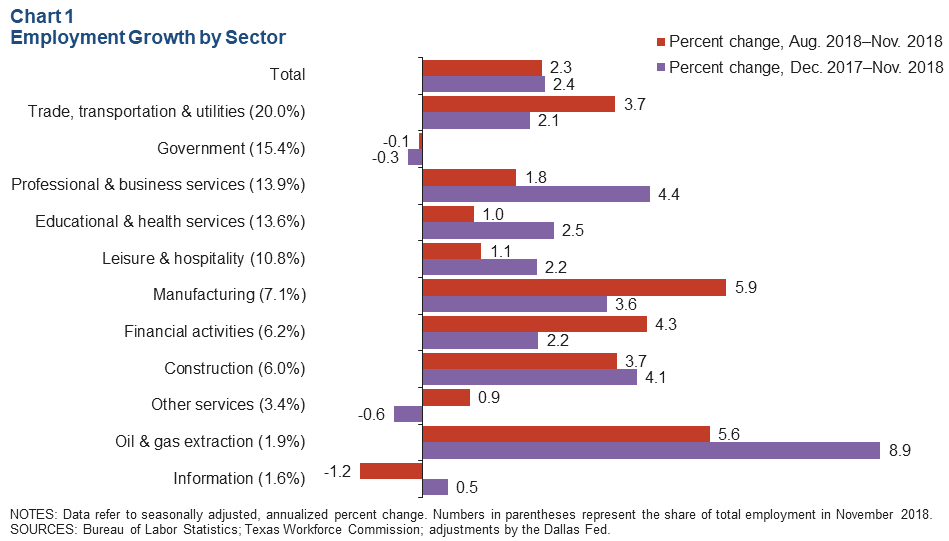
The November softening in job growth reflects a 6.4 percent drop in leisure and hospitality employment and a 3.4 percent decline in financial activities. Other sectors that declined less sharply in the month were education and health services, other services and information. However, only the government and other services sectors have shed jobs year to date. The manufacturing sector added jobs at the fastest rate in November, while the oil and gas extraction sector has expanded the most rapidly year to date.
El Paso employment declined 4.1 percent in November, and Austin employment dipped 0.3 percent. All other major metros saw employment increases, led by San Antonio’s 7.3 percent growth. Year to date, all major metros have expanded payrolls, led by 3.1 percent growth in Austin.
Unemployment Holds Steady at Record Low
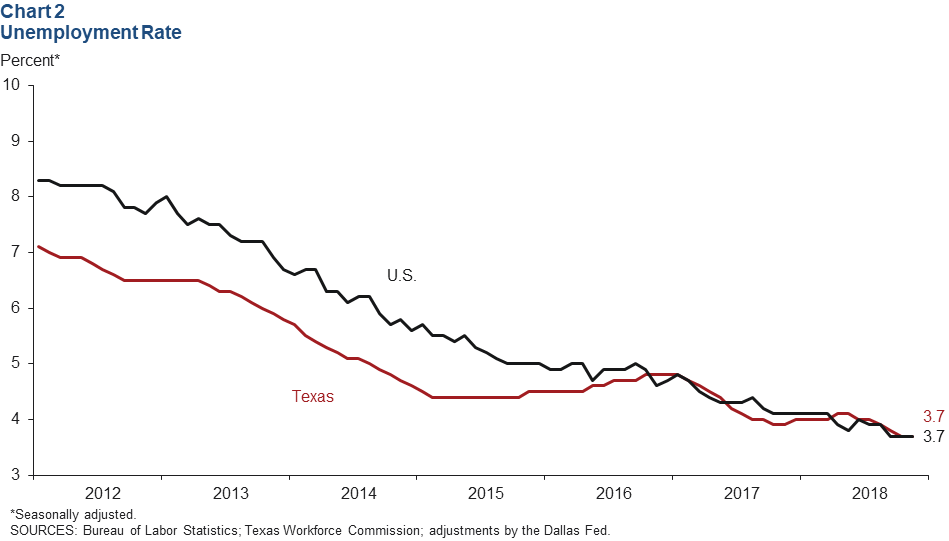
Unemployment rates held steady at 3.7 percent in November in both Texas and the U.S., indicating continued labor market tightness (Chart 2). Rates were unchanged in all the major metros except Fort Worth, where the rate ticked up. Jobless rates are significantly below postrecession averages in all major metros.
Texas Business Outlook Surveys
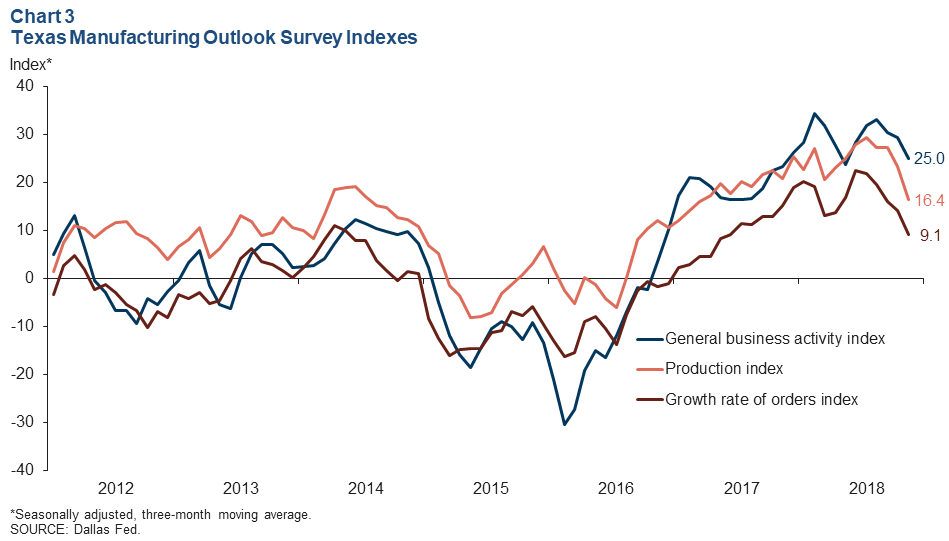
Key indicators of manufacturing activity point to markedly slower growth in November, according to the Dallas Fed’s Texas Manufacturing Outlook Survey (Chart 3). The three-month moving averages of the manufacturing production index, general business activity index and growth rate of orders index all declined in November, though they remained above their postrecession averages.
The three-month moving average of the Texas Service Sector Outlook Survey’s headline index suggests that November growth was similar to that in October, while the Texas Retail Outlook Survey’s headline index indicates that growth moderated in November. The three-month moving averages of both headline indexes were above their postrecession averages.
Exports
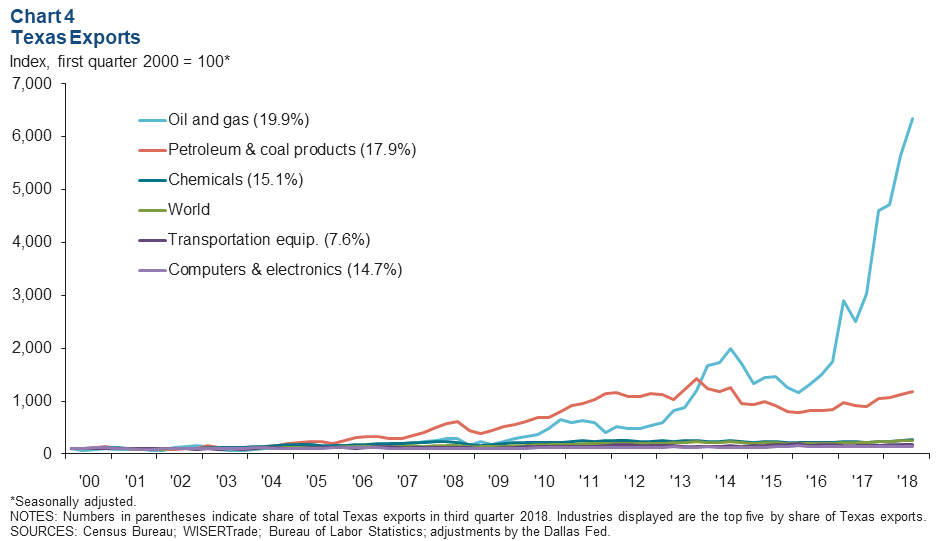
Texas exports expanded 1.2 percent in the third quarter, but changes in export volume were mixed across regions and industries. Oil and gas exports and petroleum and coal products exports—which accounted for the largest and second-largest shares of total Texas exports in the quarter—strengthened 12.4 percent and 5.3 percent, respectively (Chart 4). However, computers and electronics, transportation equipment, plastics and rubber, primary metals, agriculture, paper and apparel all declined.
Exports to China—the destination of 5.4 percent of Texas exports—slumped 19.6 percent in the third quarter. Exports to Mexico—the destination of 33.7 percent of Texas exports—also declined but only by 1.8 percent. Texas exports to other major regions increased in the quarter.
Texas exports grew 0.9 percent in October, and U.S. exports inched up 0.4 percent. This year through October, exports have expanded 16.9 percent in Texas and 5.0 percent in the U.S. compared with the same period in 2017.
Banking
Loans held by banks headquartered in Texas edged up 0.4 percent to $315.4 billion in the third quarter compared with the previous quarter (Chart 5). Commercial real estate loans, which account for the largest share of these loans, rose 1.6 percent. Commercial and industrial loans and consumer loans expanded as well, while residential real estate loans edged down 0.9 percent. Year over year, statewide loan volume has grown 2.5 percent, bolstered by 5.6 percent growth in commercial real estate loans.
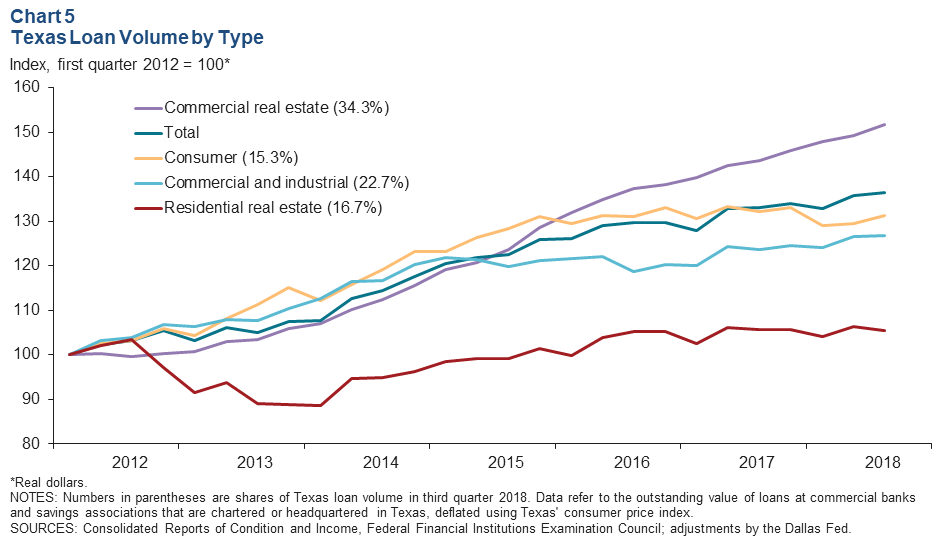
Loans at banks headquartered in Dallas–Fort Worth dipped 0.5 percent in the quarter but were up 2.9 percent year over year. Banks headquartered in DFW made up 39.7 percent of loans at banks with headquarters in the state.
Housing
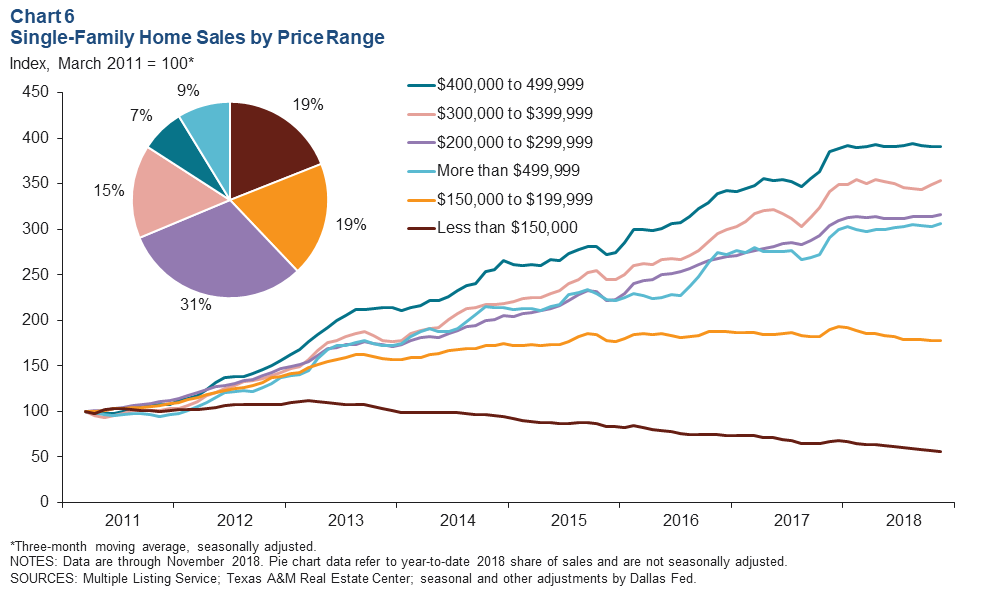
Texas single-family home sales rose 1.2 percent in November. Sales have increased 1.8 percent this year through November compared with the same period in 2017. Growth in statewide home sales was damped during the month by a 3.1 percent decline in sales of homes priced under $150,000. Home sales in higher price ranges edged up, led by 4.1 percent growth in sales of homes for $500,000 or more (Chart 6). This year through November, homes sold for under $150,000 have declined 12.8 percent and homes sold for $150,000 to $199,999 have declined 2.6 percent from the same period last year, while sales of higher-priced homes ($200,000 or more) have risen 9.2 percent. Home inventories across most price ranges are below the six months of supply considered balanced, and they are lowest for the lower-priced homes.
NOTE: Data may not match previously published numbers due to revisions.
About Texas Economic Indicators
Questions can be addressed to Stephanie Gullo at stephanie.gullo@dal.frb.org. Texas Economic Indicators is published every month on the Monday after Texas employment data are released.