Texas Economic Indicators

March 17, 2020
Note: Most of the data included in this release precede the coronavirus outbreak in the U.S.
The Texas economy continued to expand in January, as evidenced by robust job growth. The unemployment rate held steady at a near-record low. Oil prices have weakened amid a growing number of coronavirus cases. Exports remain strong in January, bolstered by exports to Asia excluding China. Home sales started 2020 on a strong note as single-family permits in Texas remained near their late-2019 peak. Retail sales grew in January.
Labor Market
Metro Job Growth Solid in January
Texas employment grew an annualized 3.5 percent in January, following a downwardly revised 2.5 percent in December (Chart 1). Job growth in the state in 2019 was 2.2 percent, roughly in line with its long-run average pace of 2.1 percent. Most major metros expanded in January. El Paso saw the strongest growth (3.1 percent, annualized), though Fort Worth and San Antonio weren’t far behind (2.7 and 2.5 percent, respectively). Only Austin shed jobs in January. U.S. payrolls also expanded during the month, growing 2.2 percent.
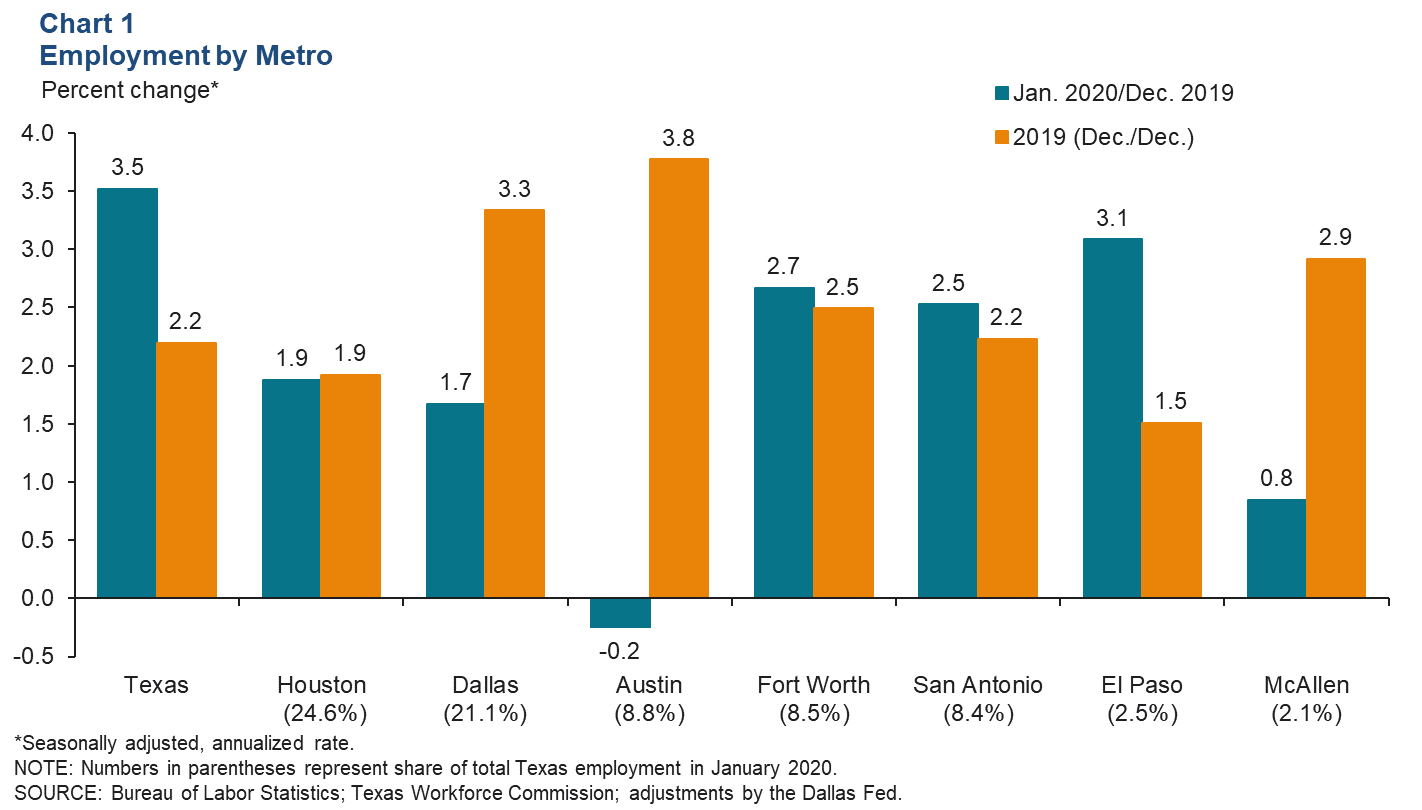
Texas unemployment held steady at 3.5 percent in January. U.S. unemployment inched up 0.1 percentage points in January and was back down in February to 3.5 percent.
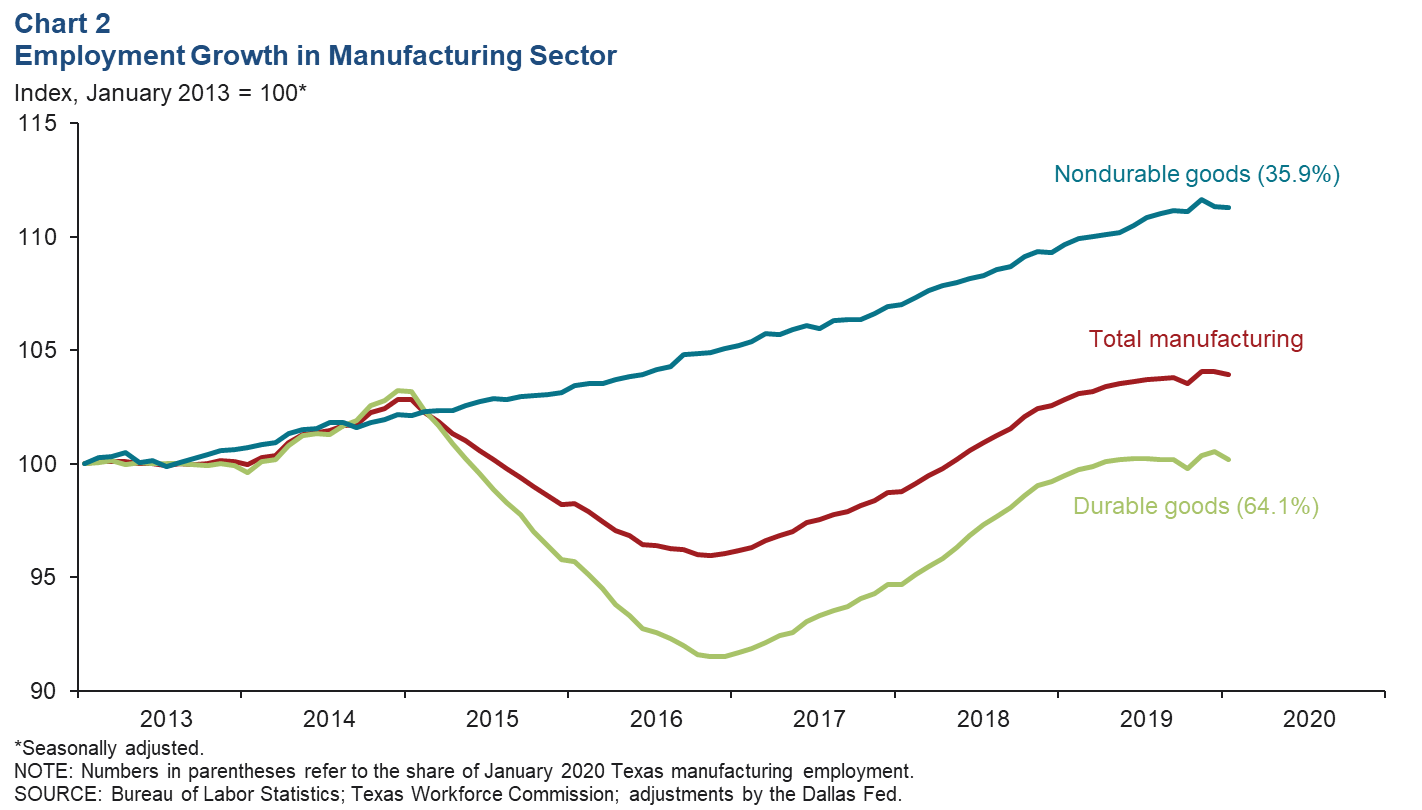
Manufacturing Employment Ticks Down
Manufacturing employment in Texas fell by 1.6 percent in January (Chart 2). This marks the second month in a row that the manufacturing sector has shed jobs. Employment in both durable goods and nondurable goods manufacturing declined, by 3.9 percent and 0.4 percent, respectively. Within the durable goods sector, employment fell in all manufacturing industries except for wood products and furniture. Of the nondurable goods, most sectors saw employment growth in January. The two exceptions were food and chemicals, which make up more than half the employment in nondurables. Beverages and tobacco manufacturing employment had the strongest growth, jumping an annualized 10.2 percent.
Energy
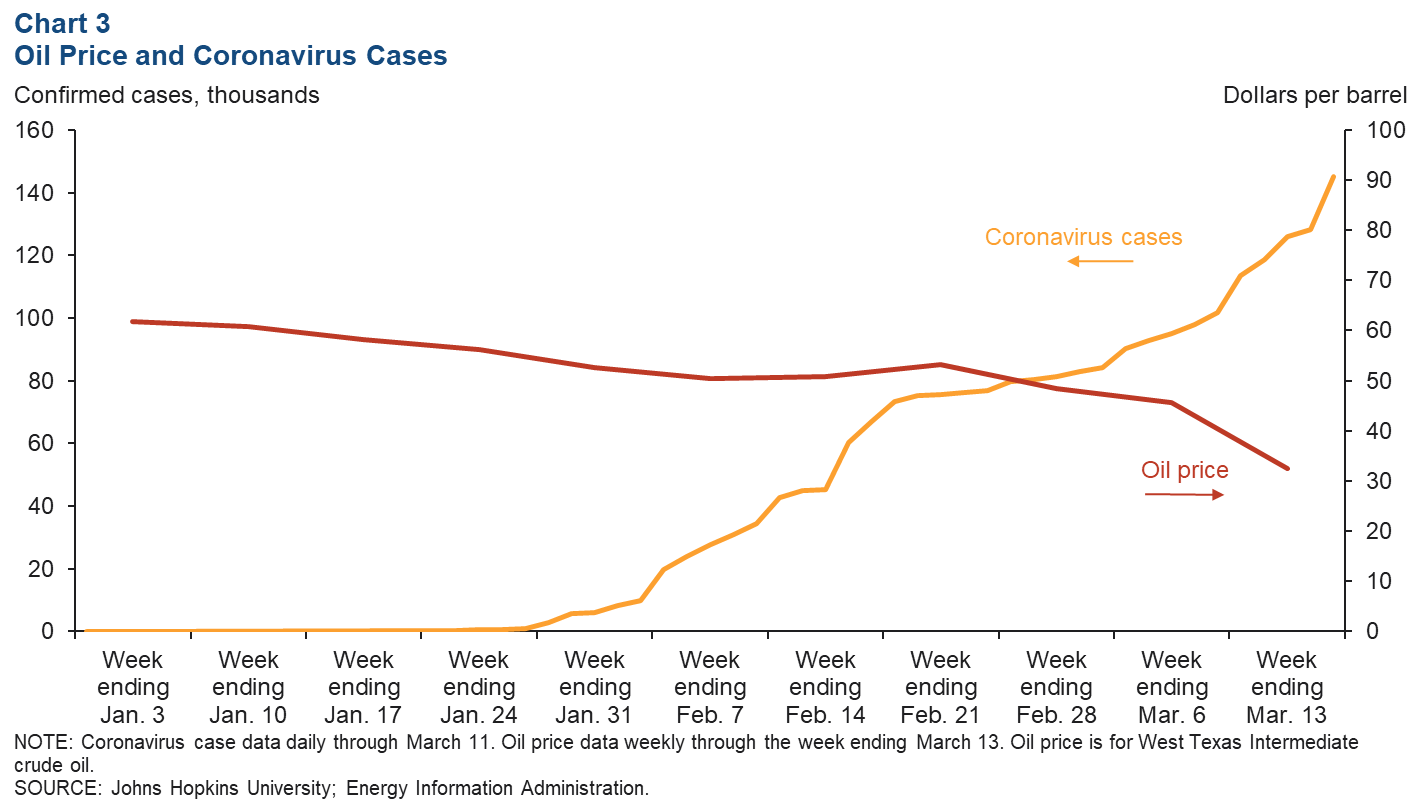
As the outbreak of the coronavirus has become more widespread, the demand for fuel has dropped, driving oil prices down (Chart 3). Between the end of January and March 11, coronavirus cases grew more than 10 times. During this time, economic activity in China was severely limited as a measure to control the spread of the virus; disagreements between oil-producing countries on how to respond to declining demand due to the pandemic led to a cut in official selling prices. This all contributed to a 38.5 percent drop in West Texas Intermediate oil prices from Jan. 31 to March 13. Currently, oil prices are below the Dallas Fed Energy Survey’s breakeven range. This range indicates the oil price at which it is generally profitable for an exploration and production firm to drill a new well; therefore, it is unlikely that production will grow in the near future.
Exports
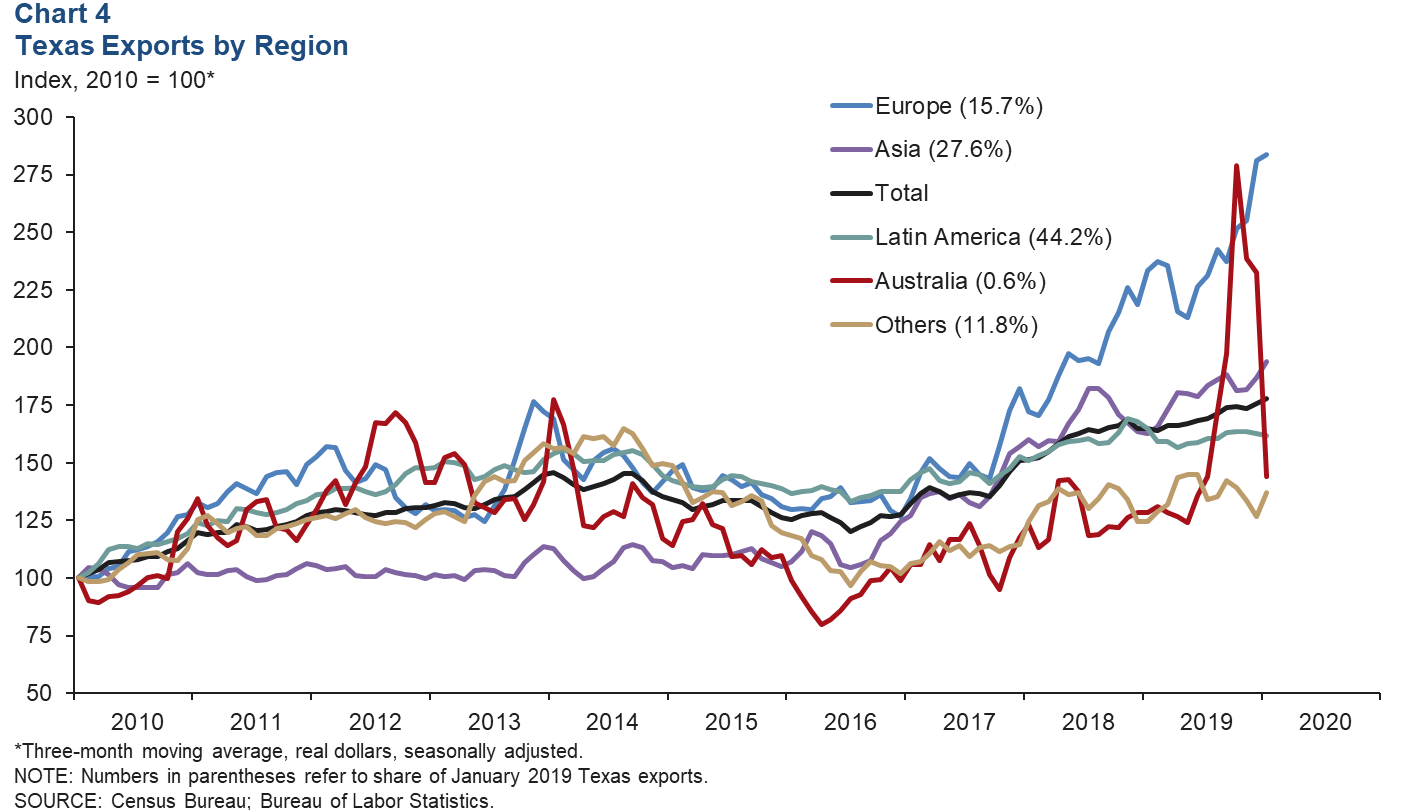
The three-month average of Texas exports ticked up in January to $28.9 billion, 8.0 percent higher than year-ago levels (Chart 4). In January, the three-month moving average of exports to Asia grew 3.5 percent. This increase comes entirely from Asia excluding China—exports to China slipped 15.9 percent compared with January 2019, while exports to the rest of Asia surged 27.9 percent. Exports to Australia more than doubled in late 2019 as wildfires across the region caused a greater need for goods to be imported, though they have since dropped back to normal levels.
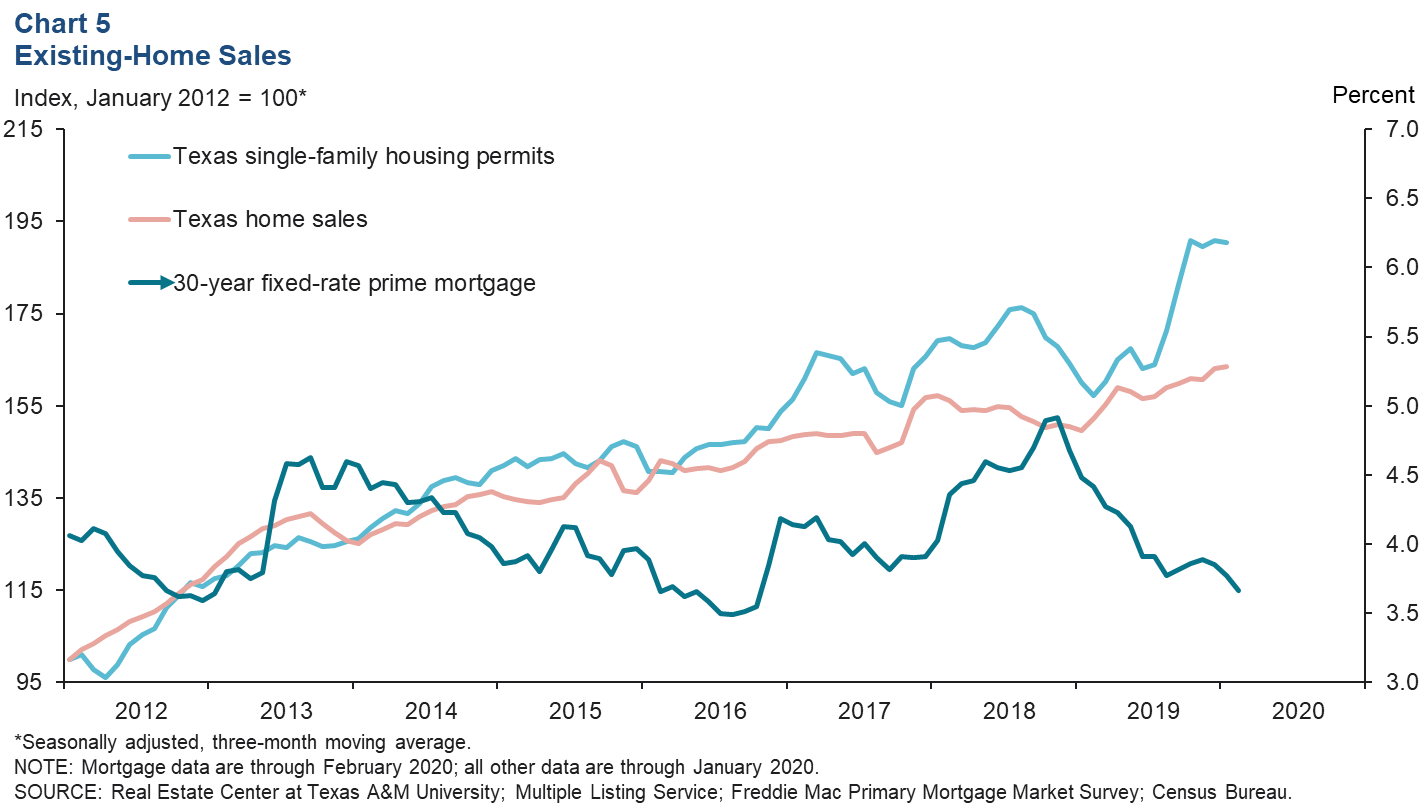
Home Sales
Texas home sales ended 2019 on a strong note, with almost 31,000 homes sold in December. Sales held mostly steady the first month of 2020 (Chart 5). This robust real estate activity can be partially attributed to low mortgage interest rates, which have fallen further by 0.2 percentage points so far in 2020 to their lowest level since October 2016. Single-family housing permits surged an annualized 49.7 percent in the second half of 2019 and held steady in January this year.
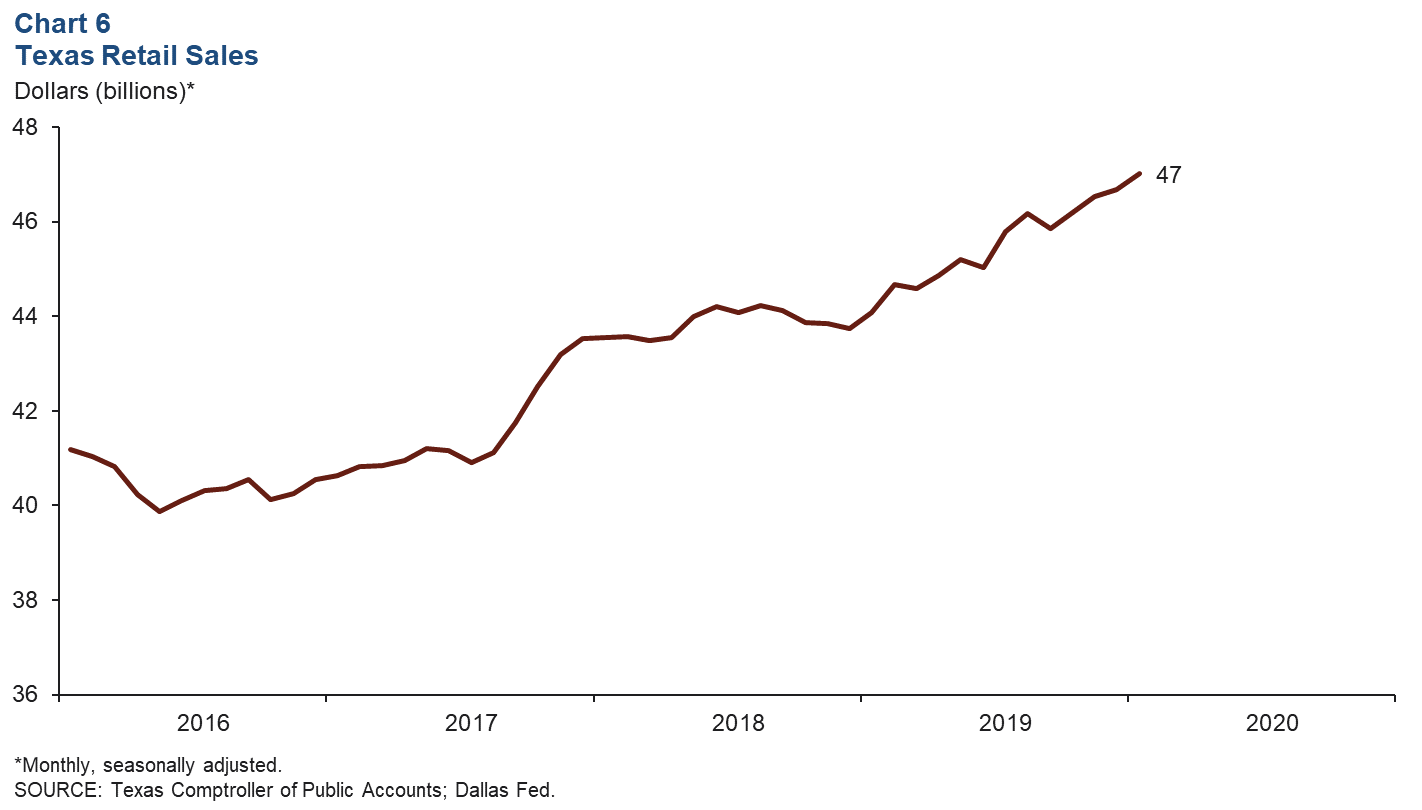
Retail Sales
The Texas economy has long benefited from strong consumer activity. Retail sales in January grew to nearly $47 billion (Chart 6). In 2019, sales showed solid gains, ending the year with 6.7 percent growth. Retail sales in 2019 increased from November to December, though they fell over the same period in 2018. The 2019 increase could be due to a particularly late Thanksgiving, which concentrated the holiday shopping season almost entirely in December.
NOTE: Data may not match previously published numbers due to revisions.
About Texas Economic Indicators
Questions can be addressed to Carlee Crocker at carlee.crocker@dal.frb.org. Texas Economic Indicators is published every month on the Monday after Texas employment data are released.