Texas Economic Indicators

May 27, 2020
The Texas economy contracted broadly in April, with payrolls plunging and unemployment spiking as a result of the COVID-19 pandemic and subsequent containment measures. The Texas Leading Index slipped in April for the third month in a row. Texas Business Outlook Survey indexes point to contraction in manufacturing and services. Construction contract values plunged in April. After peaking in mid-April, the Dallas Fed Social Distancing Index tracking cellphone movement has trended down in Texas, while the number of hourly employees working has increased and the growth in new COVID-19 cases has slowed.
Labor Market
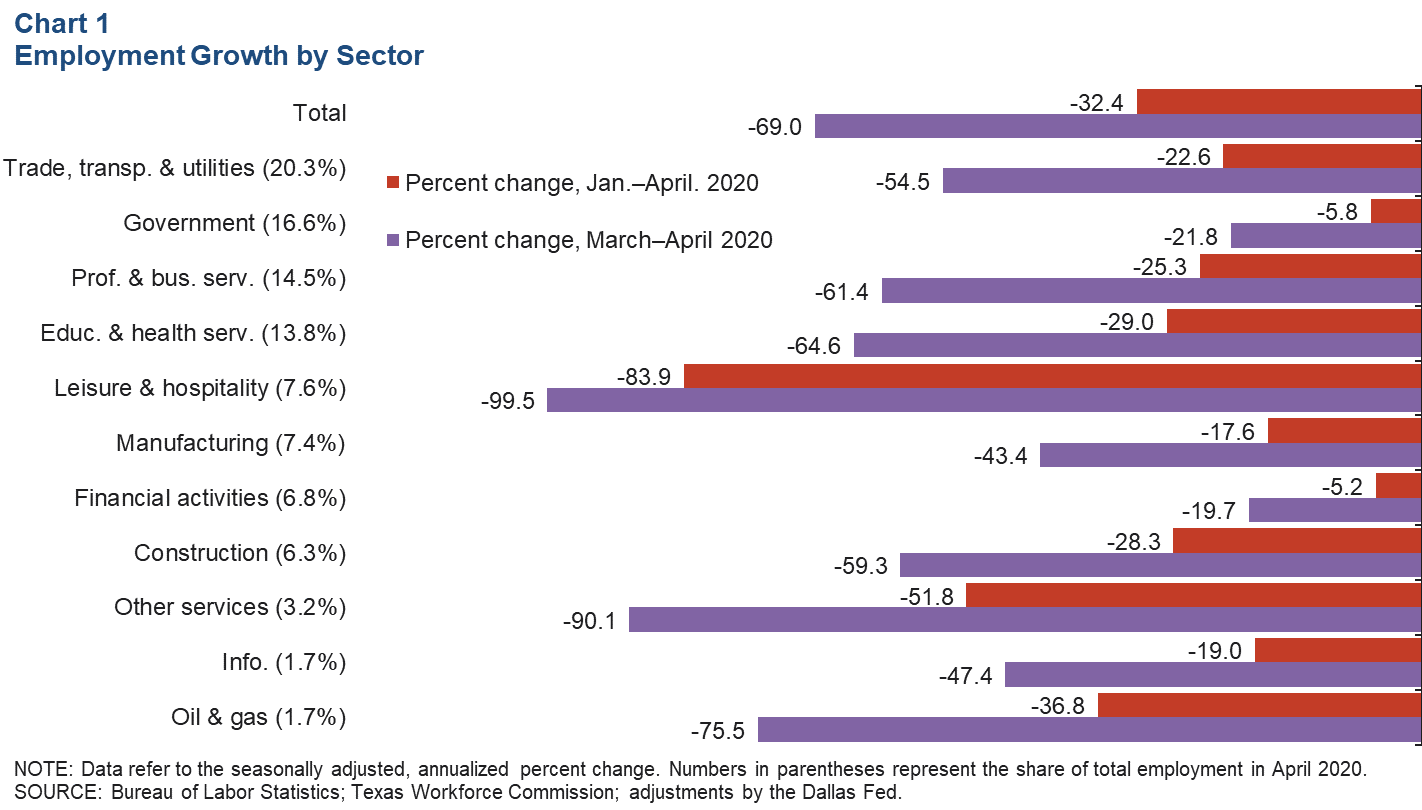
Texas Jobs Plummet in April
Texas employment fell an annualized 69.0 percent in April following a revised decline of 4.0 percent in March (Chart 1). Employment in all large sectors worsened, most notably in leisure and hospitality (by 99.5 percent), other services (90.1 percent) and oil and gas (75.5 percent). Financial activities and government saw more moderate declines than other sectors, falling 19.7 and 21.8 percent, respectively.
U.S. payrolls also contracted in April, shrinking an annualized 82.6 percent after declining a revised 6.7 percent in March.
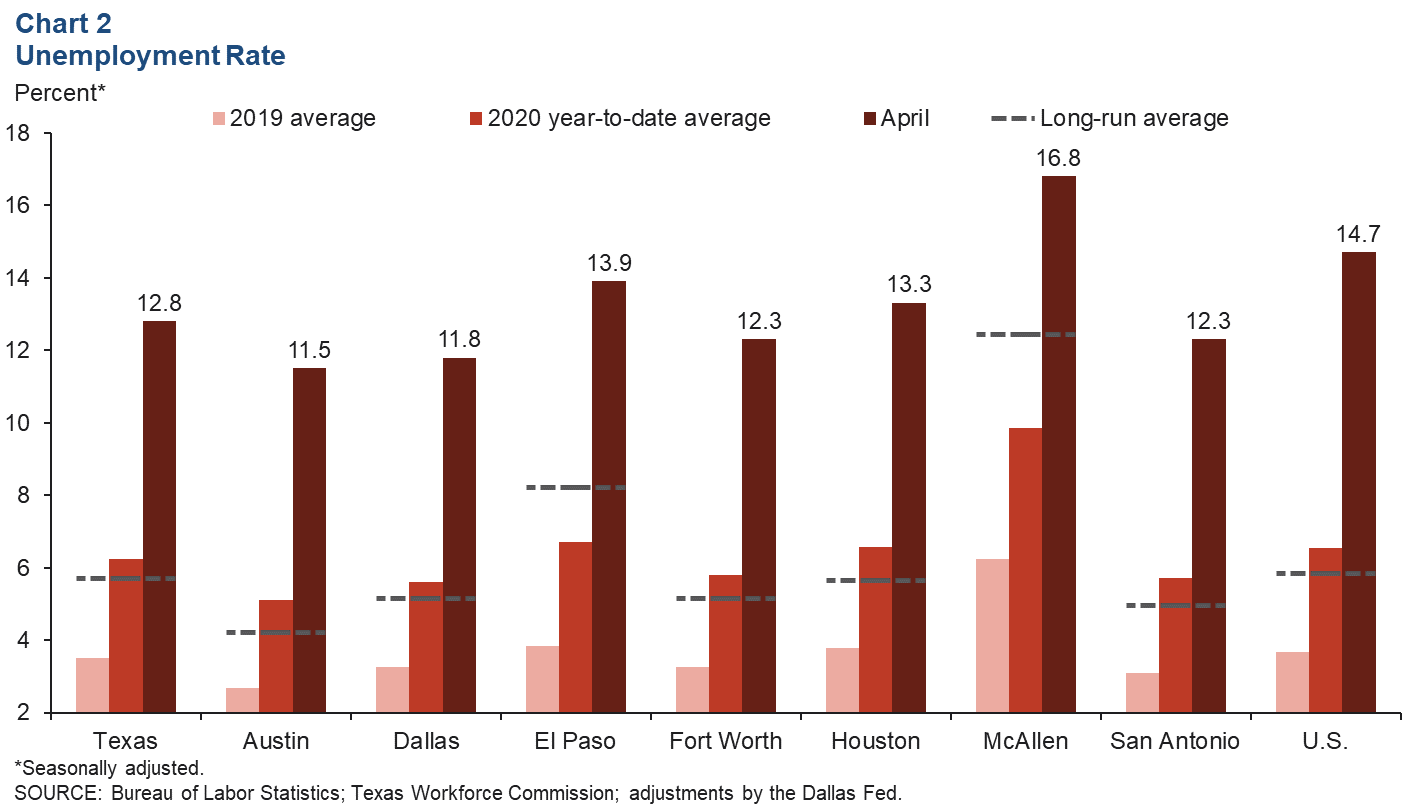
April Unemployment Spikes
The Texas unemployment rate jumped to 12.8 percent in April after increasing moderately in March (Chart 2). The current reading is higher than the state unemployment rate seen during the Great Recession but lower than the April U.S. rate of 14.7 percent. The jobless rate shot up in all major Texas metros to well above their respective long-run averages. In all major metros except El Paso and McAllen, the April unemployment rates raised average 2020 unemployment rates above their long-run averages.
Based on unemployment insurance claims data, the Texas unemployment rate is expected to rise further in May.
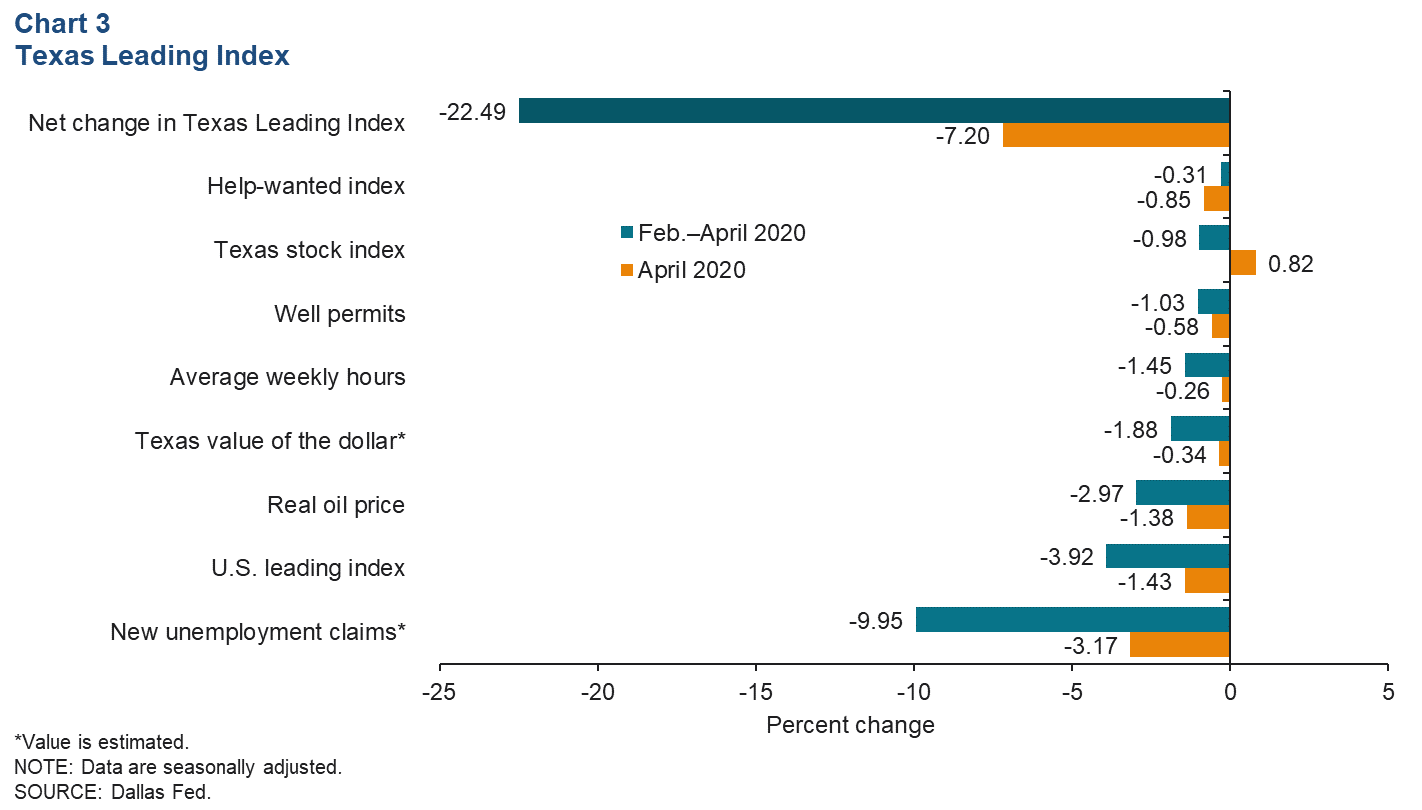
Texas Leading Index
The Texas Leading Index, which is used to estimate the Dallas Fed’s Texas Employment Forecast, sheds light on the future of the state’s economy. In April, the index fell 7.2 percent, though the decrease was muted compared with the three-month decline of 22.5 percent (Chart 3). In April, new unemployment claims, the U.S. leading index and real oil prices were the biggest drags on the index. Only the Texas stock index contributed positively last month.
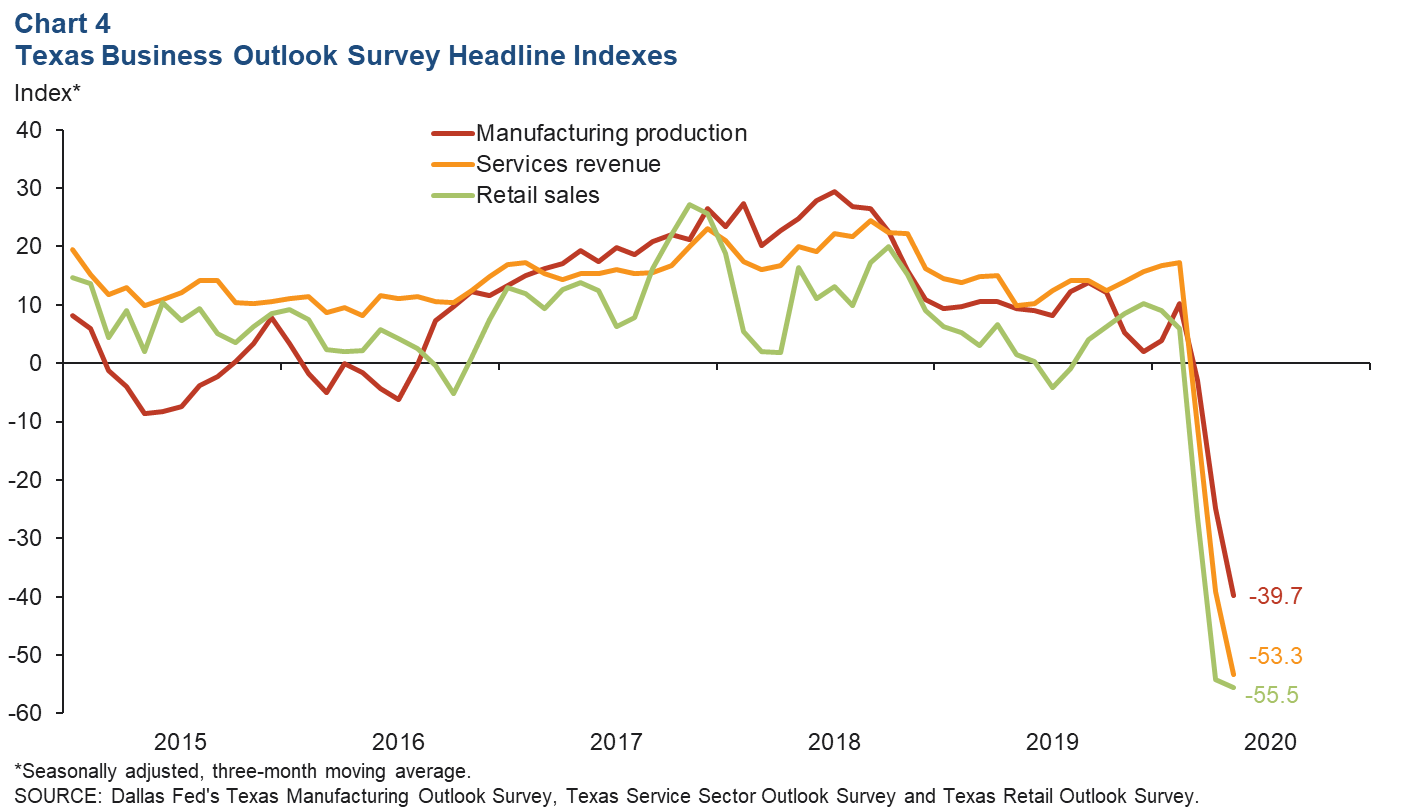
Texas Business Outlook Surveys
The Texas Business Outlook Survey’s headline indexes remained deeply negative in May after plummeting to record lows in March and April, dragging down the three-month moving averages (Chart 4). The monthly indexes ticked up in May, but the negative reading indicates continued contraction in the manufacturing, services and retail sectors. The three-month average future headline indexes were also negative, suggesting that Texas firms expect continued weakness in the near term.
Construction
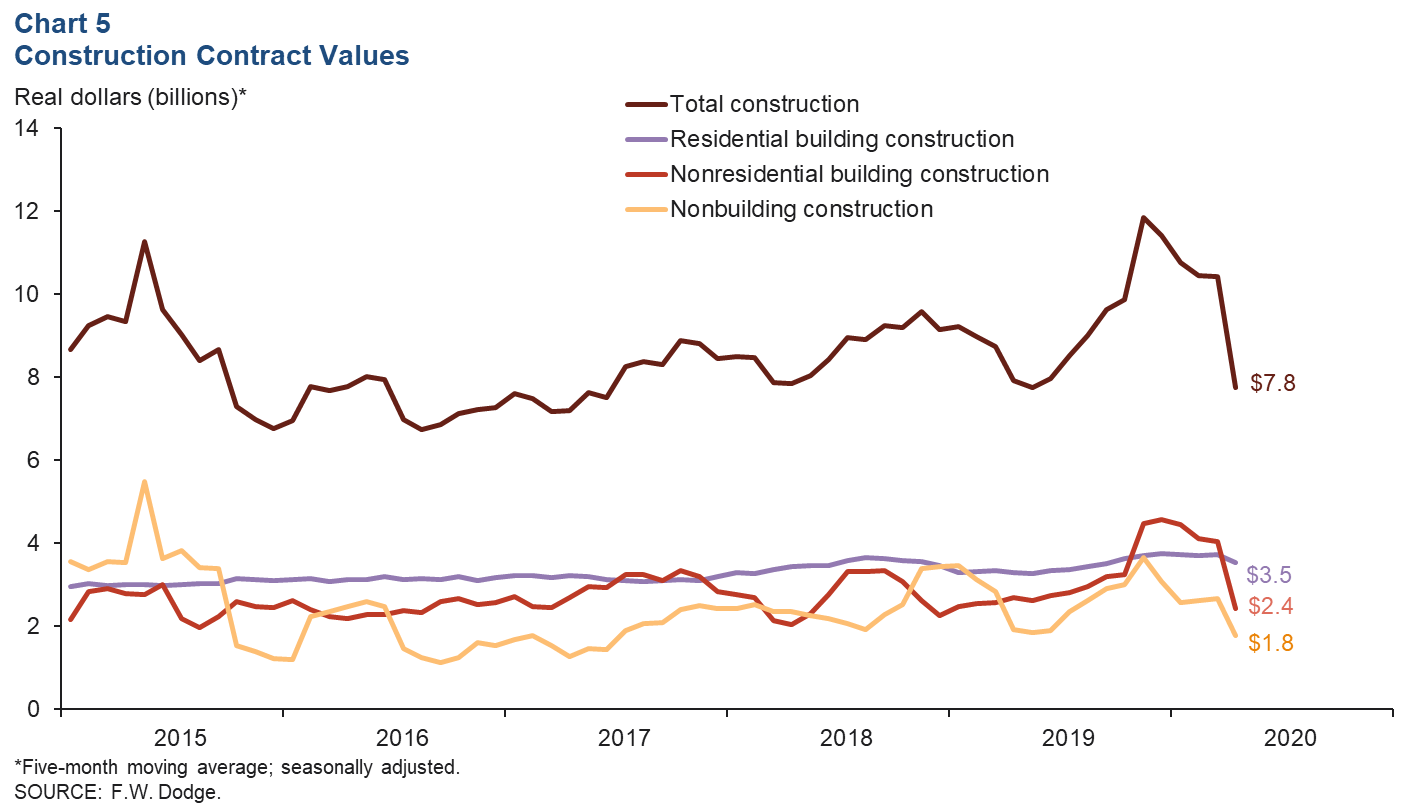
Construction contract values tumbled 21.6 percent in April, with the five-month moving average falling 25.6 percent (Chart 5). The drop in the five-month moving average was the largest since October 1975. Though all major construction categories declined in April, the slump was most pronounced in nonresidential building construction. The five-month moving average in that category fell 39.8 percent to $2.4 billion—its lowest level since December 2018.
Social Distancing Index
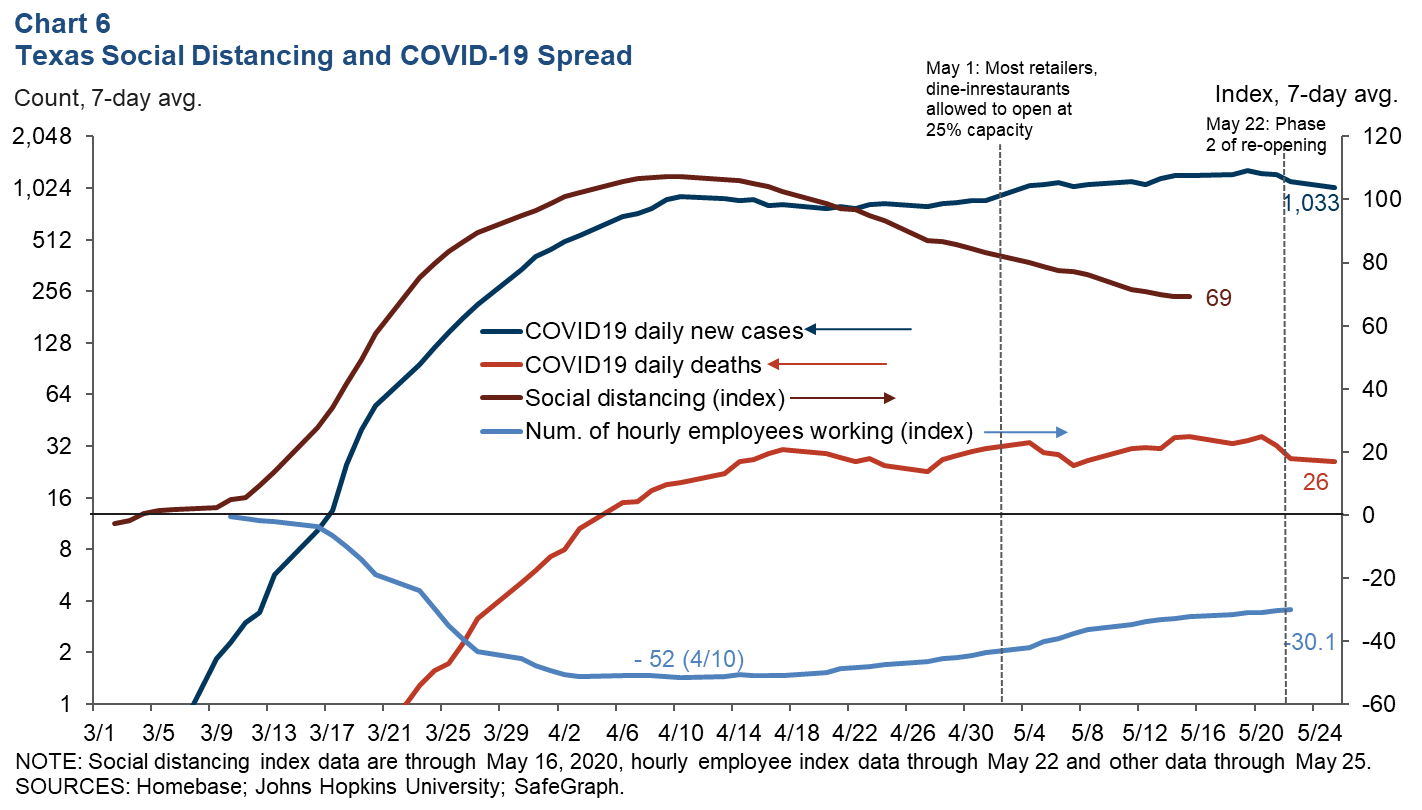
The daily growth rate of COVID-19 new cases and deaths in Texas has fallen since the pandemic began spreading in Texas in early March, as shown by the flattening of both curves (Chart 6). That flattening happened concurrently with an increase in social distancing as measured in the Dallas Fed index using SafeGraph cellphone data. Since peaking in mid-April, social distancing has trended down as restrictions placed on businesses have loosened and people have begun to visit Texas establishments. There’s been a pickup in the number of hourly employees working, according to Homebase data, as more people return to work. The hourly employees index reached a low on April 10.
NOTE: Data may not match previously published numbers due to revisions.
About Texas Economic Indicators
Questions can be addressed to Carlee Crocker at carlee.crocker@dal.frb.org. Texas Economic Indicators is published every month on the Monday after Texas employment data are released.