Texas Economic Indicators

November 24, 2020
After growth slowed in September, the Texas economy showed signs of acceleration in October as payroll growth strengthened and the unemployment rate began to decline again. Results from the Dallas Fed’s Texas Business Outlook Surveys indicated an improving outlook in October. Texas exports have been more volatile through the pandemic than national exports, likely attributable to swings in energy exports. Daily new COVID-19 cases across the state have recently risen, most notably in El Paso. Meanwhile, the share of Texans without health insurance as of Nov. 9 was almost twice the national rate.
Labor Market
Employment Growth Picks Up
Texas employment grew a nonannualized 0.8 percent in October after rising an upwardly revised 0.4 percent in September (Chart 1). October growth was slightly stronger in the goods-producing sector, up a nonannualized 0.9 percent, than in the service-providing sector, which rose 0.8 percent. The service sector, which makes up 85.4 percent of Texas employment, has experienced a sharper fall and faster recovery but remains 5.5 percent below February prepandemic levels on a nonannualized basis. The goods sector experienced a more muted initial downturn in the spring but hasn’t seen a substantial recovery since April, remaining a nonannualized 7.4 percent below February levels. Overall, total Texas employment is 5.8 percent short of February employment.
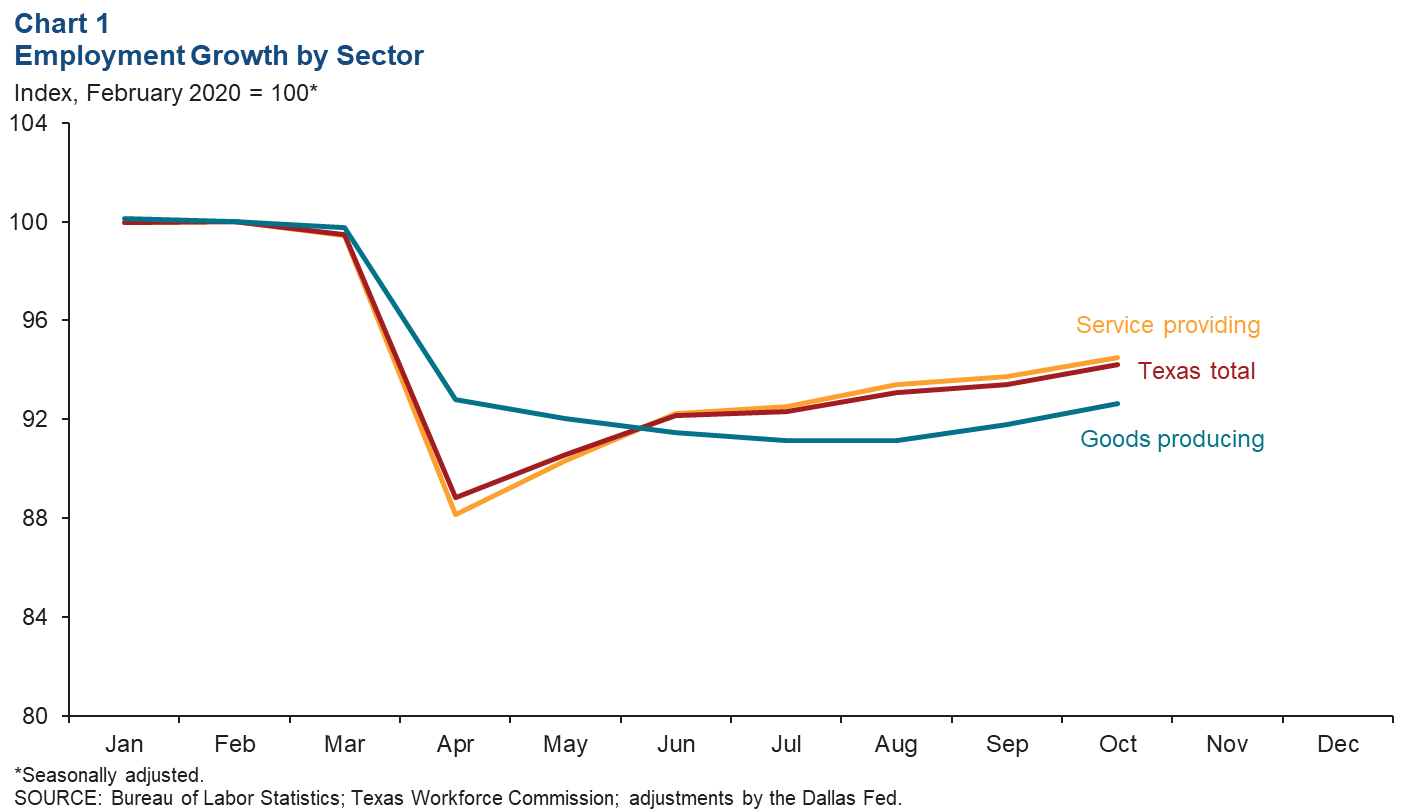
U.S. employment also increased in October but more slowly than in Texas for the first time since jobs declined nationwide in April. In October, U.S. payrolls remained 6.6 percent below their February level.
Unemployment Falls
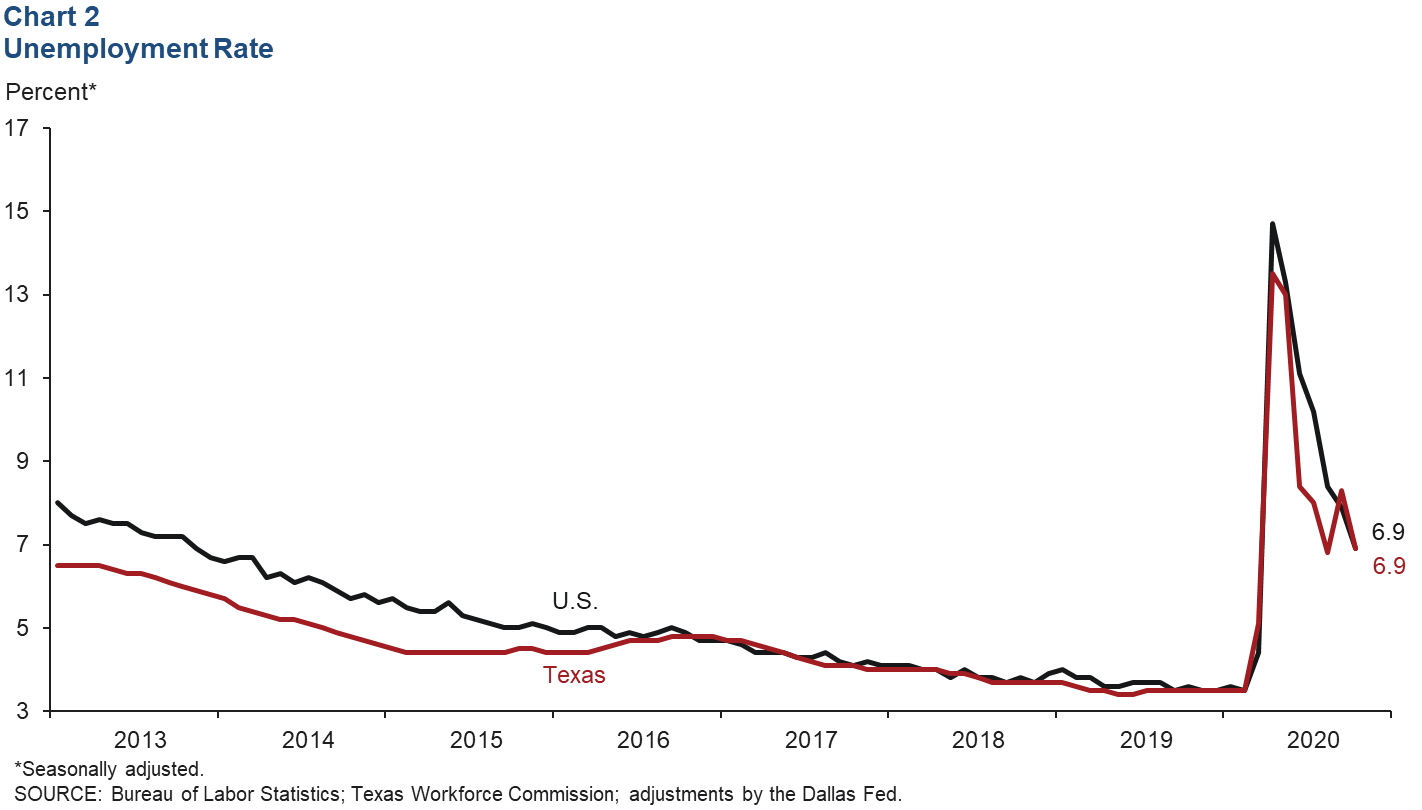
After climbing above the U.S. unemployment rate in September, the Texas unemployment rate fell in October to 6.9 percent to match the U.S. rate (Chart 2). The U.S. unemployment rate declined for the sixth straight month. Texas unemployment claims have slightly declined so far in November.
Texas Business Outlook Surveys
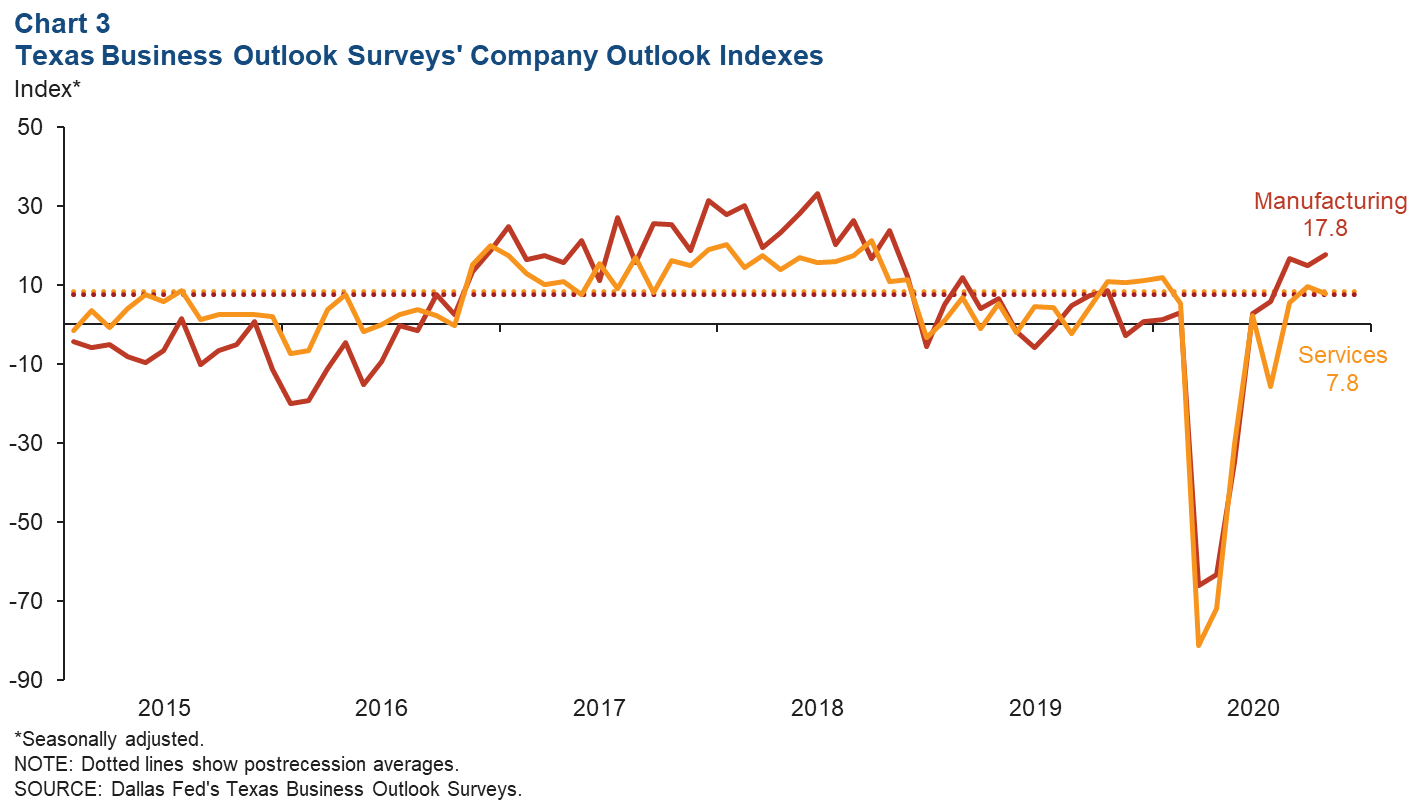
Respondents to the October Texas Business Outlook Surveys indicated continued improvement in company outlooks (Chart 3). Results are shown as a diffusion index, in which a positive reading means more respondents indicated improving than worsening conditions. Both manufacturing and service sector industries in Texas reported weakening outlooks from March through May this year. Since then, manufacturing firms’ outlooks have been optimistic. Service sector respondents across the state reported slight growth in June, followed by a contraction in July as Texas experienced a surge in COVID-19 cases. From that point, the results have been more positive but less so than in manufacturing.
Exports
Exports from Texas and the U.S. both saw sharp declines in the spring, followed by a broad-based recovery. However, Texas saw larger swings and in September remained 20.9 percent below February prepandemic levels versus 12.6 percent for the U.S. The Texas swings were primarily driven by the energy sector, which saw exports decline by half from February to May, climb steadily through August and dip again in September (Chart 4). Excluding energy-related exports, the Texas and U.S. export performances have been similar.
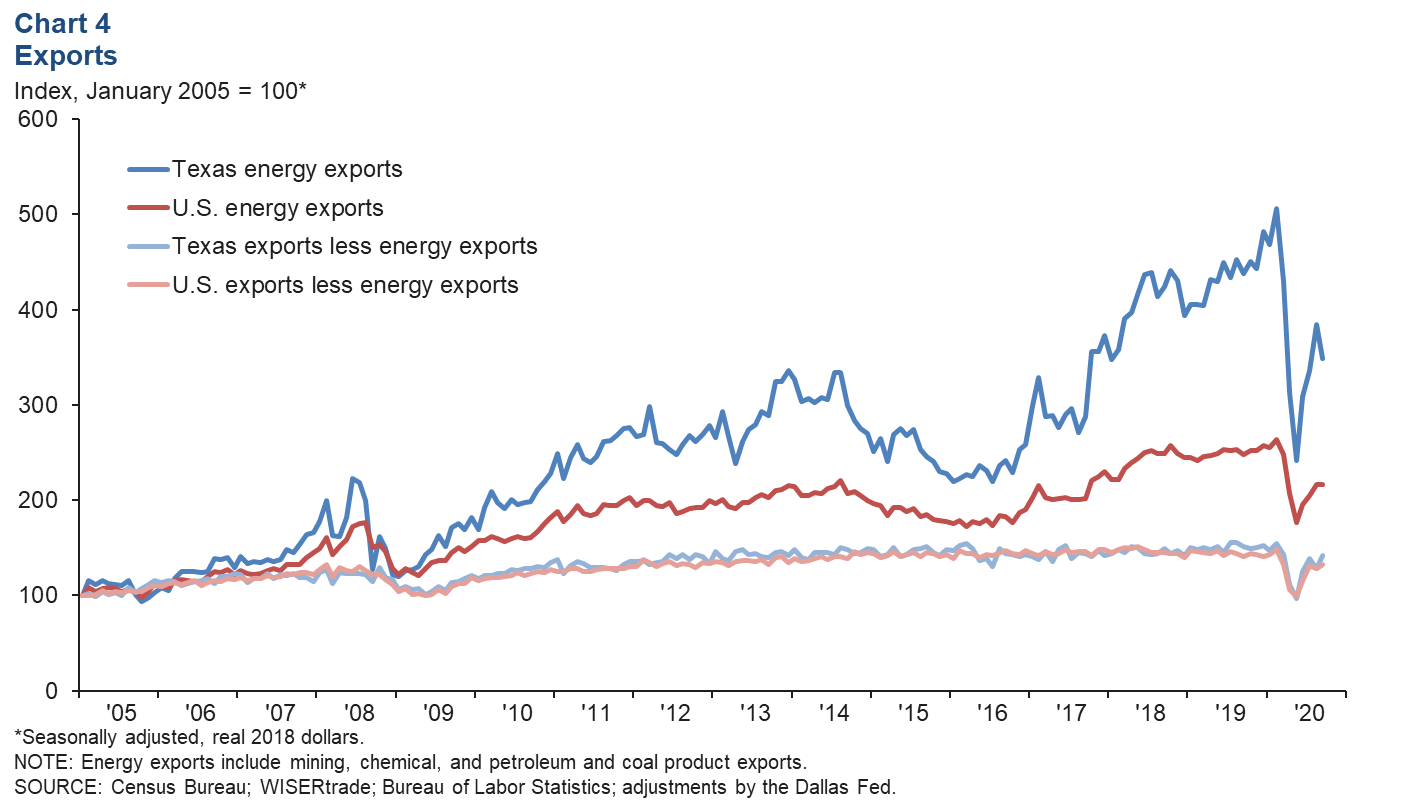
Texas’ exports to China, Australia and Latin America increased in September, while exports to the rest of Asia, Europe and Canada slipped. For the U.S., exports to every major region in the world rose in the month except for exports to Asia excluding China.
Health and the Economy
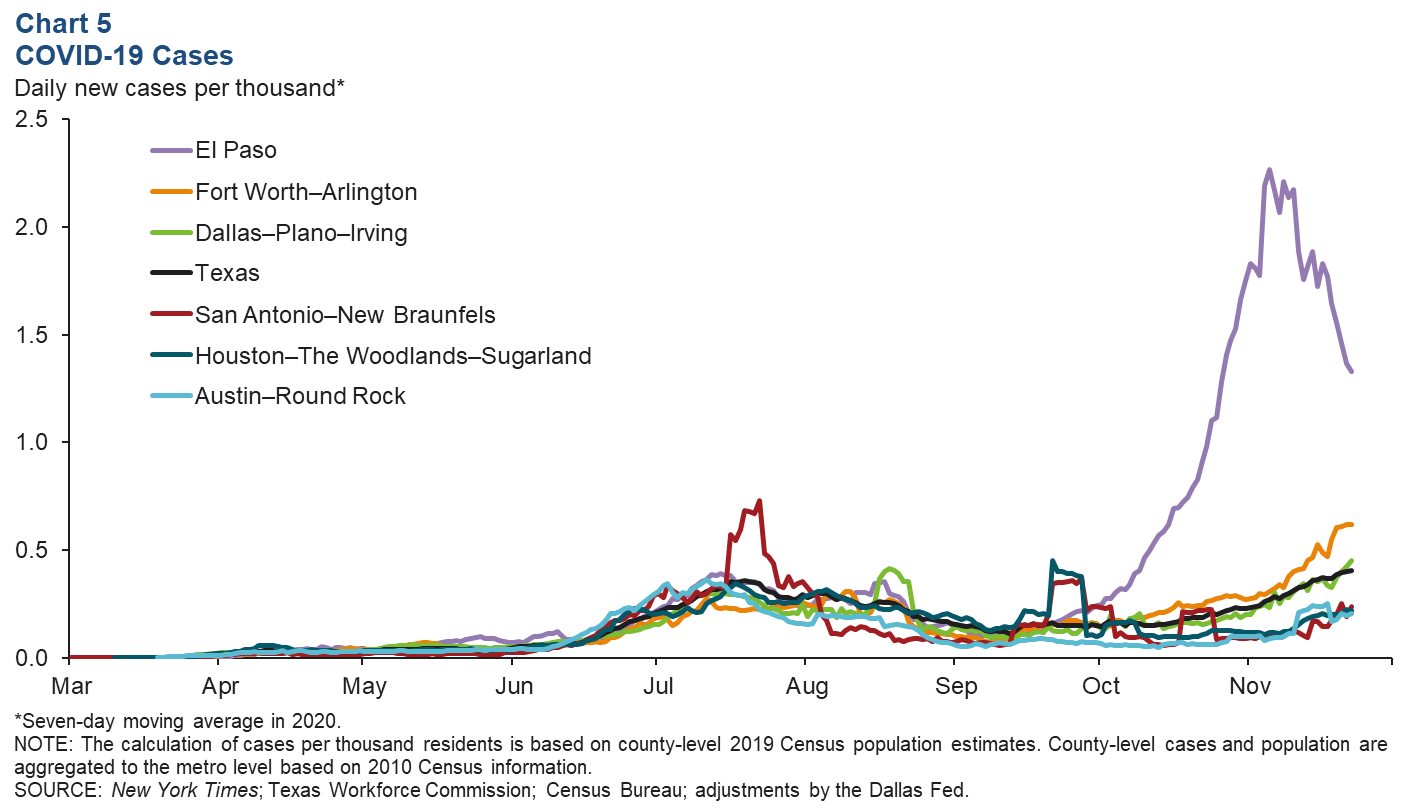
COVID Cases on the Rise Again
COVID-19 case levels across the state can be indicative of the health of local economies. These trends can be seen in county-level case data from the New York Times that have been aggregated to the metro level based on Texas Workforce Commission methodology (Chart 5). Daily new COVID cases in Texas’ metros increased in mid-June and July after the state relaxed stay-at-home policies and nonessential business closures. In response, a greater push for social distancing and mask wearing helped daily cases fall through the latter half of the summer. Beginning in October and well into November, the seven-day average of daily new cases began to rise again across the metros. This resurgence has been most dramatic in El Paso, which jumped to over two new cases per 1,000 residents per day. Since peaking Nov. 5, daily cases in the metro have somewhat eased, but they remain more than three times higher than their previous peak in mid-July.
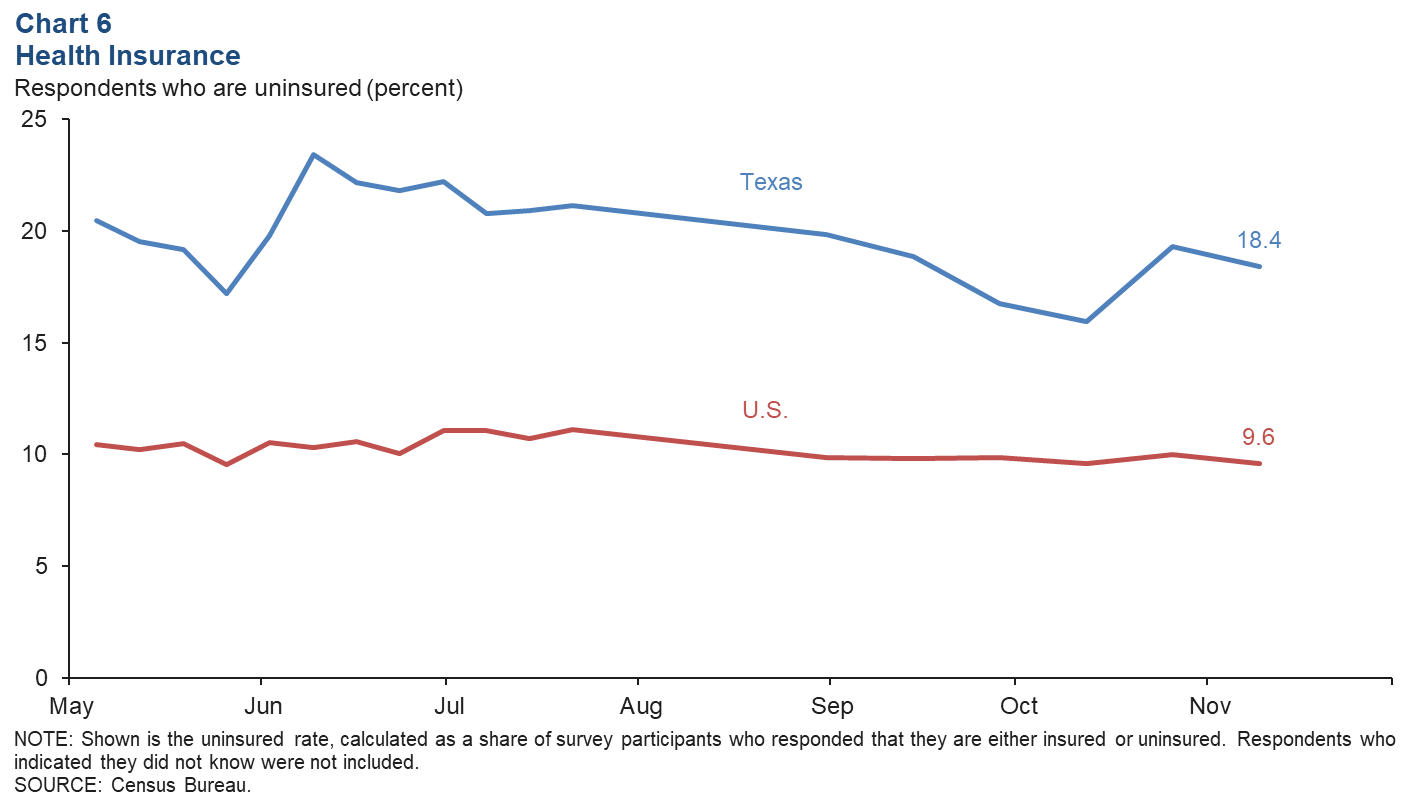
Higher Share of Uninsured in Texas
According to responses from the Census Bureau’s Household Pulse Survey, the share of Texans without health insurance (18.4 percent) is almost twice the share in the nation overall (Chart 6). The national share has remained largely flat since the first release of survey data in early May. The Texas rate has fluctuated: A jump in the uninsured share at the end of May through the beginning of June was followed by a gradual decline through mid-October. The Oct. 14–26 survey period indicates another increase in the statewide share of respondents who don’t have health insurance, followed by a slight decrease through Nov. 9.
NOTE: Data may not match previously published numbers due to revisions.
About Texas Economic Indicators
Questions can be addressed to Carlee Crocker at carlee.crocker@dal.frb.org. Texas Economic Indicators is published every month on the Monday after Texas employment data are released.