Texas Economic Indicators

April 19, 2021
The Texas economic recovery picked up in March as payrolls grew robustly and the unemployment rate was flat. The Texas Business-Cycle Index grew for the 10th month in a row. Texas Business Outlook Survey respondents reported strong growth in March, and energy prices ticked up in the week ending April 16. The share of seriously delinquent student loans in Texas dropped in February, but overall loan delinquencies increased, driven by a rise in credit card delinquencies.
Labor market
Texas employment growth strong
Texas employment grew an annualized 11.3 percent in March after slipping a downwardly revised 1.4 percent in February. In first quarter 2021, Texas employment grew 4.7 percent, boosted by the robust March growth (Chart 1). Across industries, first-quarter growth in 2021 was strongest in oil and gas, which climbed 24.9 percent. The only sector that shed jobs in the first quarter was government, though the rate of loss was less than in fourth quarter 2020.
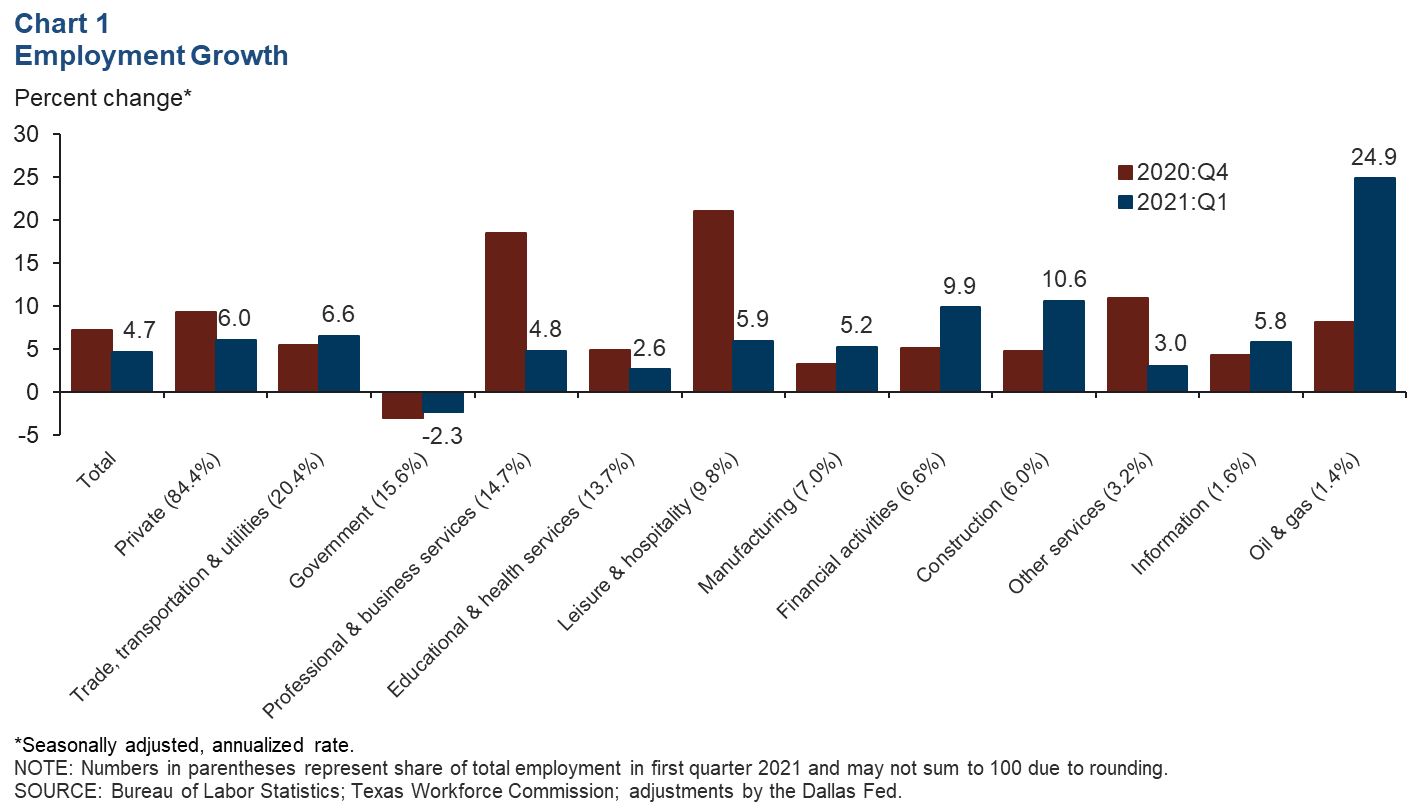
U.S. employment also saw robust growth in March, climbing 8.0 percent. Employment in the nation has expanded at an accelerated pace so far in 2021 after slipping slightly at year-end 2020.
Texas unemployment unchanged
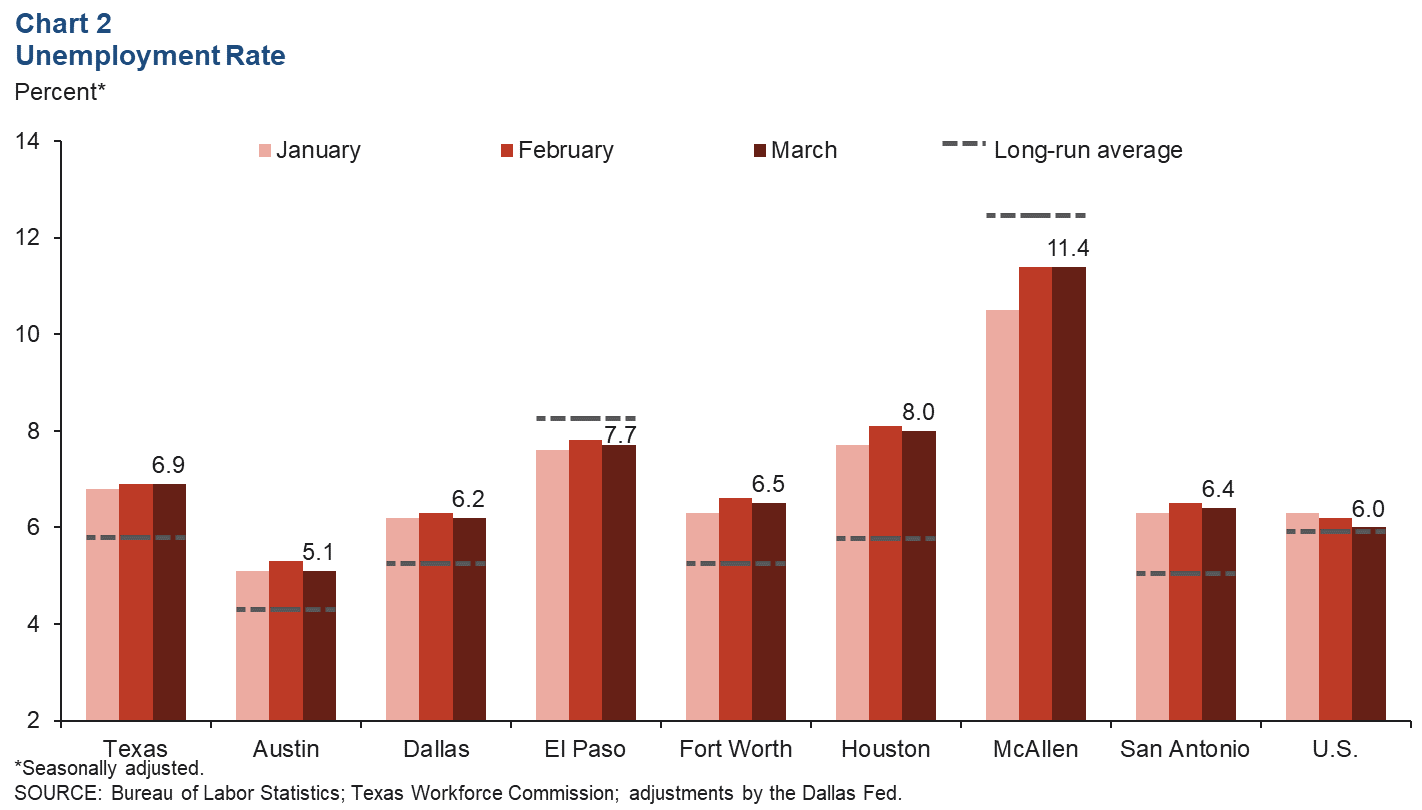
The Texas unemployment rate held steady in March at 6.9 percent (Chart 2). The national rate ticked down for the 11th month in a row to 6.0 percent. Among the major Texas metros, March unemployment was highest in McAllen at 11.4 percent—unchanged from February. Despite this elevated reading, McAllen unemployment in March was below its long-run average of 12.5 percent. All other Texas major metros saw a decline in the jobless rate last month. The largest drop was in Austin, which fell 0.2 percentage points. All other major metros inched down 0.1 percentage points.
Business-cycle index
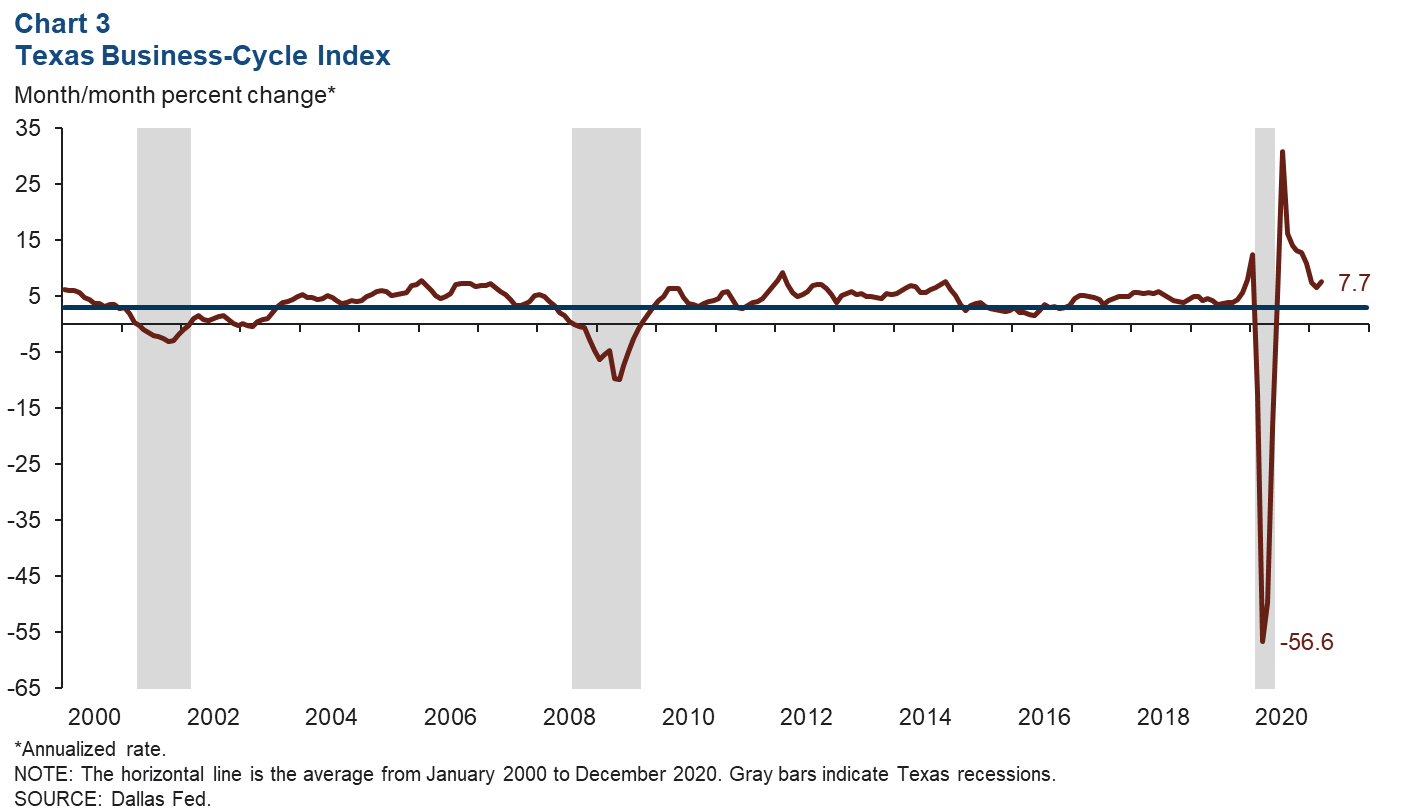
The Texas Business-Cycle Index, a composite of the unemployment rate, state payroll employment and gross state product, measures underlying economic activity in the state. In March, the index climbed an annualized 7.7 percent from February (Chart 3). This is the 10th month the statewide index has shown growth. Despite the continued recovery, the March 2021 index reading remains 4.6 percent below February 2020 prepandemic levels.
Texas Business Outlook Surveys
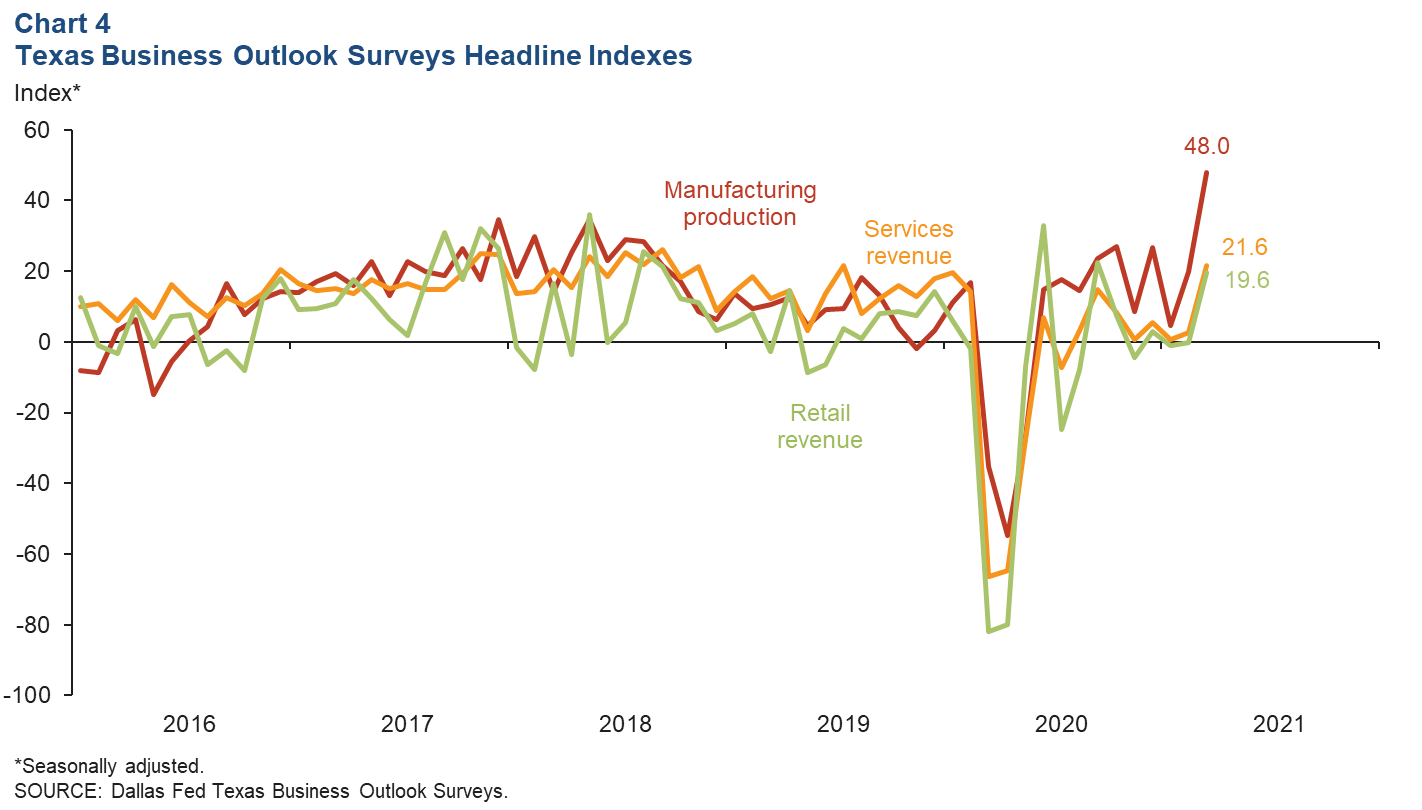
Headline indexes for all three Texas Business Outlook Surveys jumped in March (Chart 4). Revenue in the services and retail sectors increased strongly after two months of stagnancy. Respondents to the manufacturing survey continued to report output growth, with the manufacturing production index hitting a record-high reading in March. A positive reading means that more survey respondents reported an increase in production or revenues than a decrease, indicating that a substantial number of businesses across industries saw growth in March.
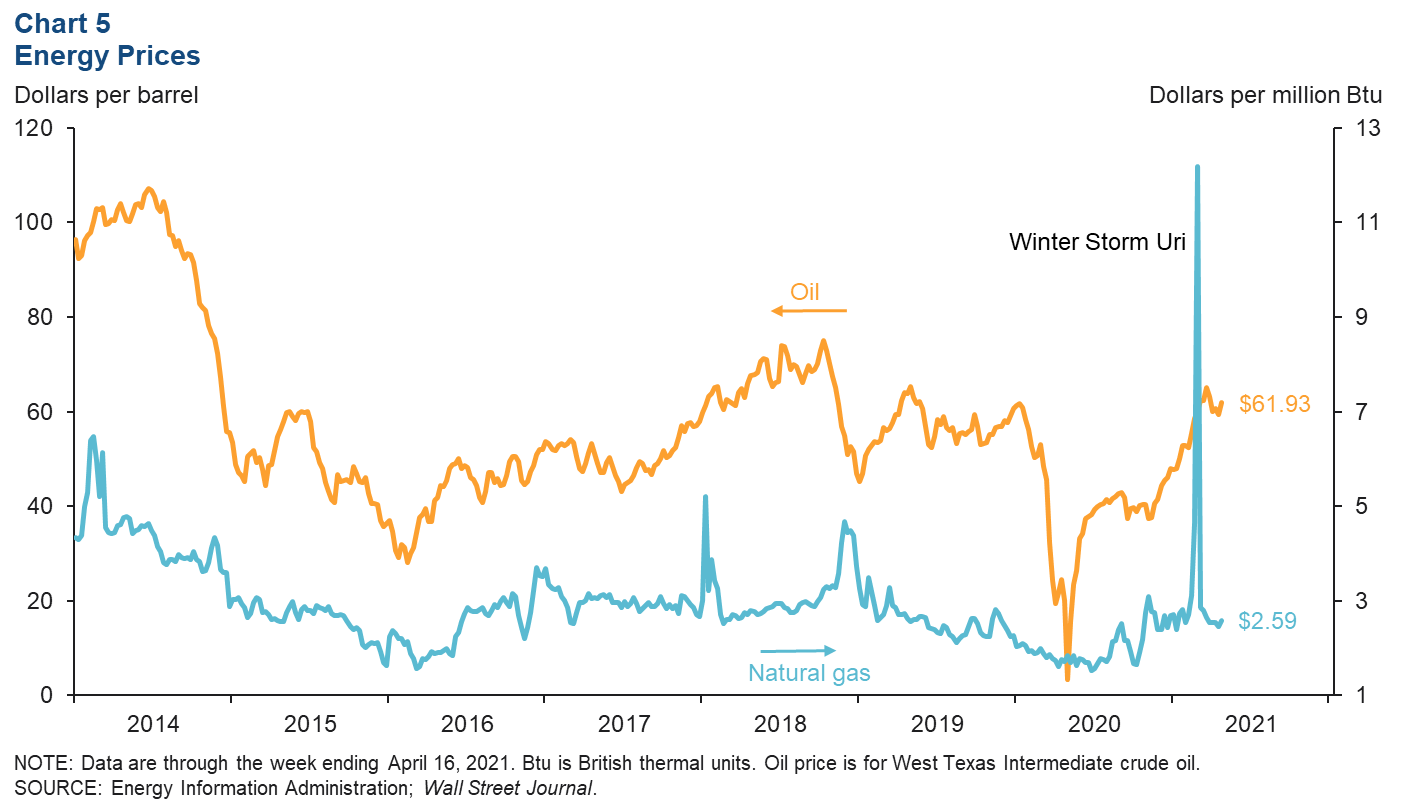
Energy
While oil prices plummeted in 2020 with the onset of the pandemic, natural gas prices saw a more muted decline (Chart 5). In mid-February, Winter Storm Uri swept across the state, and the electric grid failed, causing energy supply to fall while demand increased. During this weeklong crisis, the price of natural gas jumped 163.2 percent before falling down to below prestorm levels the following week. Across the nation, Texas is the largest producer and consumer of natural gas, so the large spike in prices was undoubtedly both caused and felt by Texans in the statewide freeze. Since then, natural gas prices have slipped further. However, in the week ending April 16, natural gas prices ticked up to $2.59 per million British thermal units, and oil prices climbed similarly to $61.93 per barrel.
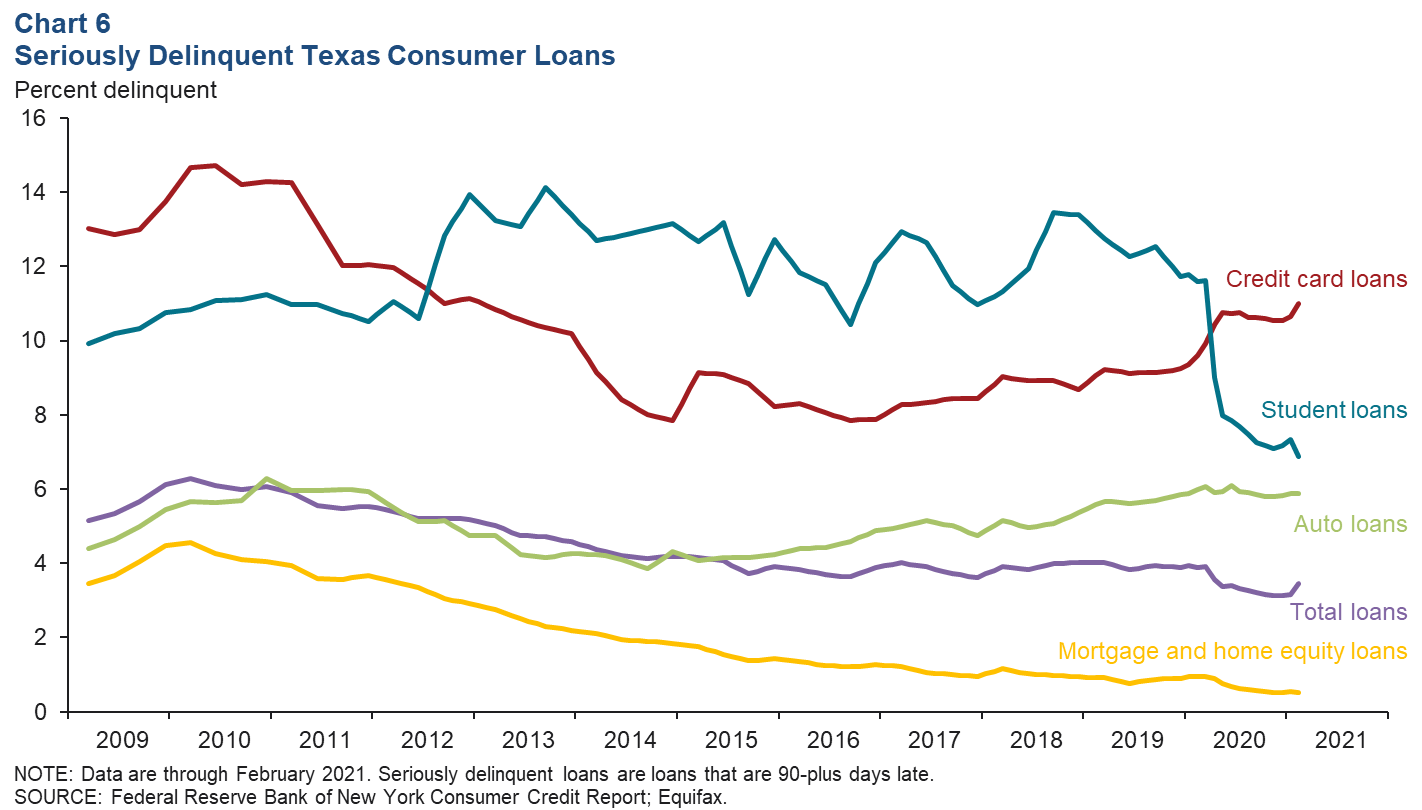
Seriously delinquent loans
Despite nonessential business closures for part of 2020 that caused many Texans to lose their jobs, the number of Texans who were 90 or more days late in making loan payments declined throughout last year (Chart 6). This decline was aided by strong fiscal support from the government and a moratorium on student loans and mortgages. In an analysis of the Survey of Consumer Expectations, the New York Fed reported that the average household used over one-third of stimulus check payments to pay down debt. The strongest decline was in student loan delinquencies, which slipped below credit card delinquencies for the first time since 2012. In late March 2020, federal student loans were put into forbearance, and that pause in payments has been extended through Sept. 30, 2021. Credit card loan delinquencies have increased during the pandemic and climbed 0.3 percentage points in February. This increase pushed total delinquencies up 0.3 percentage points in the month, despite delinquencies being flat to down in all other categories.
NOTE: Data may not match previously published numbers due to revisions.
About Texas Economic Indicators
Questions can be addressed to Carlee Crocker at carlee.crocker@dal.frb.org. Texas Economic Indicators is published every month during the week after state and metro employment data are released.