Texas Economic Indicators

November 23, 2021
The Texas economy continued to expand broadly in October. Employment growth was strong and broad based across sectors, and the unemployment rate dipped further. The October Texas Business Outlook Surveys (TBOS) indicated that wage pressures are at or near all-time highs. In mid-November, dining-out levels climbed statewide and in all major Texas metros, and oil prices dipped while rig counts continued to rise. Texas home inventories remained tight, and median home prices rose to new highs in October.
Labor market
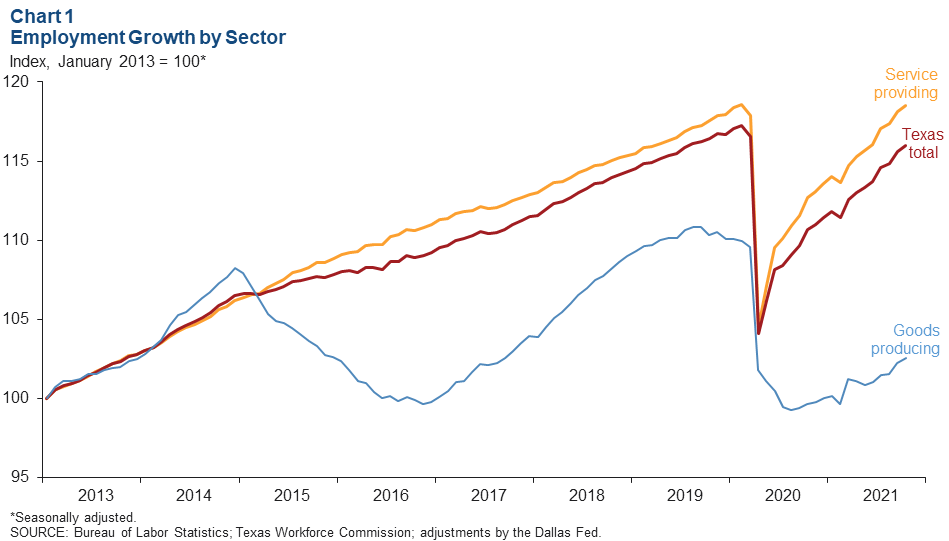
Texas employment expanded an annualized 3.8 percent in October after growing a downwardly revised 8.2 percent in September (Chart 1). Texas gained approximately 39,900 jobs in October. Although Texas employment growth continues to be broad based, recovery in the service sector has outperformed that in the goods sector. Year-to-date job growth in the service sector, at an annualized 5.3 percent, has exceeded the goods-producing sector’s 3.0 percent increase. Compared with February 2020 levels, employment is only 0.1 percent away from prepandemic levels in the service sector but still 6.8 percent short in the goods-producing sector. The unemployment rate dipped to 5.4 percent in October.
Texas Business Outlook Surveys
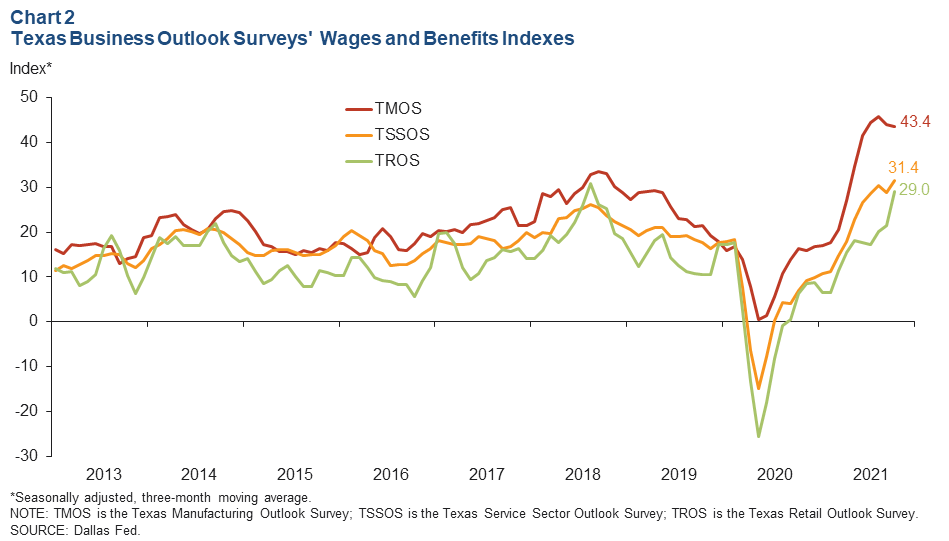
The Texas Business Outlook Surveys point to continued strong wage growth (Chart 2). In October, the three-month moving average of the manufacturing survey’s wages and benefits index dipped to 43.4 but remained near the record levels seen in July 2021. The service sector wages and benefits index set a new high in October based on a three-month moving average, and the retail sector index reached its highest level since 2018. The elevated index levels in all three sectors indicate a tightening labor market in which competition for workers continues to rise.
Dining out
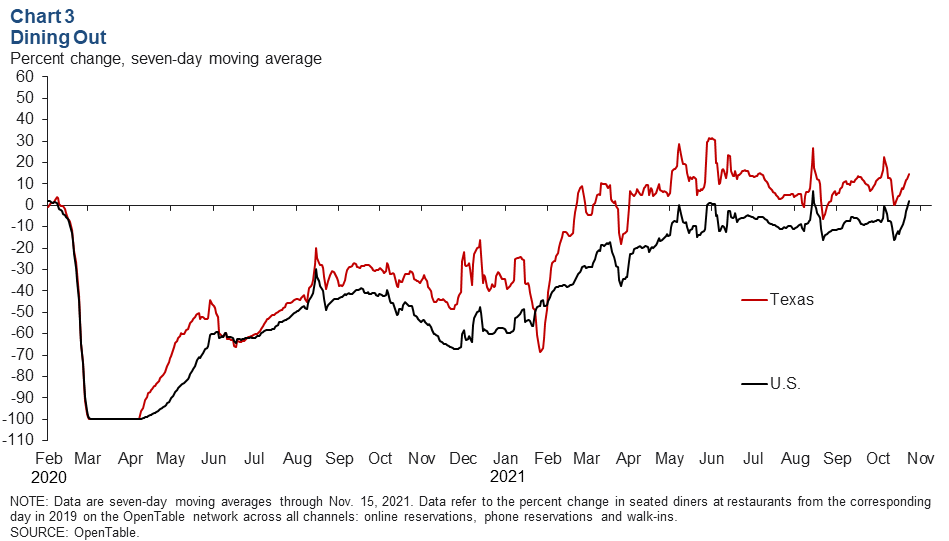
As of Nov. 15, the number of seated-diner reservations at restaurants edged up in both the U.S. and Texas based on a seven-day moving average (Chart 3). The statewide figure is 14.6 percent above 2019 levels. Meanwhile, the U.S. figure turned positive for the first time in two months and was 2.3 percent above 2019 levels. San Antonio had the highest dining-out level among the major Texas metros at 22.5 percent above 2019 levels, followed by Austin at 20.5 percent. Austin’s current value is the highest since late February 2020. Dining out was up 3.0 percent in Houston and 6.2 percent in Dallas.
Energy
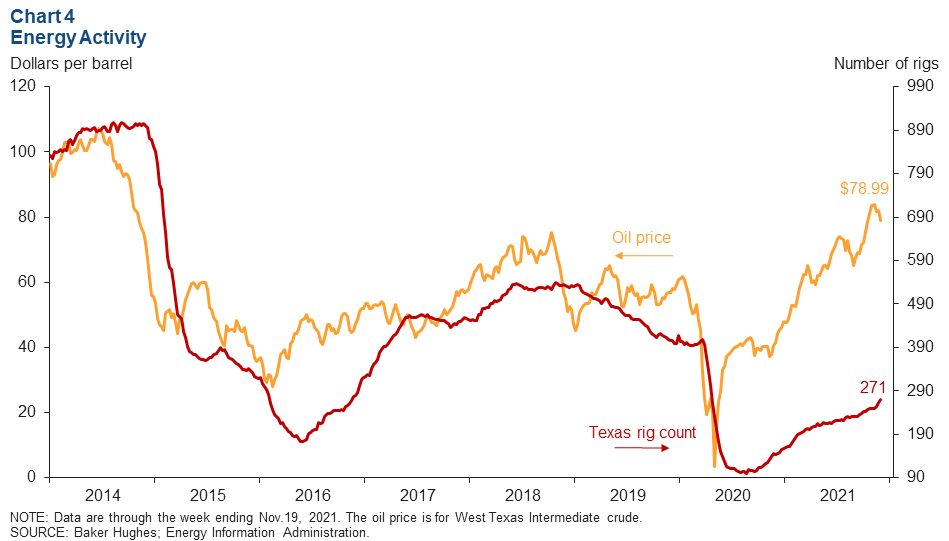
As of the week ending Nov. 19, the rig count increased and oil prices decreased (Chart 4). The rig count moderately rose to 271 but remained well below prepandemic levels. Oil prices were $78.99 per barrel, a decrease of $2.94 from the prior week.
Housing
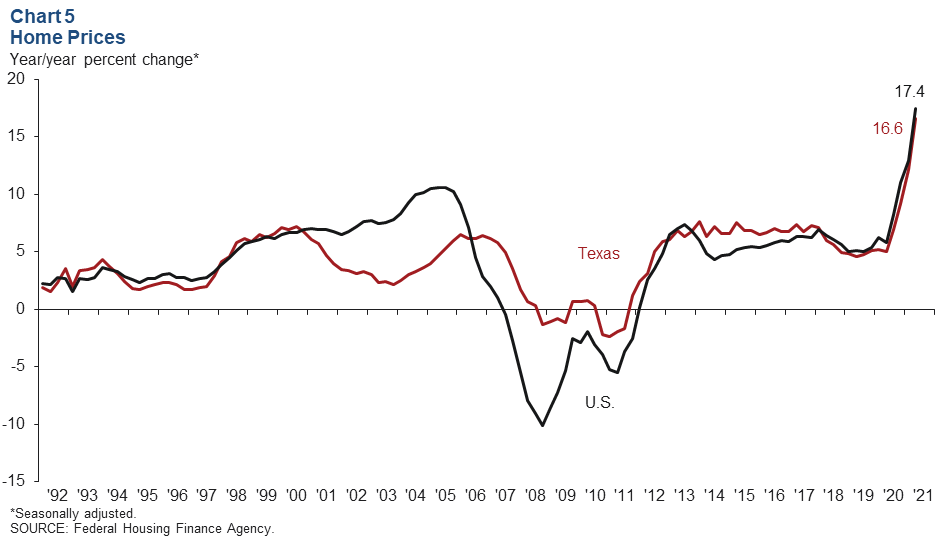
Home prices continue to rise rapidly
U.S. and Texas home prices climbed 4.9 percent and 4.7 percent, respectively, in second quarter 2021—the latest quarterly data available (Chart 5). On a year-over-year basis, home prices in the quarter surged 17.4 percent in the U.S. and 16.6 percent in Texas—a record-setting pace for annual price growth for both. In October, the median home price in Texas rose to a new high of $310,971. Home price appreciation has been driven by strong demand, coupled with very low inventories.
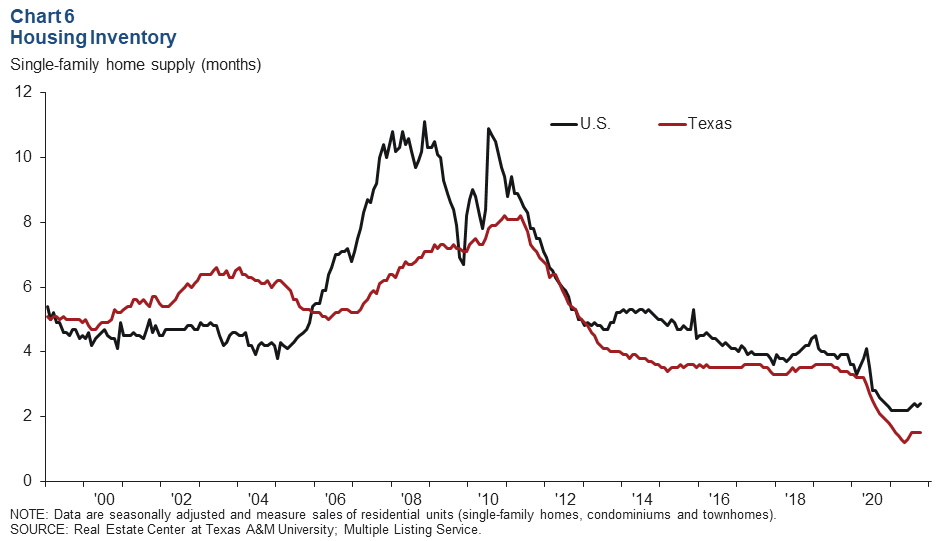
Housing inventories remain at low levels
In October, housing inventories remained extremely tight, near record lows and well below the equilibrium level of six months of supply (Chart 6). U.S. existing-home inventories ticked up to 2.4 months, and Texas levels remained flat at 1.5 months.
NOTE: Data may not match previously published numbers due to revisions.
About Texas Economic Indicators
Questions can be addressed to Laila Assanie at Laila.Assanie@dal.frb.org and Mytiah Caldwell at Mytiah.Caldwell@dal.frb.org. Texas Economic Indicators is published every month during the week after state and metro employment data are released.