Texas Economic Indicators

January 26, 2023
| Texas economy dashboard (December 2022) | |||
| Job growth (annualized) Sept.–Dec. '22 |
Unemployment rate |
Avg. hourly earnings |
Avg. hourly earnings growth y/y |
| 3.4% | 3.9% | $30.53 | 4.7% |
Texas’ economy continued to expand in December. Payroll gains were broad based, and the unemployment rate dipped. Growth in the Texas Business-Cycle Index cooled but remained above the 2000–22 average. Headline indexes in the December Texas Business Outlook Surveys (TBOS) indicated an increase in manufacturing but flat activity in the service sector. Oil prices rose in mid-January. Construction contract values fell for the third straight month in November.
Labor Market
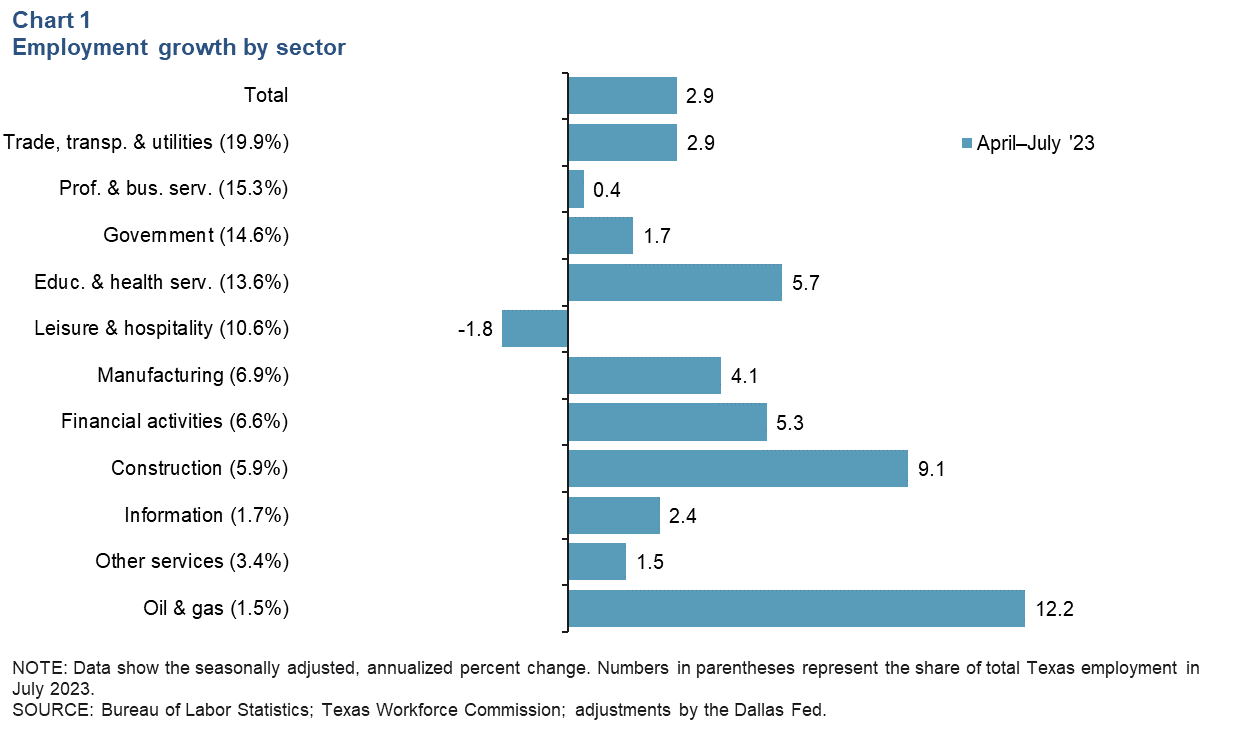
Texas employment increases across sectors
Texas employment expanded an annualized 2.3 percent in December after growing 4.3 percent in November (Chart 1). Employment rose 2.9 percent in the goods sector and 2.2 percent in services. Employment in the goods sector rose 3.8 percent in 2022, slightly outpacing the service sector’s 3.4 percent increase. The state unemployment rate dropped to 3.9 percent in December after holding steady at 4.0 percent for three straight months.
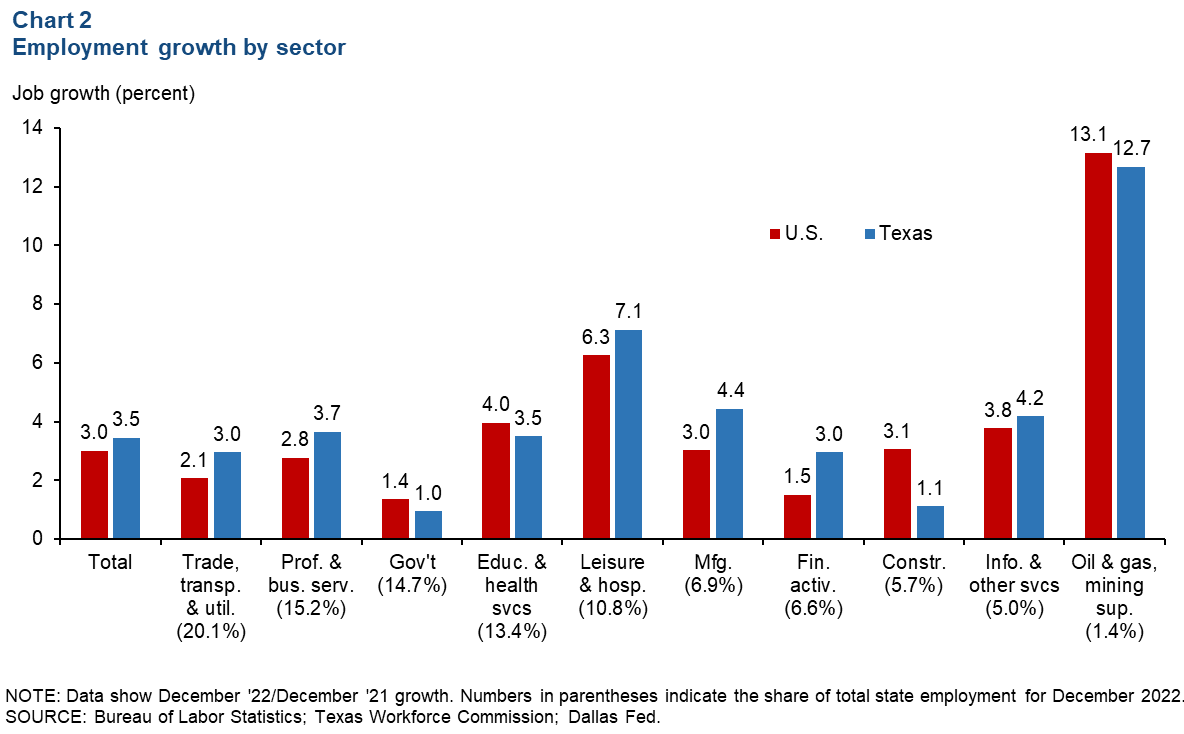
Texas outpaces U.S. in 2022 job growth
Texas employment expanded 3.5 percent in 2022, surpassing the nation’s overall job growth of 3.0 percent (Chart 2). The state’s job gains were widespread across major industry groups, led by the oil and gas and leisure and hospitality industries, which rose 12.7 percent (22,035 jobs) and 7.1 percent (97,272), respectively. Government and construction posted the slowest growth at 1.0 percent and 1.1 percent, respectively.
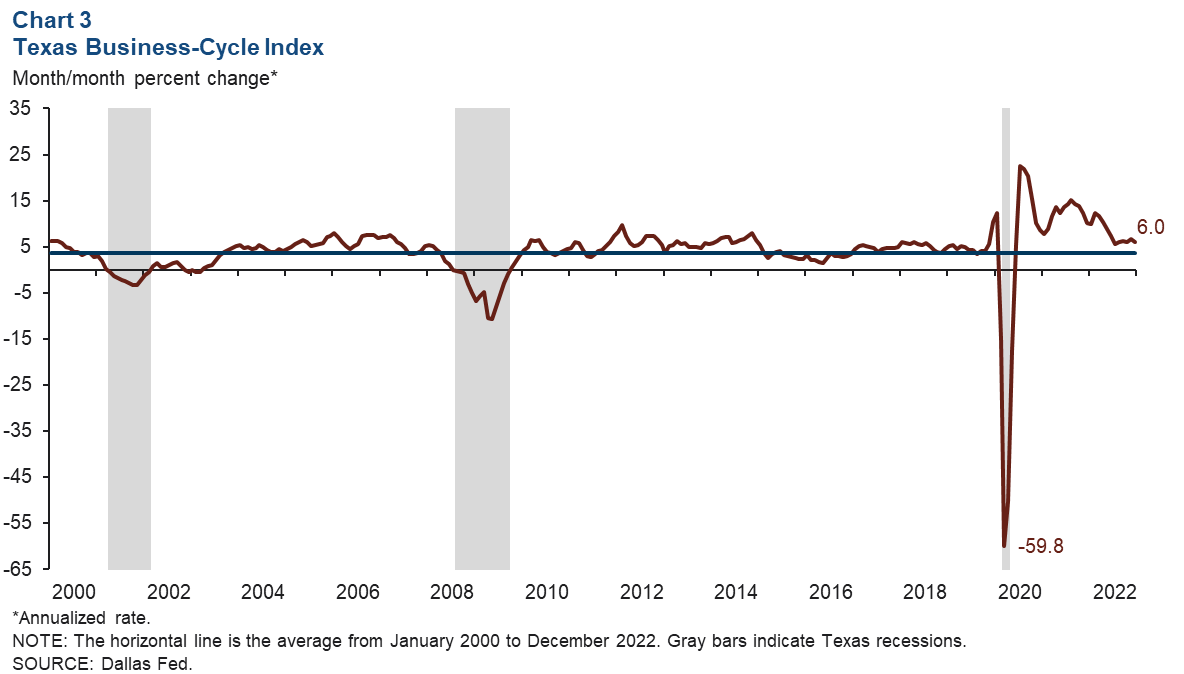
Business-cycle index
The Texas Business-Cycle Index—a composite of the unemployment rate, state payroll employment and gross state product—reflects underlying economic activity in the state. In December, the index grew at an above-average annualized pace of 6.0 percent—slightly slower than November’s 6.7 increase (Chart 3). Year over year, the index rose 8.1 percent thanks to falling unemployment and strong job growth statewide.
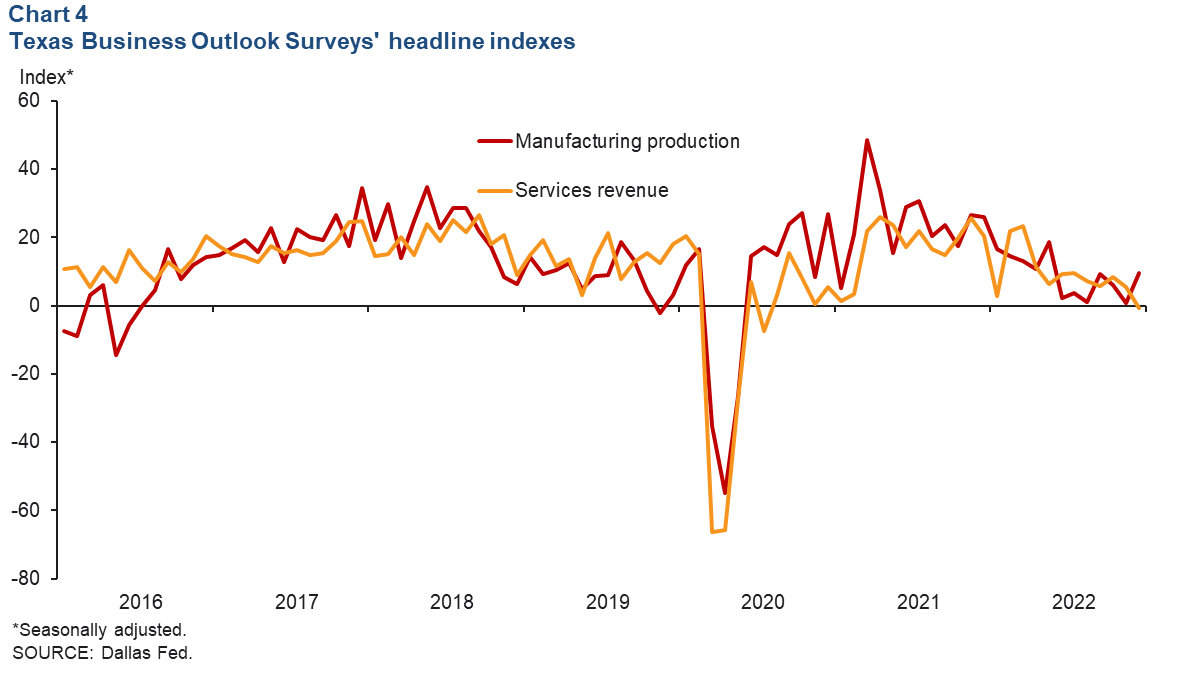
Texas Business Outlook Surveys
The Texas Business Outlook Surveys indicate that activity in the manufacturing sector rebounded at year-end, while service sector growth weakened (Chart 4). In December, the manufacturing production index increased 8.9 points to 9.7. In contrast, the service sector revenue index posted its first negative reading since July 2020. It fell 6.1 points to -0.6, indicative of no growth. Perceptions of broader business conditions continued to be pessimistic in December.
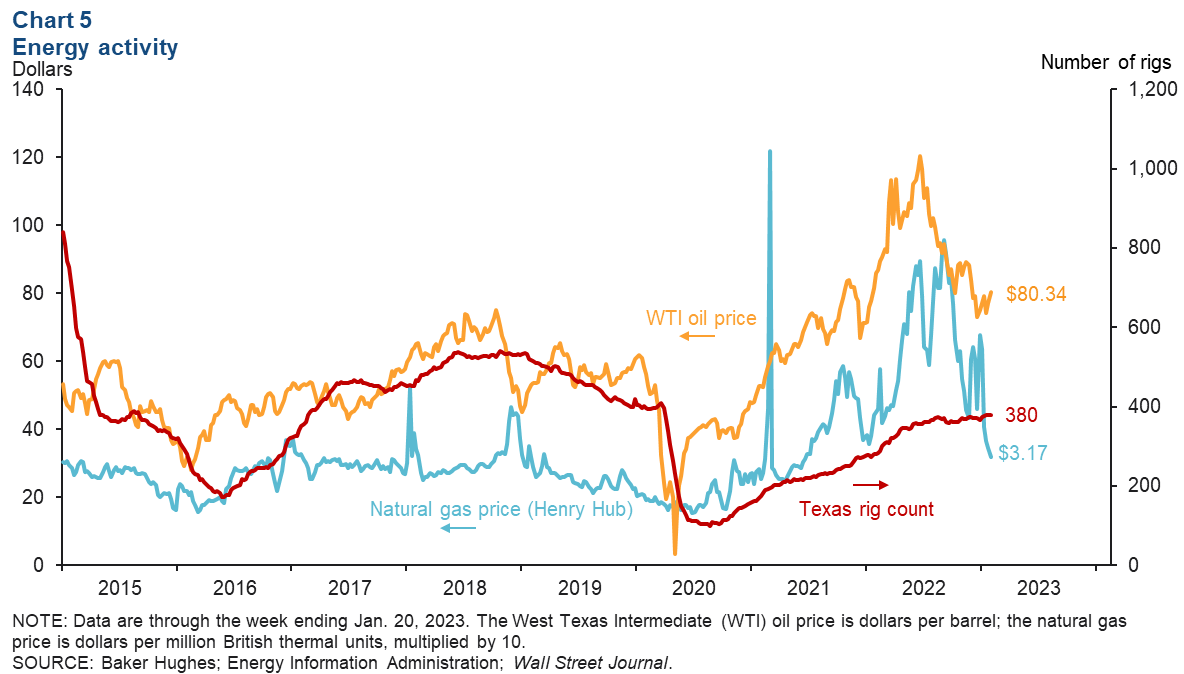
Energy
Oil prices increased in January. As of the week ending Jan. 20, West Texas Intermediate crude was $80.34 per barrel, an increase of $3.24 from the previous week (Chart 5). Natural gas (Henry Hub) fell 28 cents to $3.17 per million British thermal units. The number of active rigs in Texas ticked up from 379 to 380 during the same period.
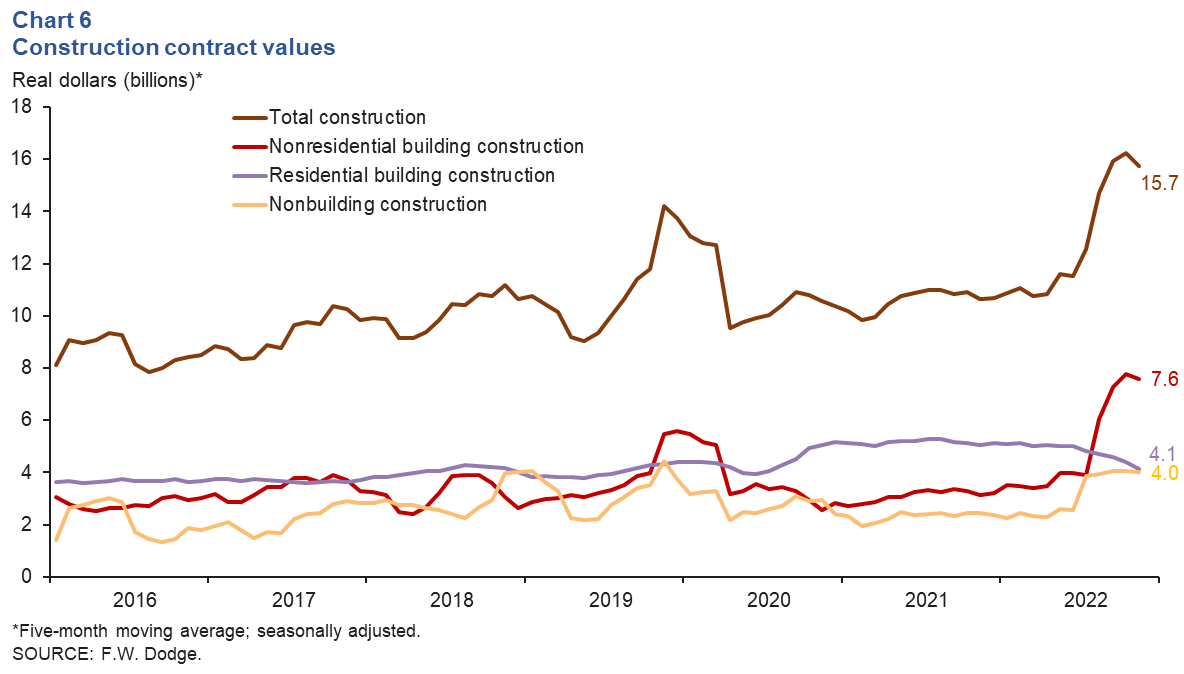
Construction
Construction contract values plunged for the third straight month, falling 40.5 percent in November. The five-month moving average dipped 3.1 percent (Chart 6). Contract values for the three major construction categories declined in November. The five-month moving average of residential values dropped to $4.1 billion, nonresidential building construction values fell to $7.6 billion, and nonbuilding construction dipped to $4.0 billion. Year to date through November, total construction contract values were up 26 percent compared with the same period in 2021.
NOTE: Data may not match previously published numbers due to revisions.
About Texas Economic Indicators
Questions or suggestions can be addressed to Mytiah Caldwell at Mytiah.Caldwell@dal.frb.org. Texas Economic Indicators is published every month during the week after state and metro employment data are released.