Texas Economic Indicators

May 25, 2023
| Texas economy dashboard (April 2023) | |||
| Job growth (annualized) Jan. '23–Apr. '23 |
Unemployment rate |
Avg. hourly earnings |
Avg. hourly earnings growth y/y |
| 3.0% | 4.0% | $31.24 | 5.0% |
Texas’ economy expanded further in April. Employment gains accelerated in some sectors, while job openings moderated but remained elevated. Existing-home sales increased in April based on a three-month moving average, while inventories were flat. Texas’ retail sales tax collections increased in April.
Labor Market
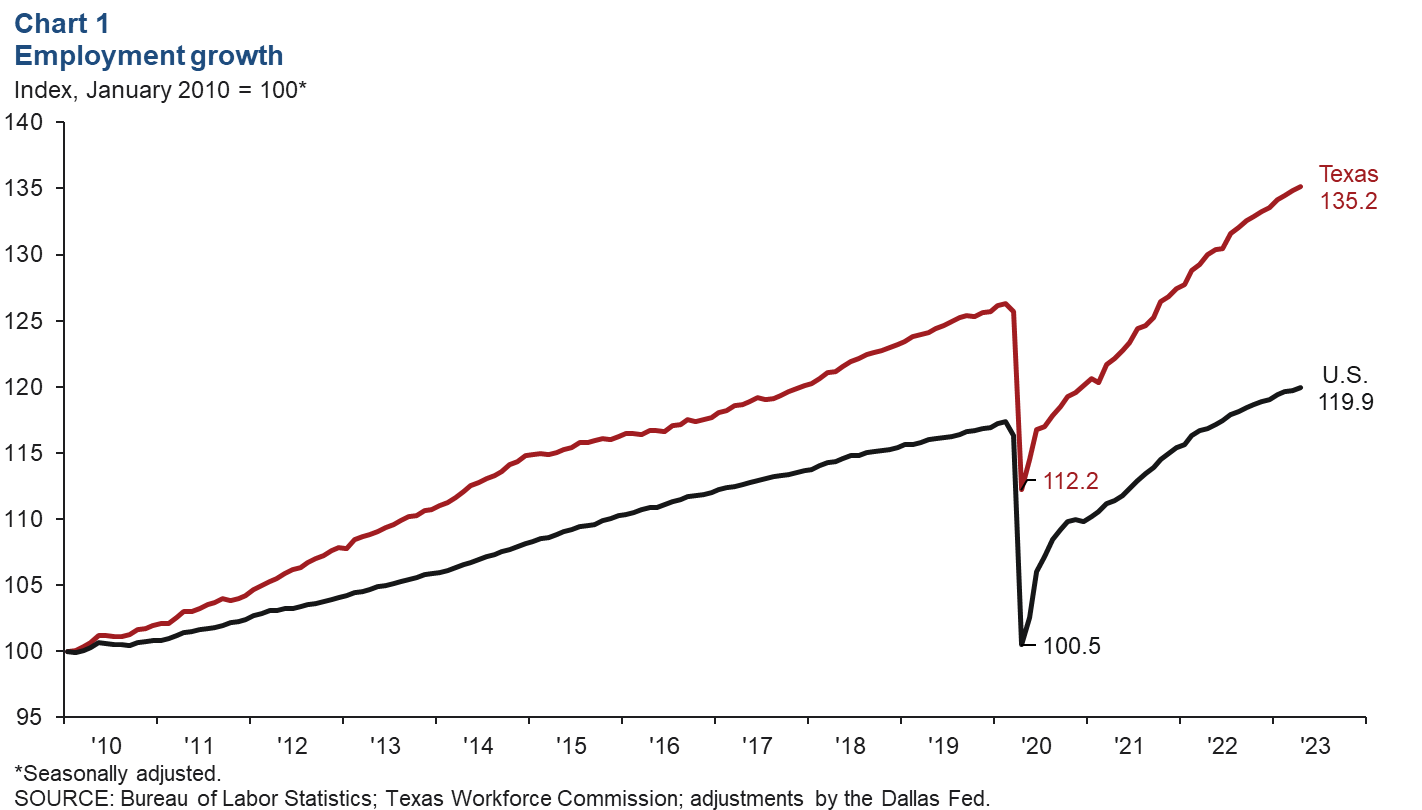
Employment growth remains robust
Texas employment expanded an annualized 2.8 percent in April after growing an upwardly revised 3.2 percent in March, while U.S. payrolls increased an annualized 2.0 percent (Chart 1). Payrolls grew for most major sectors except for construction and financial activities. Through April, payrolls have increased an annualized 3.6 percent in Texas and 2.2 percent in the nation. The Dallas Fed’s Texas Employment Forecast predicts 2.6 percent job growth this year (December/December), up from April’s estimate. The Texas unemployment rate in April was unchanged for a third month in a row at 4.0 percent.
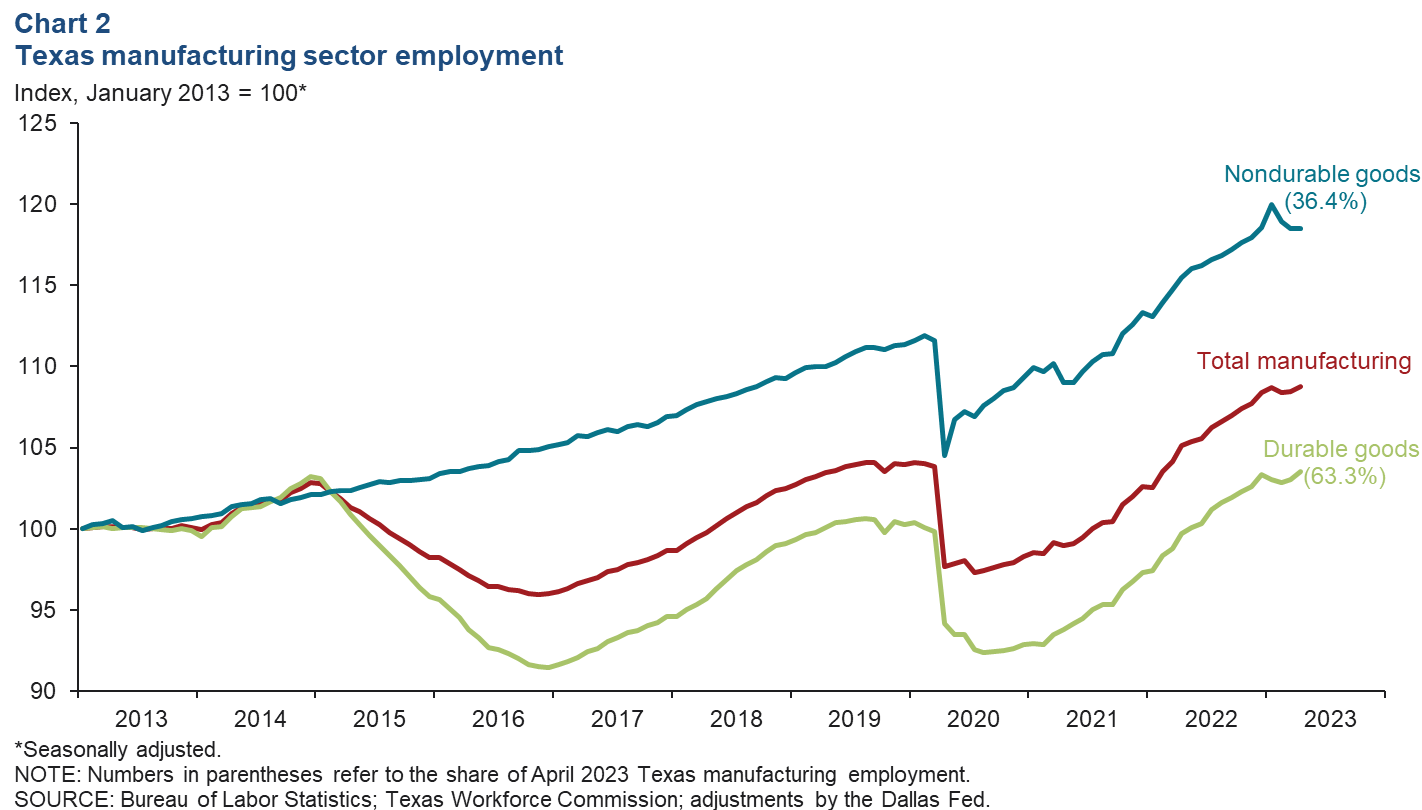
Manufacturing job growth increases
Texas’ manufacturing employment growth accelerated to 3.6 percent in April (Chart 2). Nondurable goods payrolls, which account for 36.4 percent of Texas manufacturing employment, were flat in April after contracting in the previous two months. Employment in durable goods manufacturing, which accounts for nearly two-thirds of Texas manufacturing employment, rose for the second straight month in April. Year-to-date manufacturing payrolls increased an annualized 1.0 percent as durables employment posted gains and nondurables were flat, in part due to declines in food, beverage and tobacco, and plastics and rubber products manufacturing.
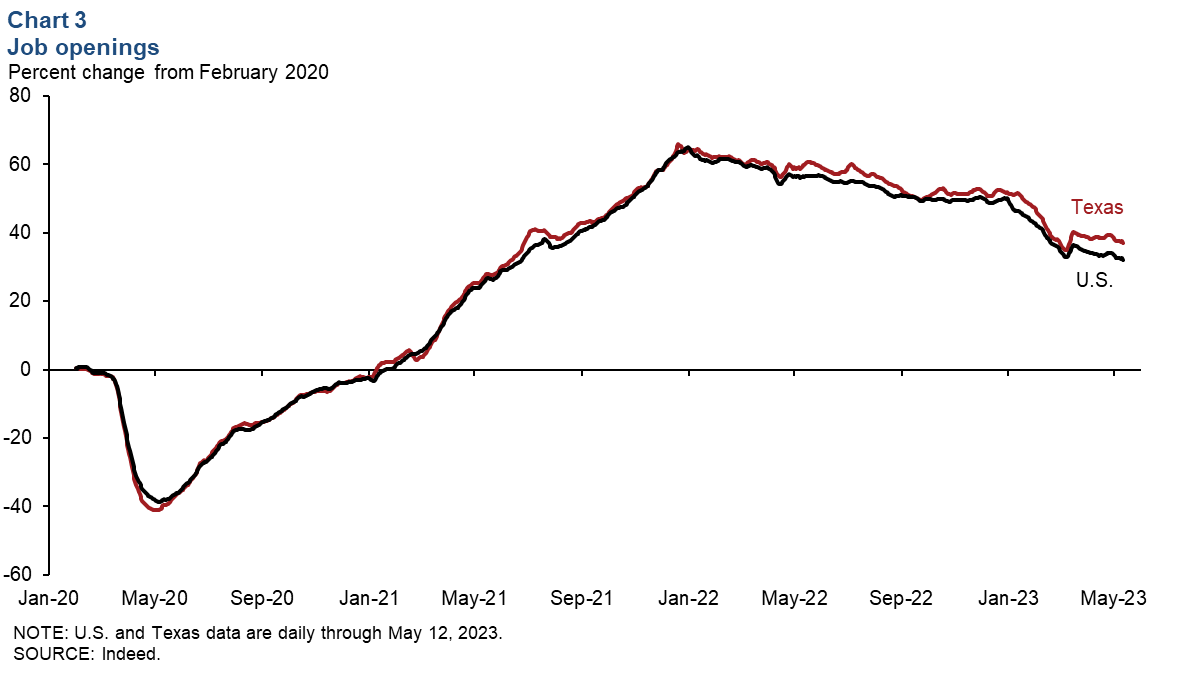
Job openings ease but remain high
Job openings in Texas dipped in early May but continued to outpace U.S. openings (Chart 3). Texas’ job openings edged down 1.3 percent from May 5 to May 12 but were 37.0 percent higher than February 2020 levels. Meanwhile, U.S. job openings fell 1.6 percent but were 32.1 percent higher than February 2020 levels.
Housing
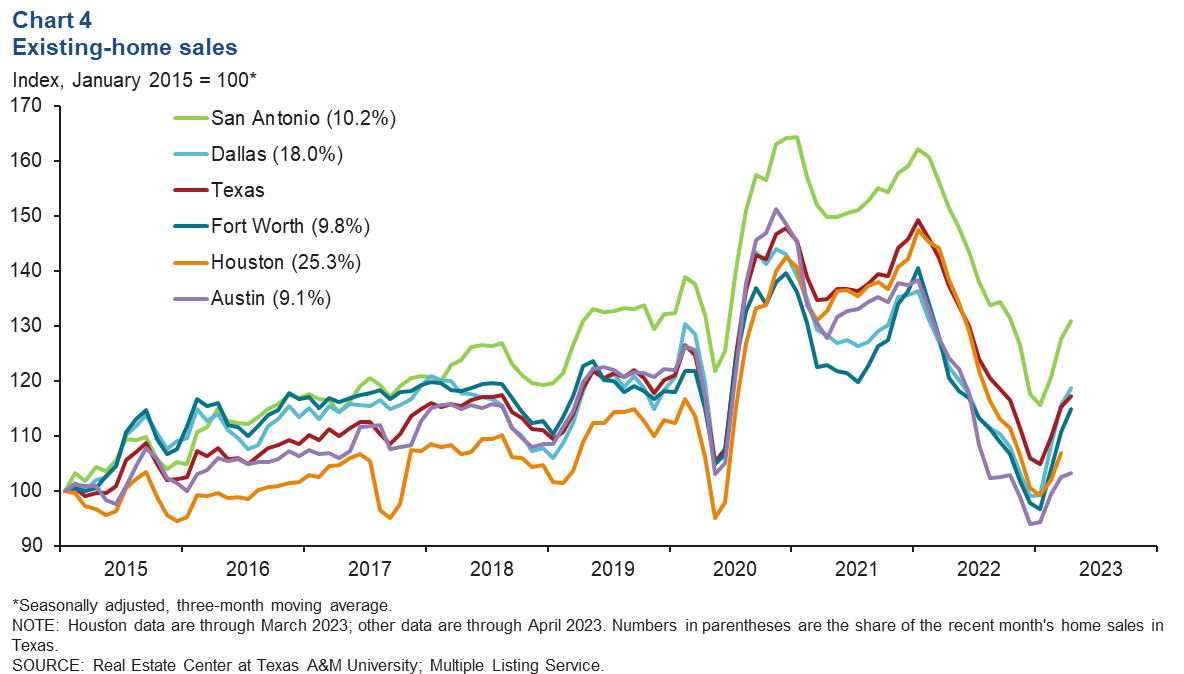
Existing-home sales stabilize
Texas existing-home sales fell slightly in April. Sales also declined in most major Texas metros. However, the three-month moving average of Texas existing-home sales rose 1.7 percent in April (Chart 4). On a smoothed basis (three-month moving average), sales rose in Fort Worth (3.8 percent), Dallas (2.8 percent), San Antonio (2.6 percent) and Austin (0.8 percent). Texas existing-home sales in April were 15.9 percent below year-ago levels.
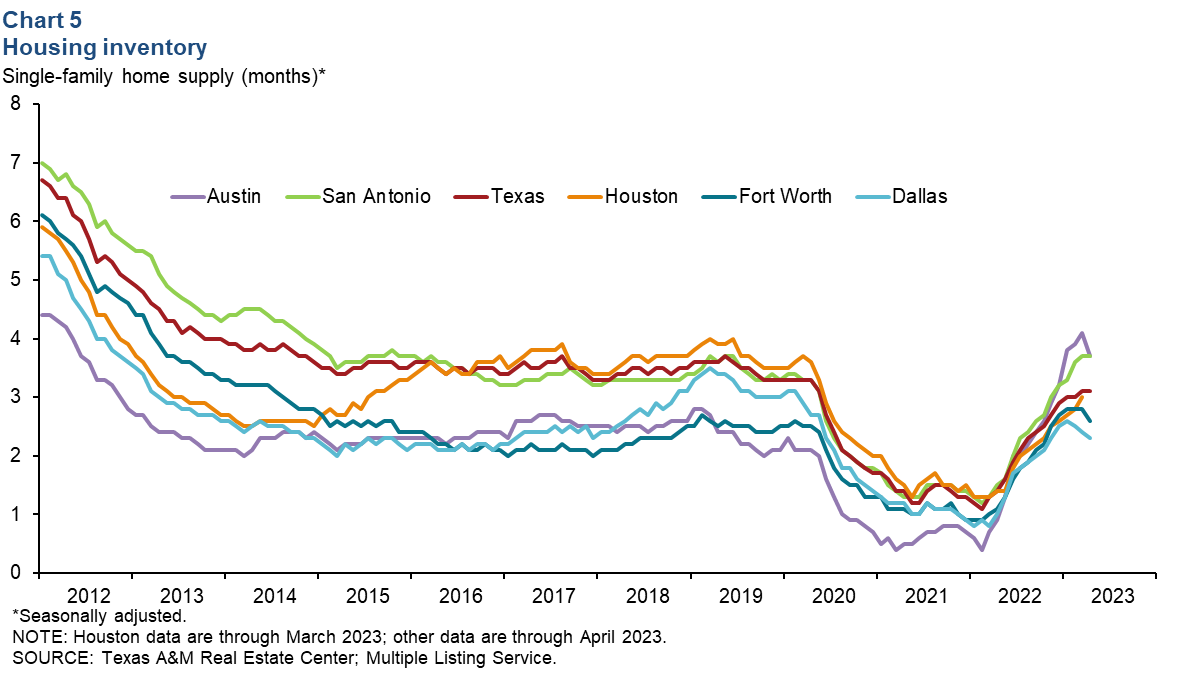
Housing inventories remain low
In April, housing supply was flat in Texas at 3.1 months and remained well below the six months considered a balanced market (Chart 5). Existing-home inventories were flat to down in most major Texas metros, with Austin showing the largest decline, now at 3.7 months of supply. Fort Worth and Dallas inventories ticked down to 2.6 months and 2.3 months, respectively. San Antonio’s inventory remained unchanged at 3.7 months.
Sales tax collections
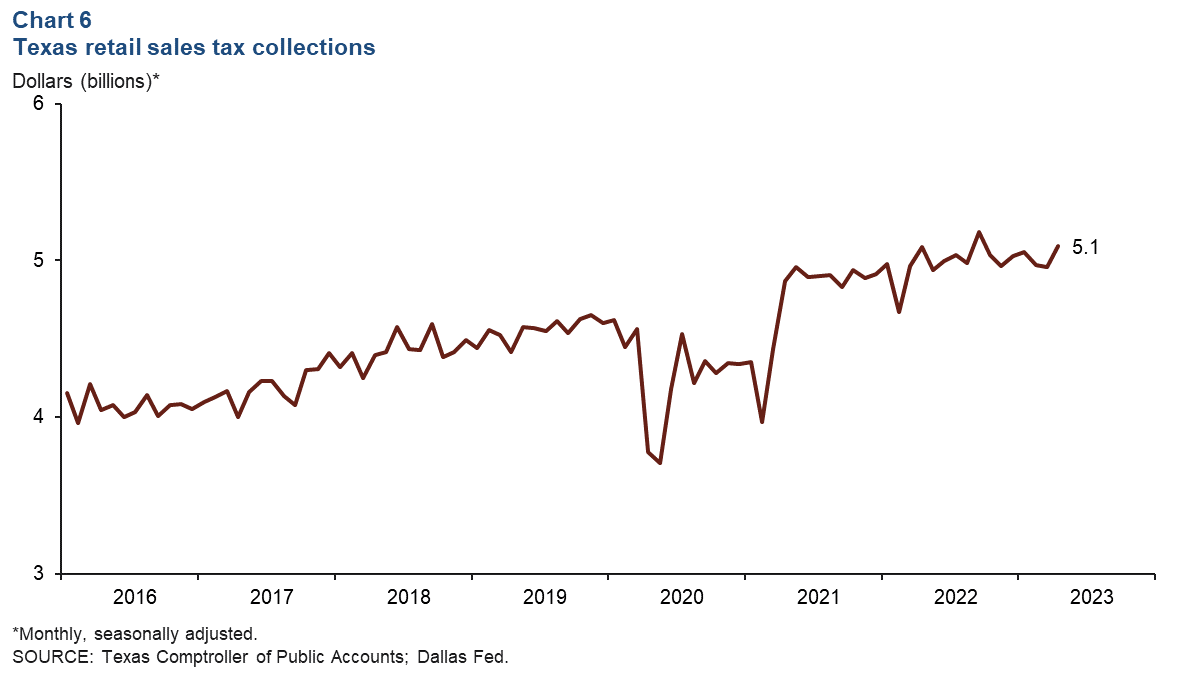
Texas retail sales tax collections increased in April to $5.1 billion (real dollars) following two months of decline (Chart 6). Statewide sales tax collection is 1.7 percent below its peak of $5.2 billion reached in September 2022 and on par with April 2022 levels.
NOTE: Data may not match previously published numbers due to revisions.
About Texas Economic Indicators
Questions or suggestions can be addressed to Mytiah Caldwell at Mytiah.Caldwell@dal.frb.org. Texas Economic Indicators is published every month during the week after state and metro employment data are released.