Texas Economic Indicators

September 14, 2023
| Texas economy dashboard (July 2023) | |||
| Job growth (annualized) April–July '23 |
Unemployment rate |
Avg. hourly earnings |
Avg. hourly earnings growth y/y |
| 2.9% | 4.1% | $31.88 | 6.5% |
The Texas economy expanded further in July. Employment grew in most sectors and major metros. The August Texas Business Outlook Surveys (TBOS) indicated that wage pressures increased in the manufacturing and service sectors. Existing-home sales and single-family permits fell in July. Construction contract values increased for the fourth straight month based on a five-month moving average, while Texas exports were little changed.
Labor market
Employment gains continue
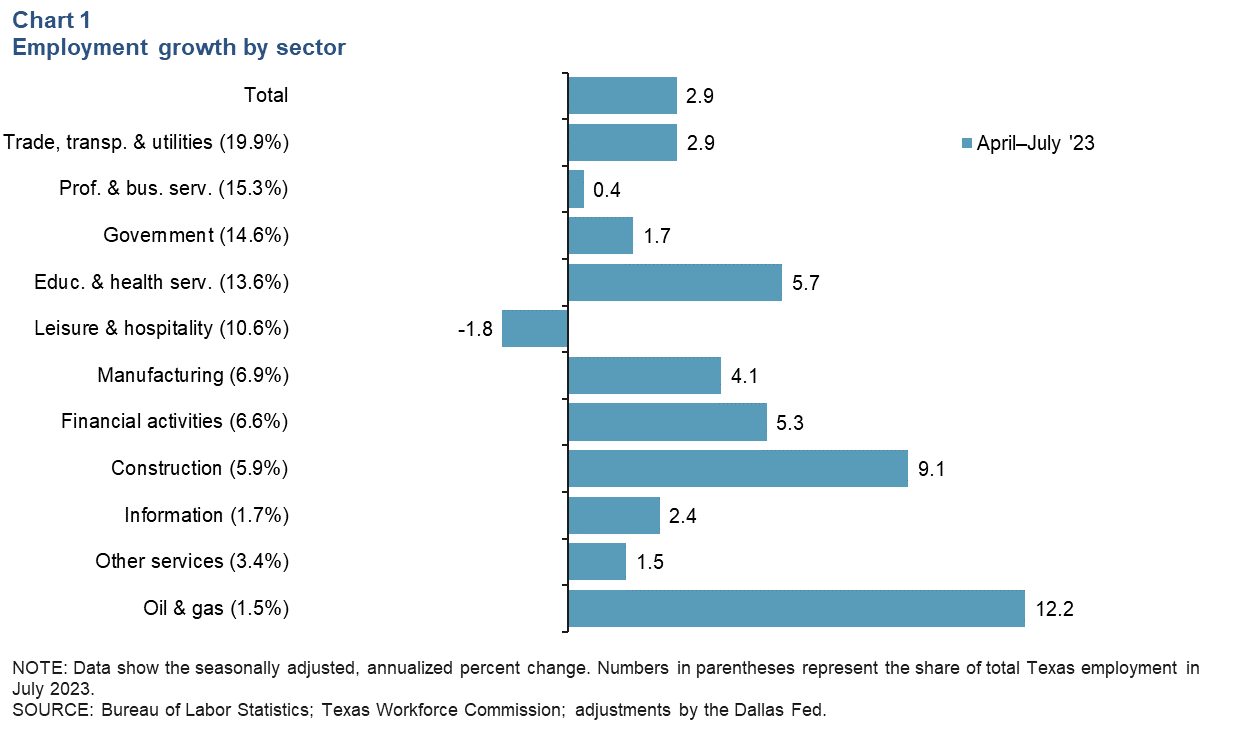
Texas employment expanded an annualized 3.0 percent in July, up from 2.5 percent in June. In the three months ending in July, job gains were an annualized 2.9 percent (99,000 jobs) (Chart 1). Job growth was broad based, with only declines seen in leisure and hospitality, primarily due to employment losses in amusement, gambling and recreation and in accommodation. Oil and gas employment gains outpaced increases in other sectors at 12.2 percent. Year to date through July, Texas employment has increased an annualized 3.7 percent. The Dallas Fed’s Texas Employment Forecast released Aug. 18 forecasts 3.0 percent job growth this year (December/December)—up from its previous estimate of 2.5 percent.
Job growth broad based across major metros
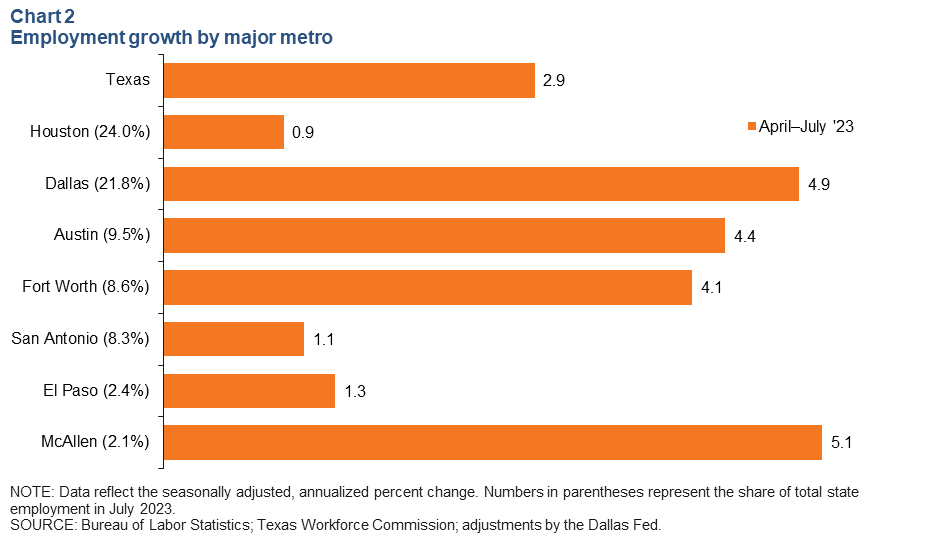
Employment rose in all major Texas metros in the three months ending in July (Chart 2). McAllen took the lead with an annualized job growth of 5.1 percent, closely followed by Dallas’ increase of 4.9 percent. Payrolls in Houston and San Antonio grew a modest 1 percent during the period, slower than the state’s 2.9 percent increase.
Texas Business Outlook Surveys
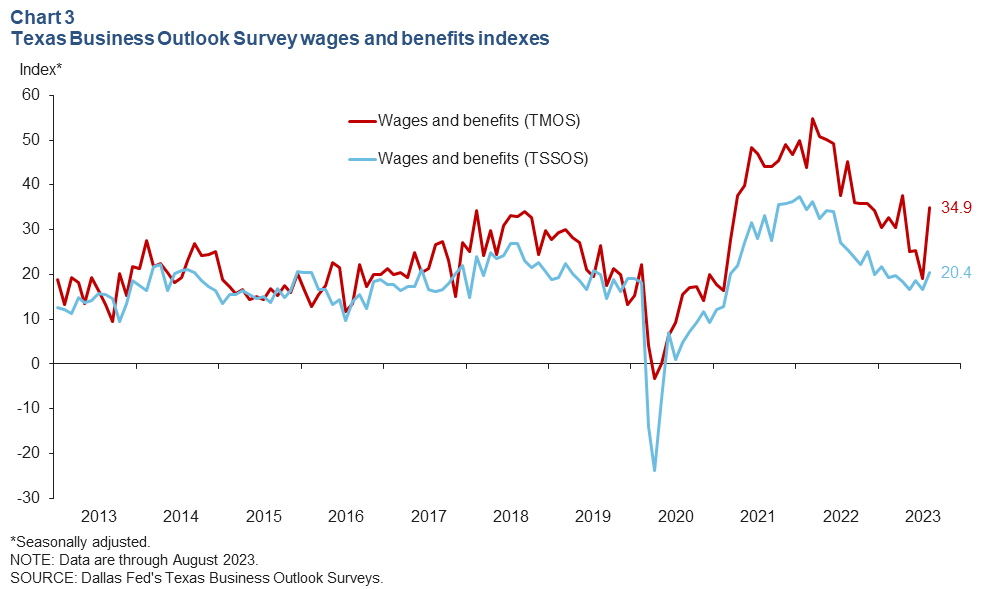
The Texas Business Outlook Surveys indicated that wage growth increased in August after a period of easing (Chart 3). The manufacturing survey’s wages and benefits index shot up 16 points to 34.9, pushing past its average reading of 21.1. The service sector’s wage and benefits index also rose, to 20.4—its highest level since January and above its average reading of 15.8.
Exports
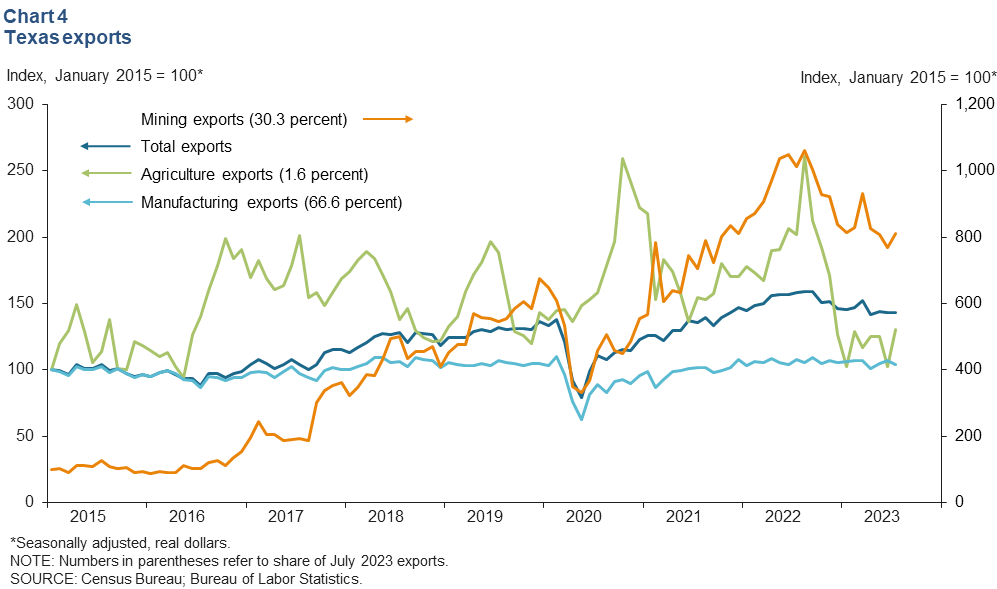
Inflation-adjusted Texas exports were little changed in July (Chart 4). Mining and agricultural exports increased, while manufacturing exports—accounting for the majority of the state’s exports—fell. Through July, total Texas exports were 5.2 percent below the corresponding period in 2022. U.S. exports fell 1.9 percent in July from June.
Housing
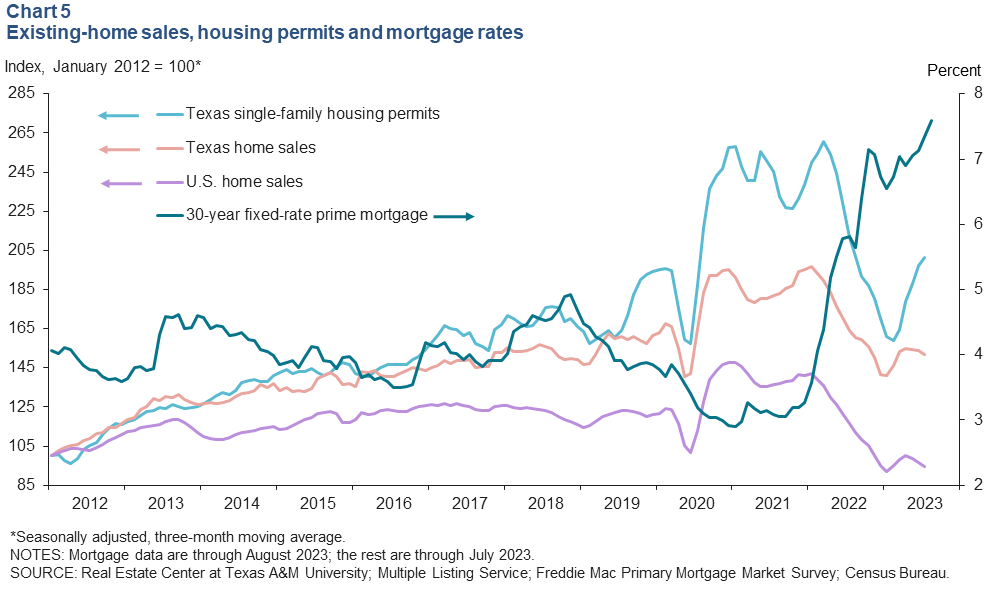
Texas existing-home sales fell by 5.0 percent month over month in July amid low home inventories, resulting in 27,000 total sales (Chart 5). The three-month moving average declined as well. U.S. home sales dropped 2.2 percent in July. High mortgage rates persisted, averaging 7.3 percent in July and 7.6 percent in August, and continued to impact housing affordability. Texas single-family housing construction permits dipped 1.2 percent after increasing for five straight months. However, the three-month moving average continued to tick up in July.
Construction
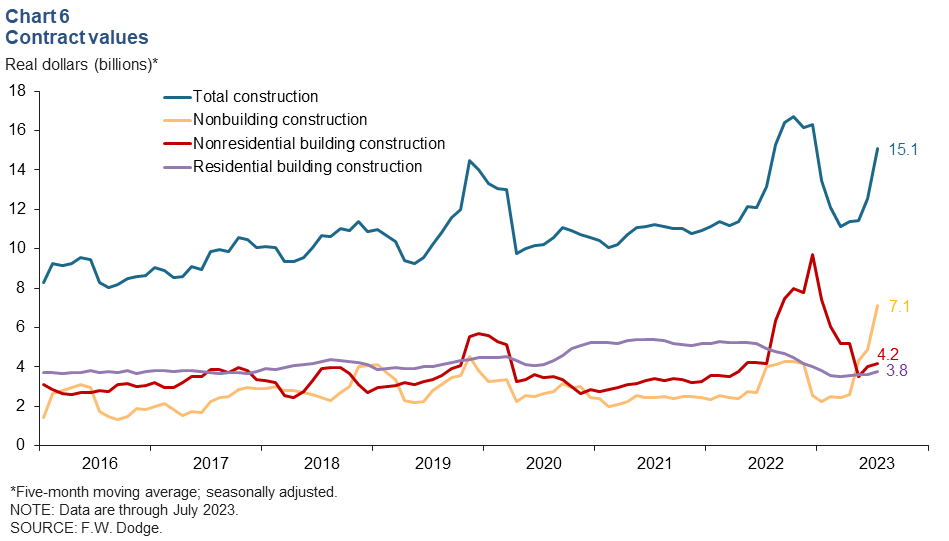
Construction contract values increased sharply in July, pushing up the five-month moving average to $15.1 billion (Chart 6). Based on a five-month moving average, nonbuilding and residential building construction values increased for the fourth consecutive month—reaching $7.1 billion and $3.8 billion, respectively. Following a five-month decline, nonresidential values rose for a second straight month, increasing to $4.2 billion. Year to date through July, total construction contract values were up 3.8 percent compared with the same period in 2022.
NOTE: Data may not match previously published numbers due to revisions.
About Texas Economic Indicators
Questions or suggestions can be addressed to Diego Morales-Burnett at diego.morales-burnett@dal.frb.org. Texas Economic Indicators is published every month during the week after state and metro employment data are released.