Texas Economic Indicators

September 27, 2023
| Texas economy dashboard (August 2023) | |||
| Job growth (annualized) May–Aug. '23 |
Unemployment rate |
Avg. hourly earnings |
Avg. hourly earnings growth y/y |
| 2.0% | 4.1% | $31.45 | 5.2% |
Texas economic expansion slowed in August. Employment growth moderated, and unemployment remained flat. The September Texas Business Outlook Surveys (TBOS) indicated service sector activity rose at a slower pace, and manufacturing output rebounded. The Texas rig count and oil prices increased in mid-September. Median home prices were little changed in August.
Labor market
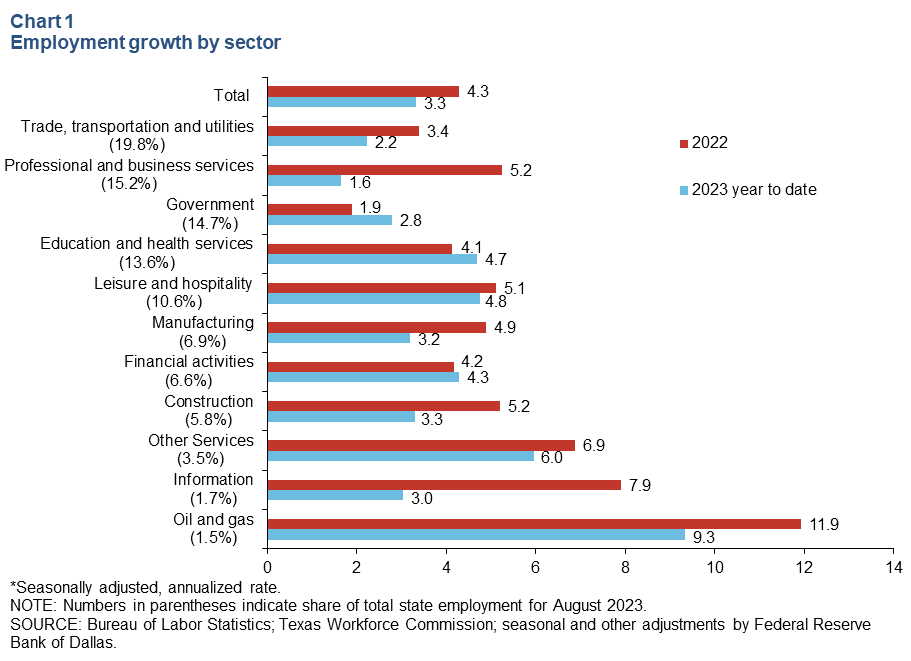
Job gains continue at a slower rate
Texas employment expanded 1.1 percent in August, and July growth was revised down to 2.5 percent. Year to date through August, Texas payrolls grew an annualized 3.3 percent, which is slower than last year’s pace of 4.3 percent (Chart 1). Job gains this year have been across sectors, but gains are weaker relative to 2022 in nearly all sectors except for government and education and health services. The slower pace is most pronounced in professional and business services, followed by information services, construction and manufacturing. The Dallas Fed’s Texas Employment Forecast, released Sept. 15, forecasts 2.9 percent job growth this year, down slightly from the previous estimate of 3.0 percent.
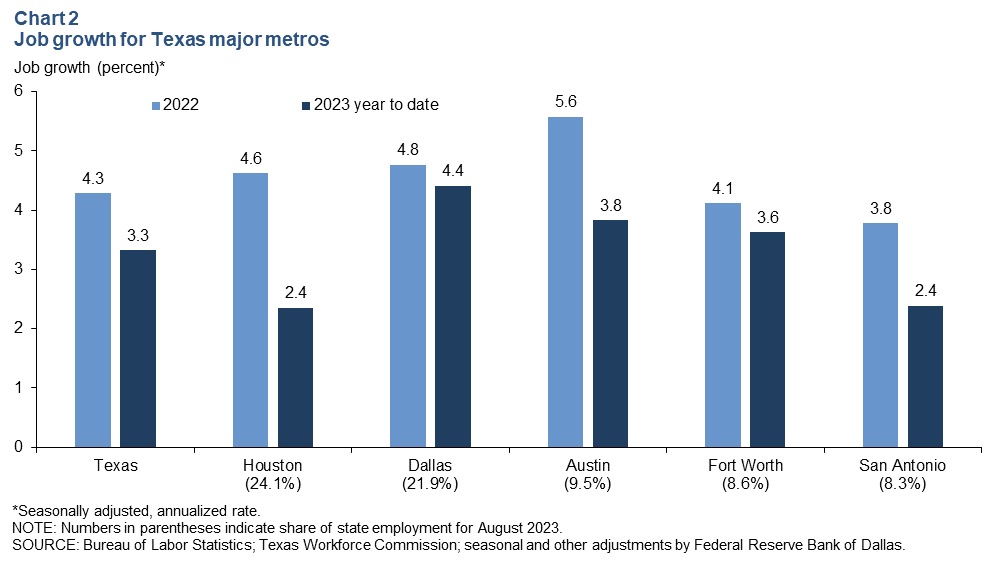
Dallas leads major metros in year-to-date job growth
Employment growth in August was mixed across Texas major metros. Dallas and Houston posted strong gains. August job growth was modest in Fort Worth and San Antonio, while payrolls contracted in Austin, El Paso and McAllen. Year to date, Dallas leads with annualized job growth of 4.4 percent, followed by Austin at 3.8 percent growth and Fort Worth’s increase of 3.6 percent. San Antonio and Houston both saw job gains of 2.4 percent, below the state’s 3.3 percent increase (Chart 2).
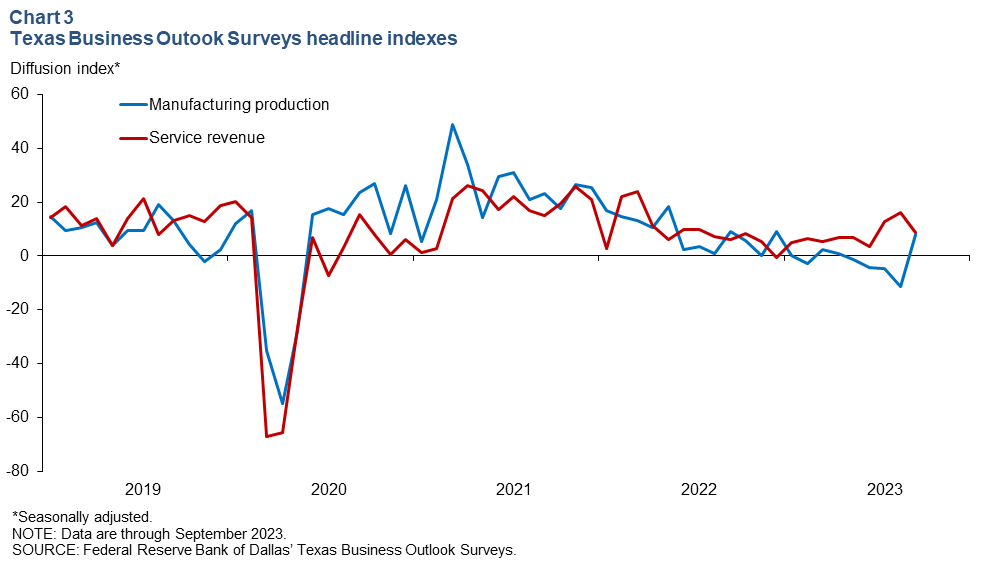
Texas Business Outlook Surveys
The September Texas Business Outlook Surveys reported a strong rebound in manufacturing output and continued moderate growth in the service sector (Chart 3). The manufacturing production index surged into positive territory after negative readings for four months in a row. The service sector revenue index dipped but remained positive and close to its 10-year average, suggestive of ongoing expansion in service sector activity.
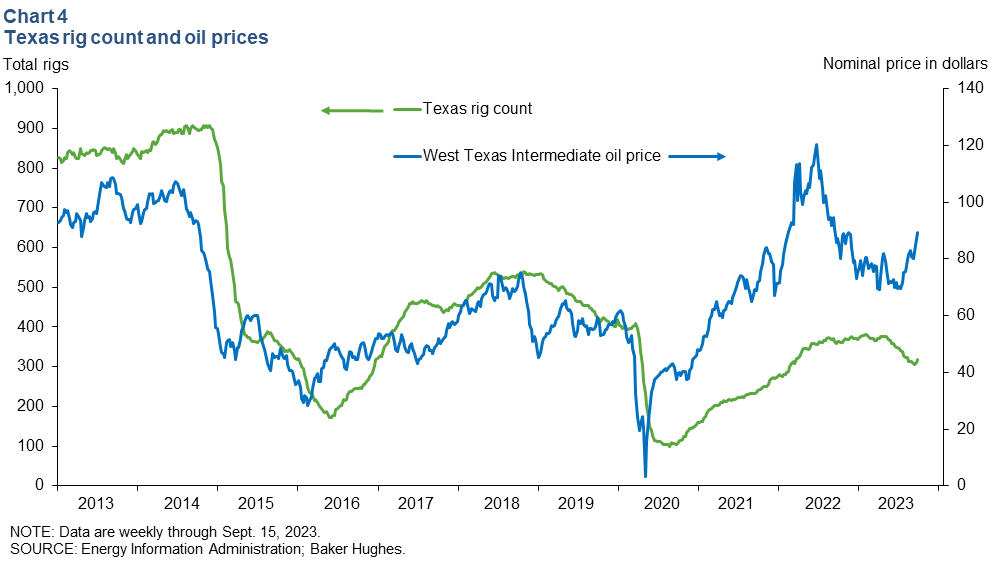
Energy
The Texas rig count ticked up, and oil prices rose in mid-September (Chart 4). As of the week ending September 15, the Texas rig count rose by seven to 317, and the West Texas Intermediate oil price rose for the third straight week to $89.14.
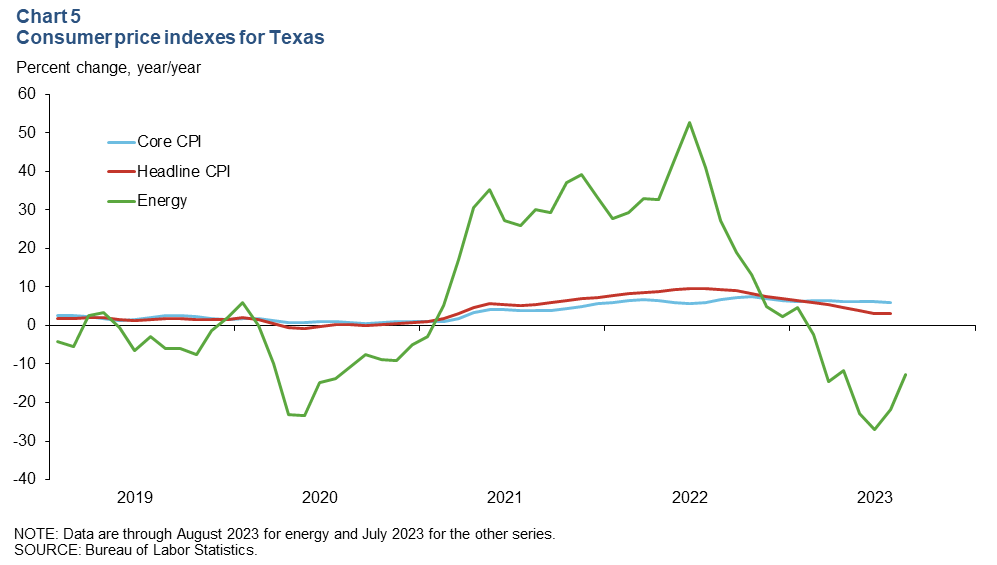
Consumer prices
Inflation remained elevated, though it has trended down since peaking in mid-2022. The 12-month change in the Texas headline Consumer Price Index (CPI) was 3.0 percent in July (Chart 5). Core CPI, which excludes food and energy, moderated to 5.8 percent over the same period. In August, energy prices were down 12.6 percent year over year.
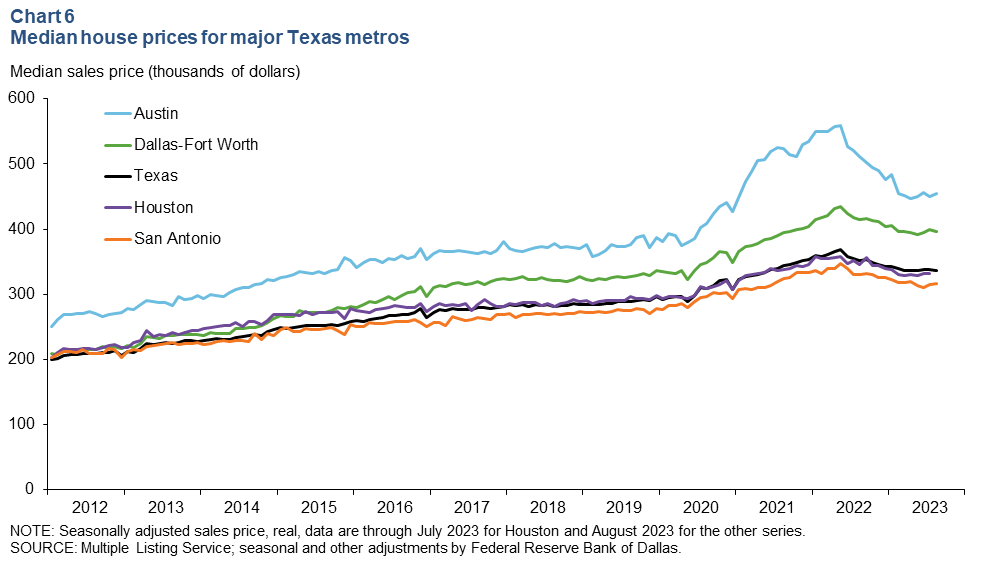
Housing
Median house prices ticked up in Austin and San Antonio in August, while remaining flat in other Texas major metros as well as the state. Across Texas, home prices have been flat to down since peaking in early 2022. As of August 2023, the Texas median house price was around $337,000, little changed from year-ago levels (Chart 6).
NOTE: Data may not match previously published numbers due to revisions.
About Texas Economic Indicators
Questions or suggestions can be addressed to Diego Morales-Burnett at diego.morales-burnett@dal.frb.org. Texas Economic Indicators is published every month during the week after state and metro employment data are released.