Texas Economic Indicators

October 25, 2023
| Texas economy dashboard (September 2023) | |||
| Job growth (annualized) June–Sept. '23 |
Unemployment rate |
Avg. hourly earnings |
Avg. hourly earnings growth y/y |
| 3.0% | 4.1% | $32.03 | 6.5% |
The Texas economy expanded further in September. Employment grew strongly, and unemployment remained flat. The September Texas Business Outlook Surveys (TBOS) reported continued widespread wage pressures. Construction contract values fell in August, however, the smoothed indexes ticked up. Texas housing inventories ticked up but remained below average in September.
Labor market
Job gains accelerate in September
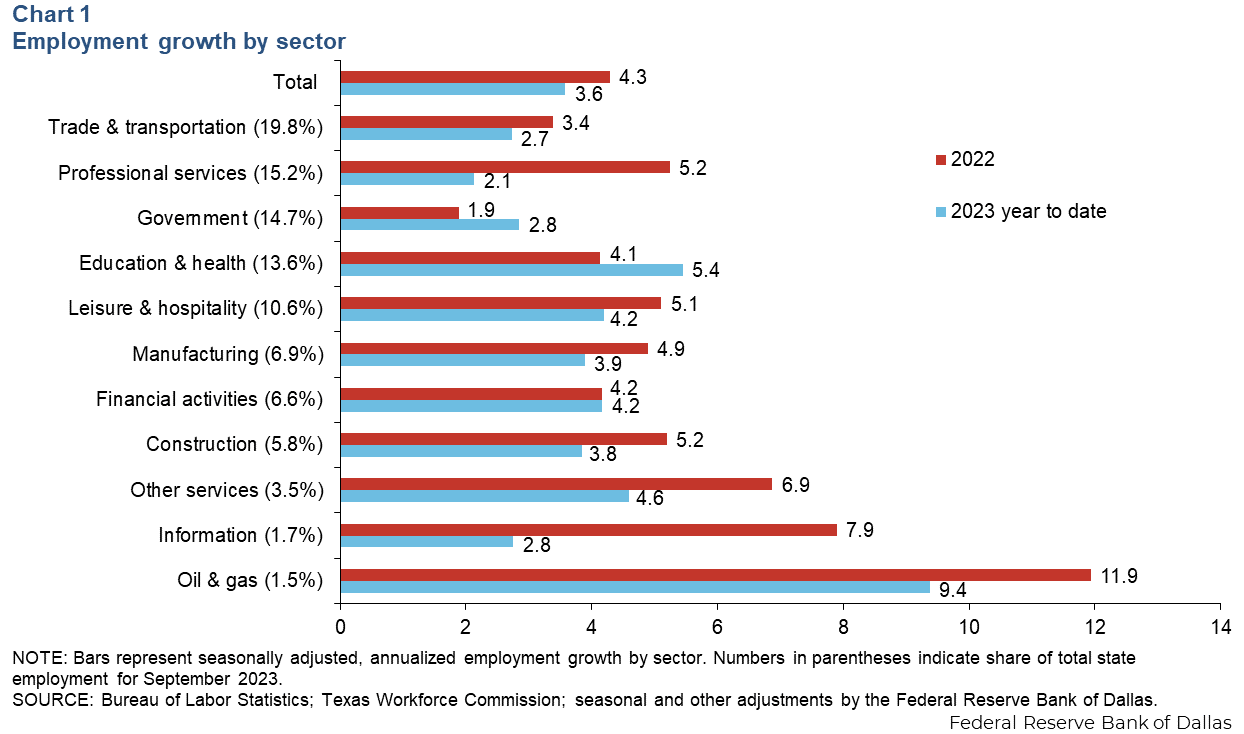
Texas employment expanded a strong 5.4 percent in September, and August growth was revised up to 1.3 percent. Year to date through September, Texas payrolls grew an annualized 3.6 percent, which is slower than last year’s pace of 4.3 percent (Chart 1 ). Job gains this year have been widespread, but growth is weaker relative to 2022 in nearly all sectors except for government, education and health services, and financial activities. The Dallas Fed’s Texas Employment Forecast, released Oct. 20, forecasts 3.3 percent job growth this year, up from the previous estimate of 2.9 percent.
Unemployment rate holds steady
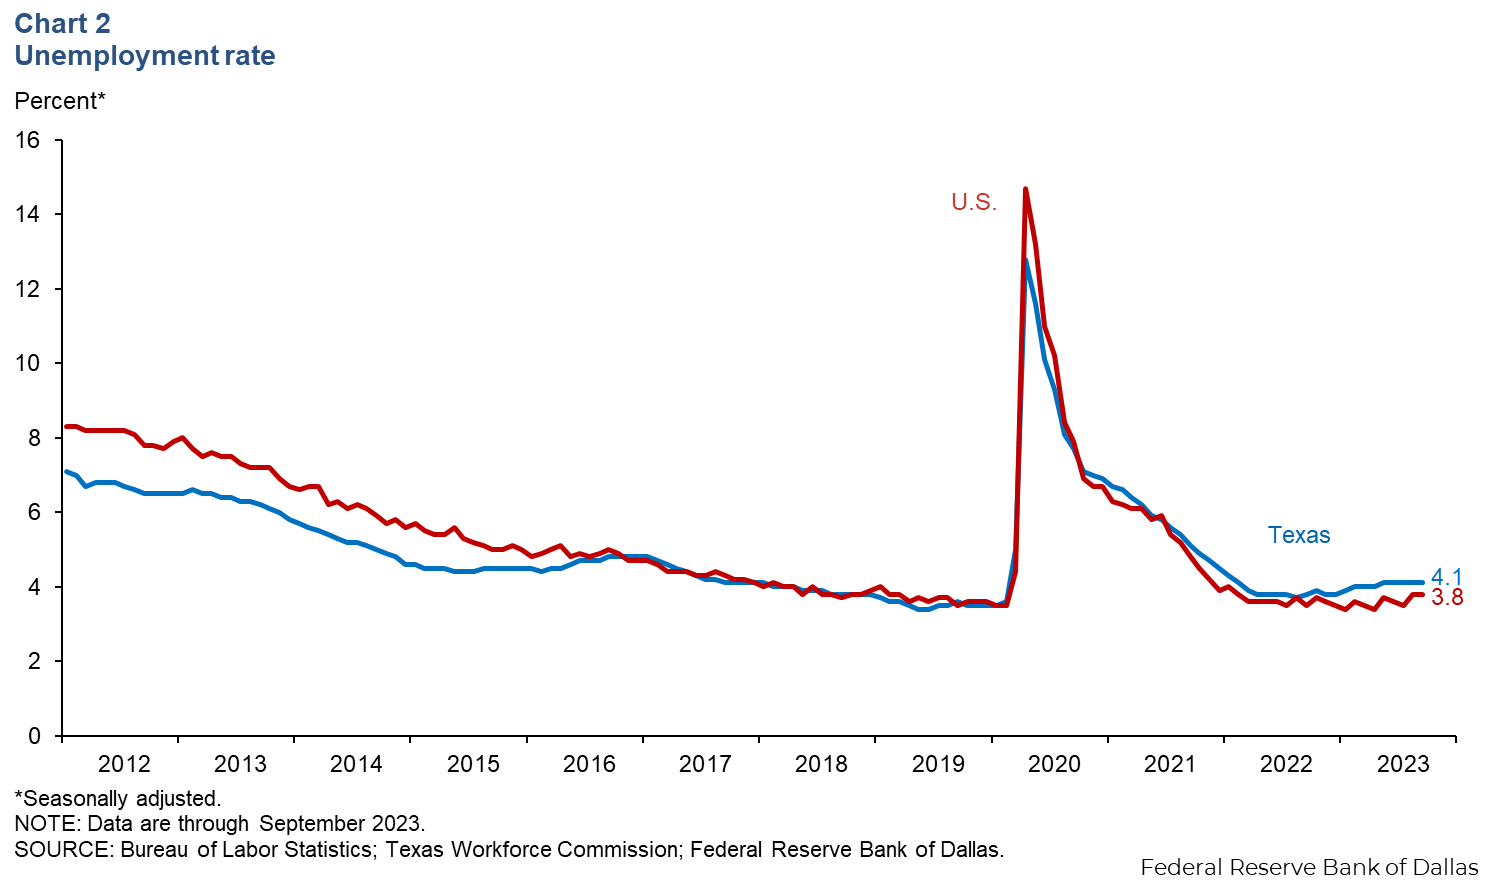
The Texas unemployment rate was 4.1 percent in September for a second month, and the U.S. jobless rate also remained unchanged at 3.8 percent (Chart 2). In September, the unemployment rate in Texas was 3.4 percent for whites, 4.2 percent for Hispanics and 4.1 percent for Blacks. Texas’ labor force growth continued in September, expanding an annualized 2.4 percent (30,000 people). Meanwhile, the U.S. labor force rose an annualized 0.6 percent.
Private earnings increase
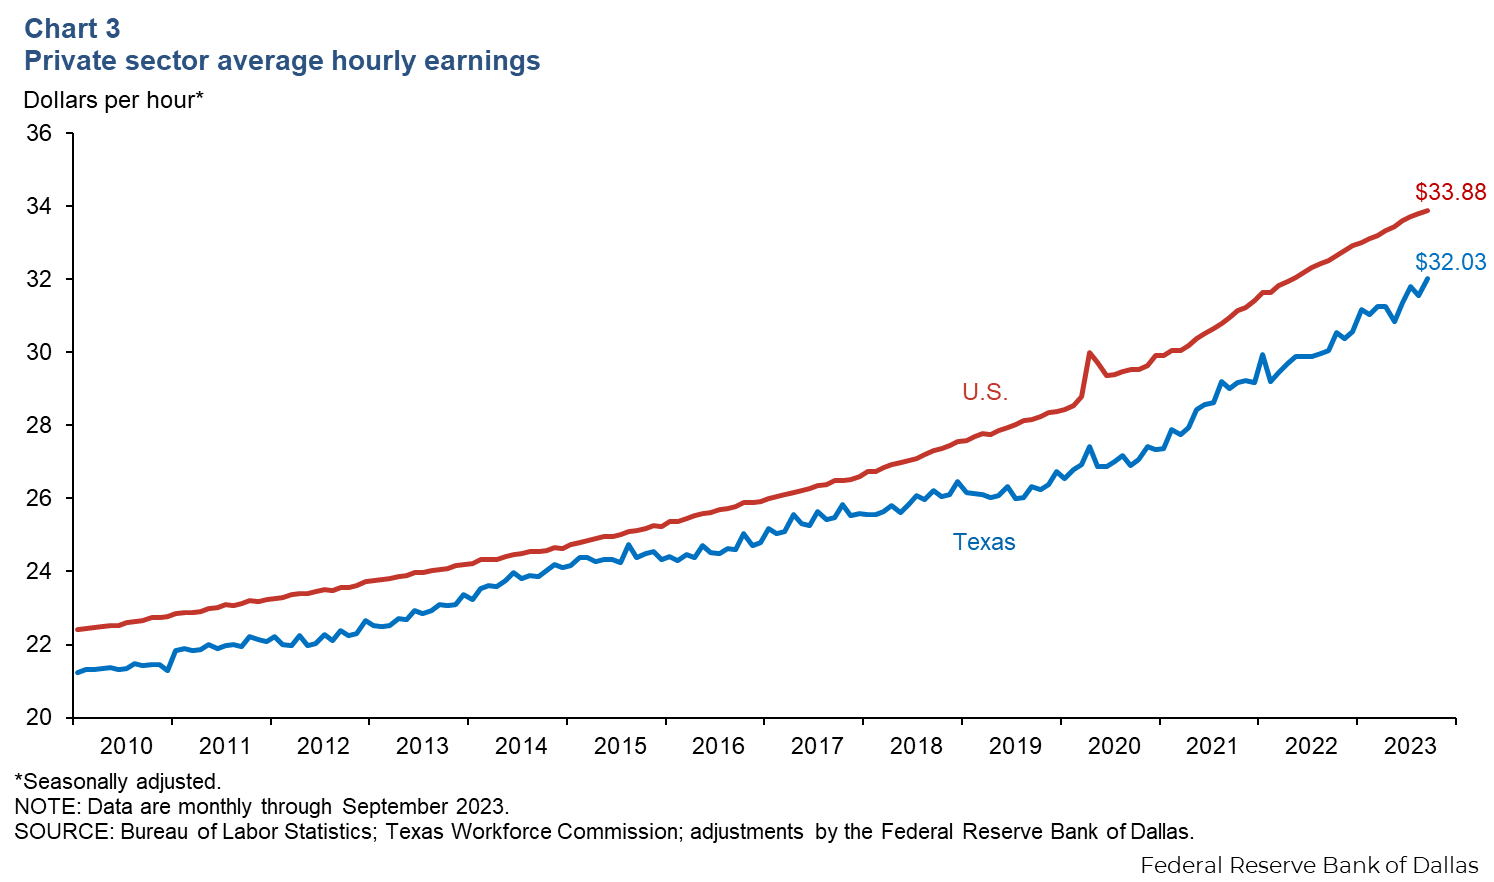
Texas private hourly earnings increased 1.5 percent to $32.03 in September (Chart 3). Meanwhile, private hourly earnings in the U.S. rose 0.2 percent to $33.88. Year over year, Texas’ wages were up 6.5 percent, outpacing the nation’s 4.2 percent increase.
Texas Business Outlook Surveys
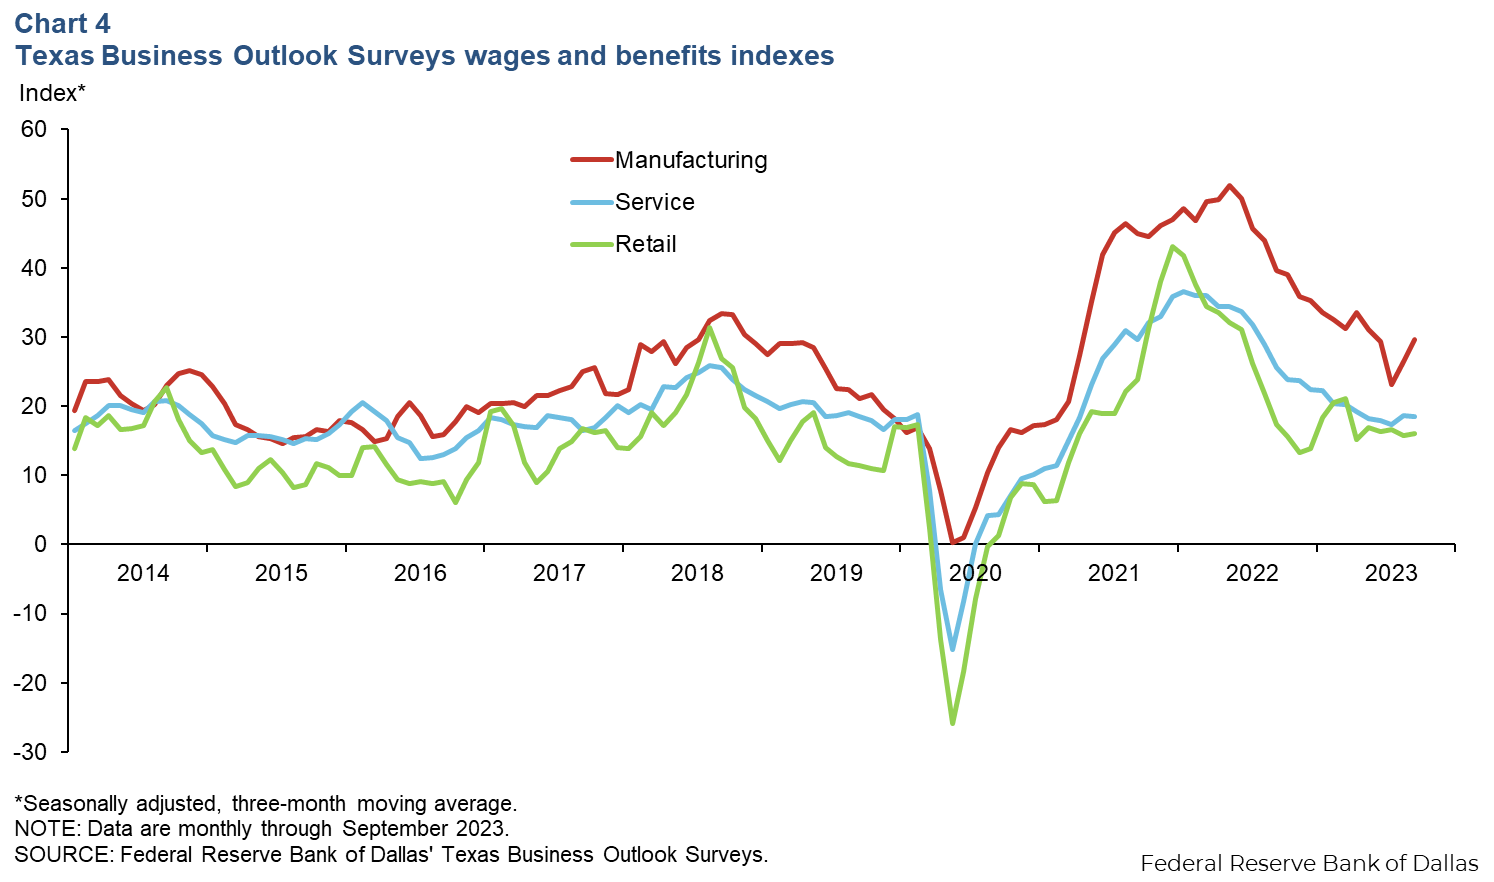
The Texas Business Outlook Surveys reported a pickup in manufacturing wage growth (Chart 4). In September, the three-month moving average of the manufacturing wages and benefits index increased three points to 29.6. The three-month moving average of the service and retail sectors’ wages and benefits indexes were little changed at 18.5 and 16.0, respectively, indicative of continued growth. The wages and benefits indexes for all three sectors remained above their historical averages, suggesting elevated wage pressures.
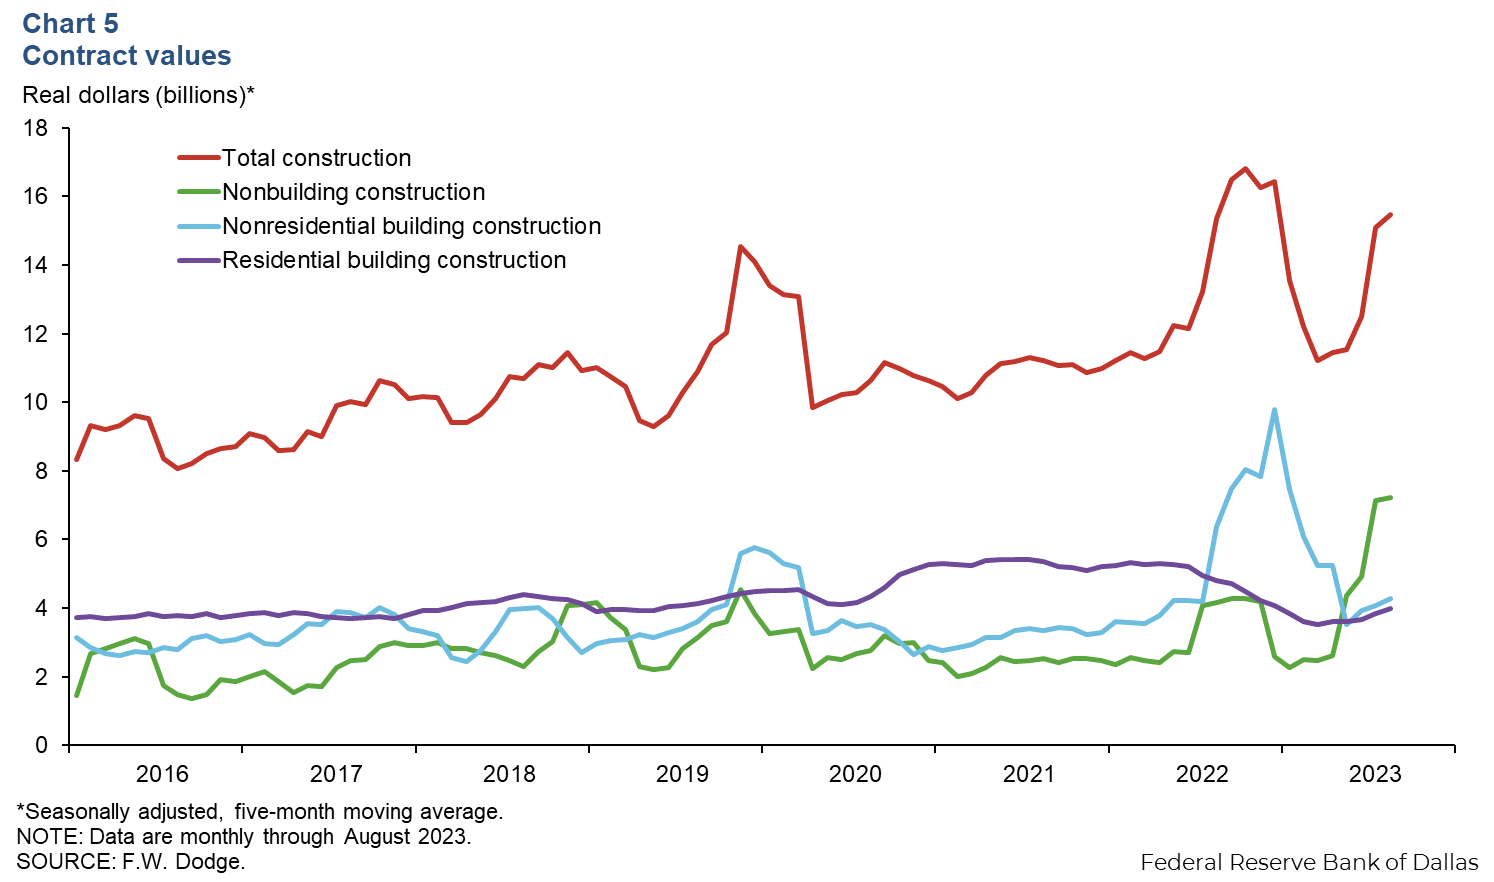
Construction
Construction contract values fell 45.7 percent in August, while the five-month moving average edged up 2.7 percent (Chart 5). The decline was concentrated in nonbuilding contract values, which dropped 77.3 percent in August but were up 1.1 percent based on the five-month moving average. On a smoothed basis, nonresidential building construction edged up 4.6 percent to $4.3 billion, and residential building construction rose 3.6 percent to $4.0 billion.
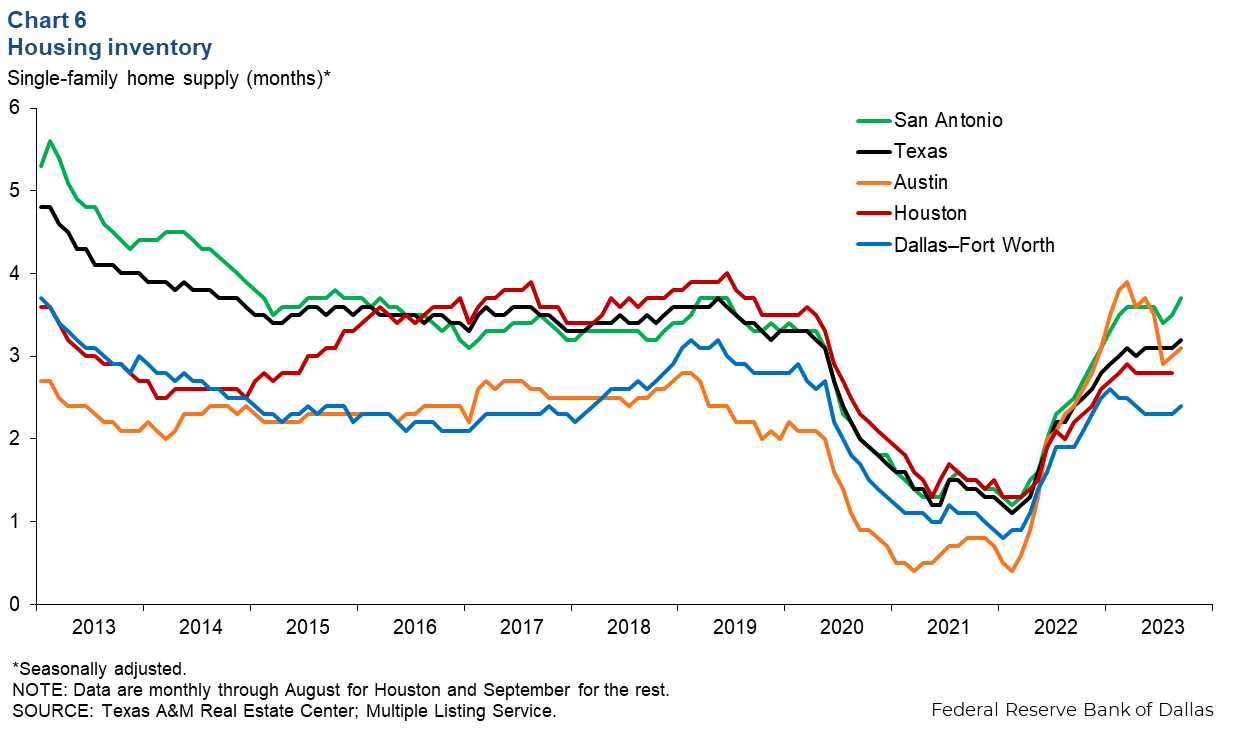
Housing
In September, Texas housing inventories were 3.2 months, remaining well below the six months considered a balanced market (Chart 6). Existing-home inventories rose, with Austin ticking up to 3.1 months, Dallas–Fort Worth to 2.4 months and San Antonio 3.7 to months. Houston’s months of supply held steady at 2.8 months in August.
NOTE: Data may not match previously published numbers due to revisions.
About Texas Economic Indicators
Questions or suggestions can be addressed to Diego Morales-Burnett at diego.morales-burnett@dal.frb.org. Texas Economic Indicators is published every month during the week after state and metro employment data are released.