Texas Economic Indicators

November 27, 2023
| Texas economy dashboard (October 2023) | |||
| Job growth (annualized) July–Oct. '23 |
Unemployment rate |
Avg. hourly earnings |
Avg. hourly earnings growth y/y |
| 2.7% | 4.1% | $32.07 | 5.2% |
The Texas economy expanded at a slower pace in October. Employment grew modestly, while unemployment remained flat. The October Texas Business Outlook Surveys (TBOS) reflected slower output growth in manufacturing and flat activity in the service sector. Existing-home sales fell amid low inventory and high mortgage rates. In September, Texas exports grew slightly while outpacing the nation. Sales tax revenue declined but remained elevated in October.
Labor market
Job gains slow in October
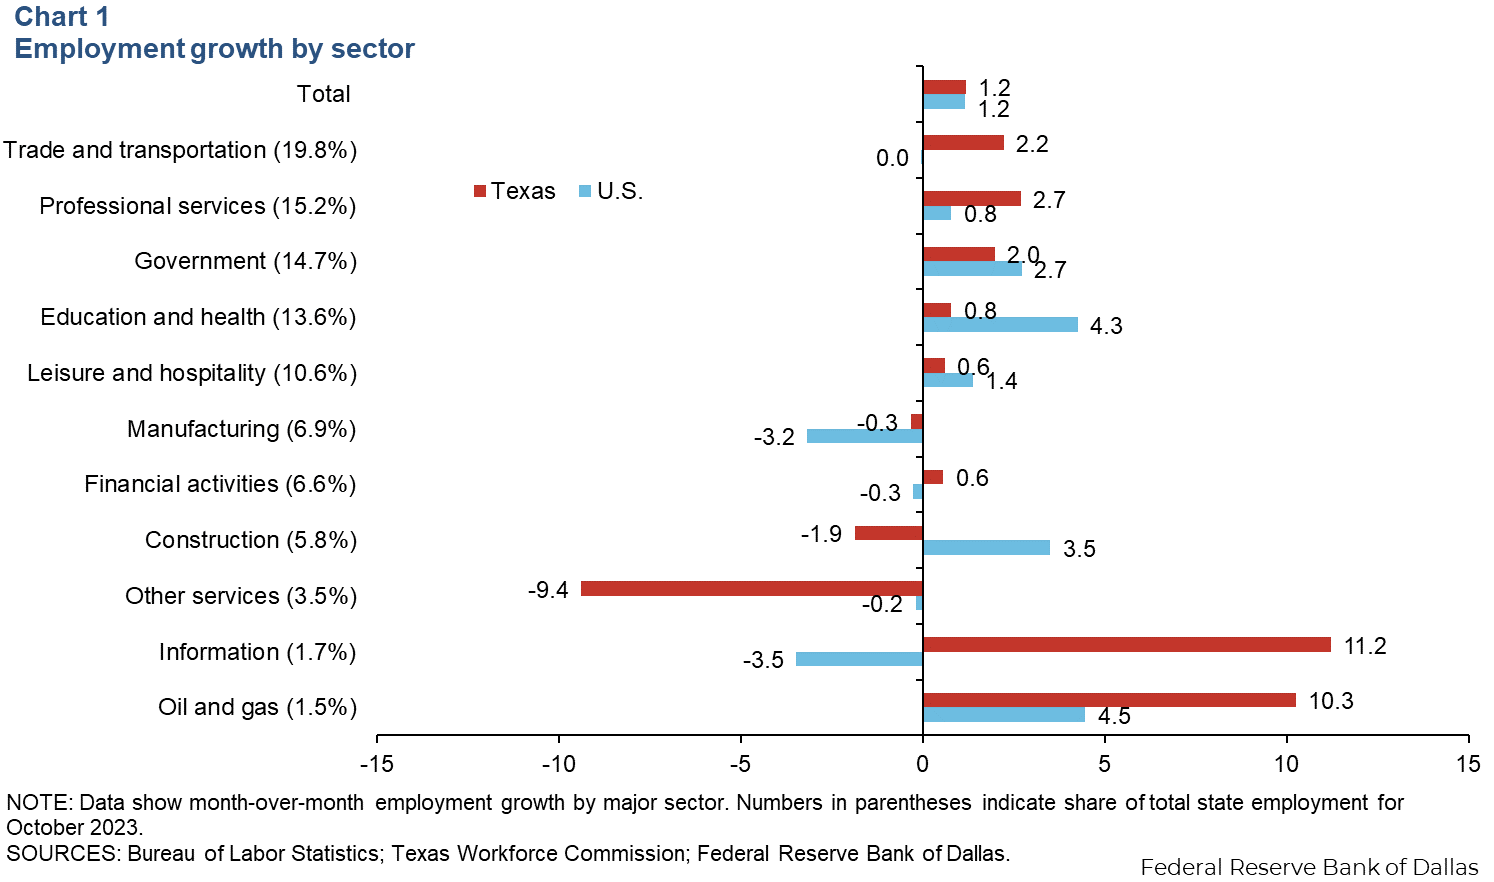
Texas employment expanded 1.2 percent in October (Chart 1). September growth was revised up to 5.8 percent. Year to date through October, Texas payrolls grew an annualized 3.4 percent. Job gains in October were mixed, led by growth in information services and oil and gas sectors. Payrolls were flat to down in construction, manufacturing and other services. The Dallas Fed’s Texas Employment Forecast, released Nov. 17, forecasts 3.2 percent job growth this year, slightly down from the previous estimate of 3.3 percent.
New unemployment claims rise
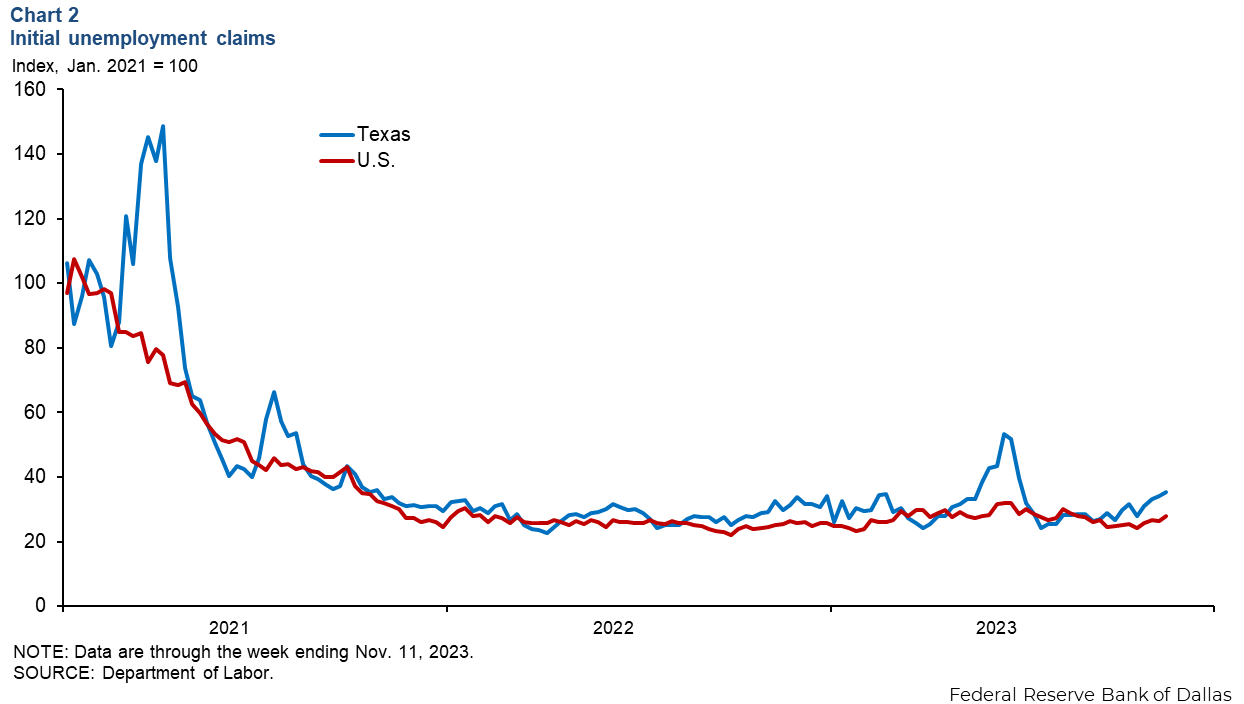
Weekly initial unemployment claims increased in Texas as well as the nation in mid-November (Chart 2). While remaining significantly below Jan. 2021 levels, new Texas unemployment claims trended up to 17,955, the highest level since late June 2023. U.S. initial unemployment claims likewise trended up, at a slower pace, to 233,000, the highest level since mid-August 2023. The Texas unemployment rate has held steady at 4.1 percent since May, while the U.S. unemployment rate was 3.9 in October.
Texas Business Outlook Surveys
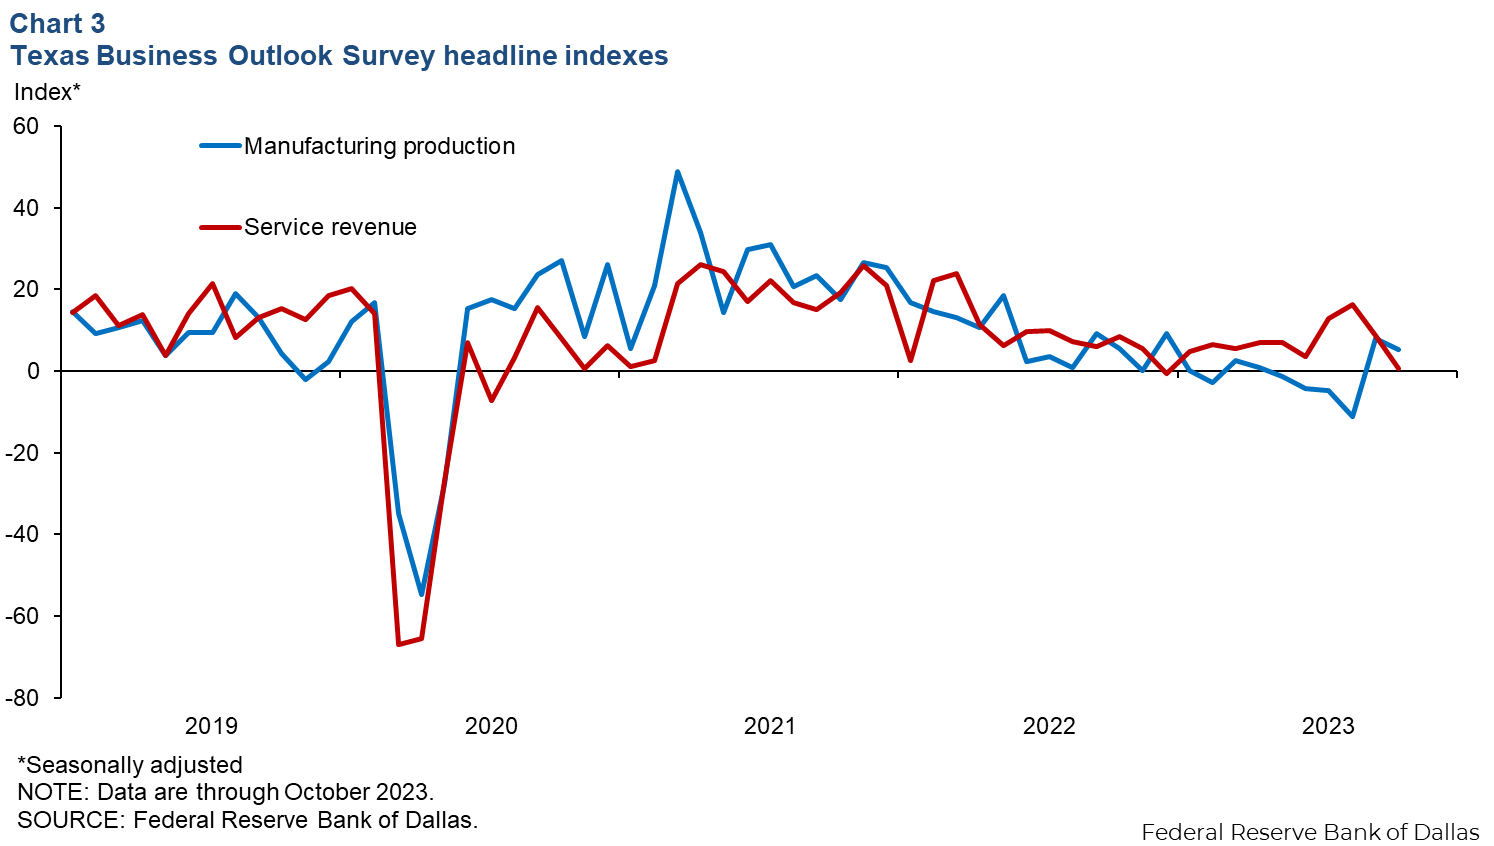
The October Texas Business Outlook Surveys reported modest growth in manufacturing output but flat activity in the service sector activity (Chart 3). Both indexes were below their 10-year averages, and outlook for both sectors remained pessimistic.
Housing
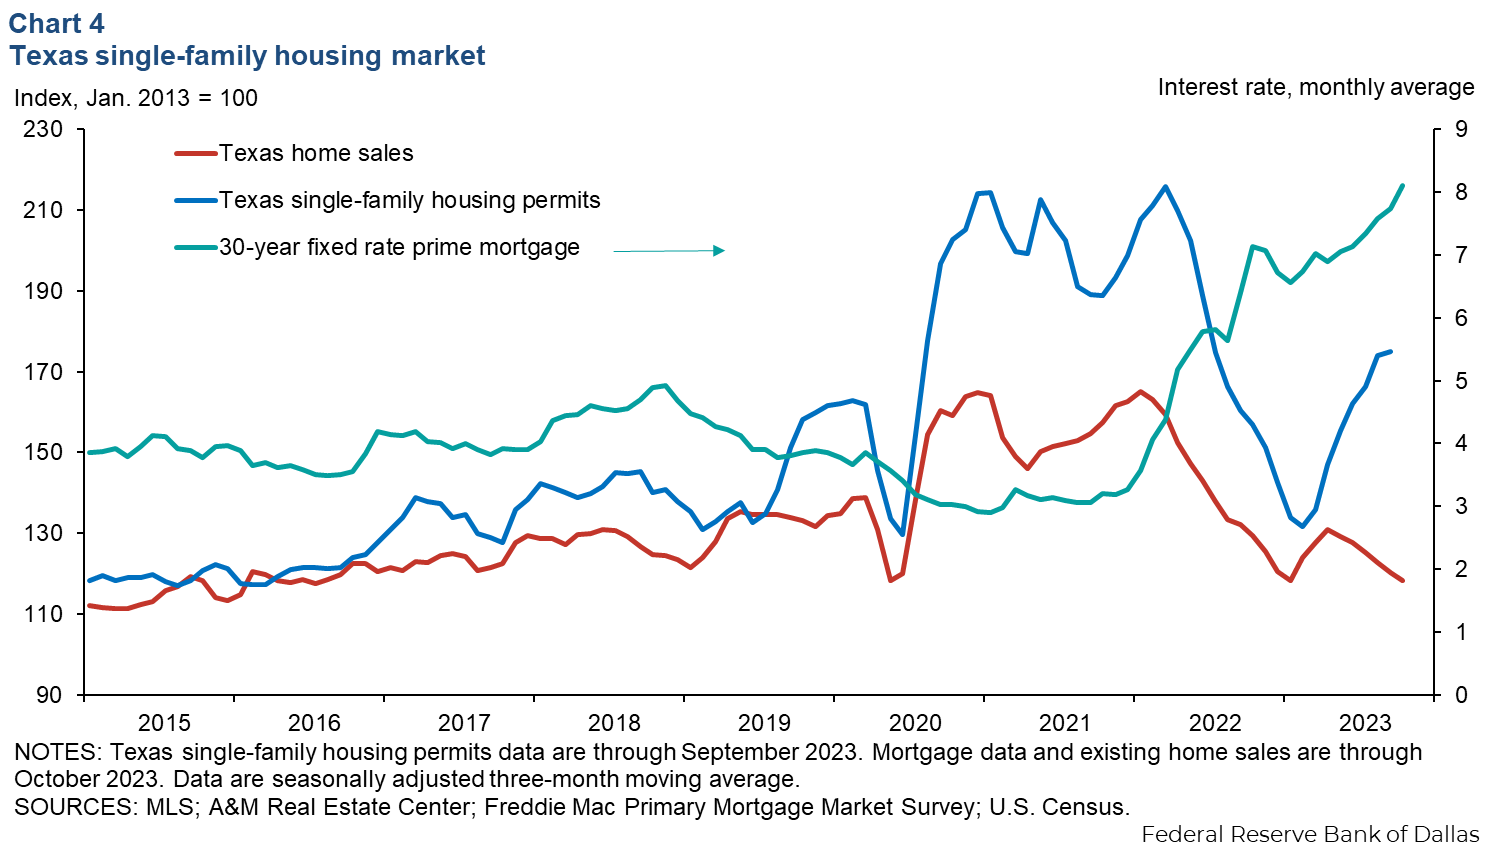
In October, Texas existing-home sales fell 1.6 percent month over month amid modest home inventory and high mortgage rates, with 26,000 sales (Chart 4). High mortgage rates persisted, averaging 8.11 percent in October, and continued to impact housing affordability. The three-month moving average of Texas single-family housing construction permits has increased over the past seven months, and growth in October slowed to 0.5 percent.
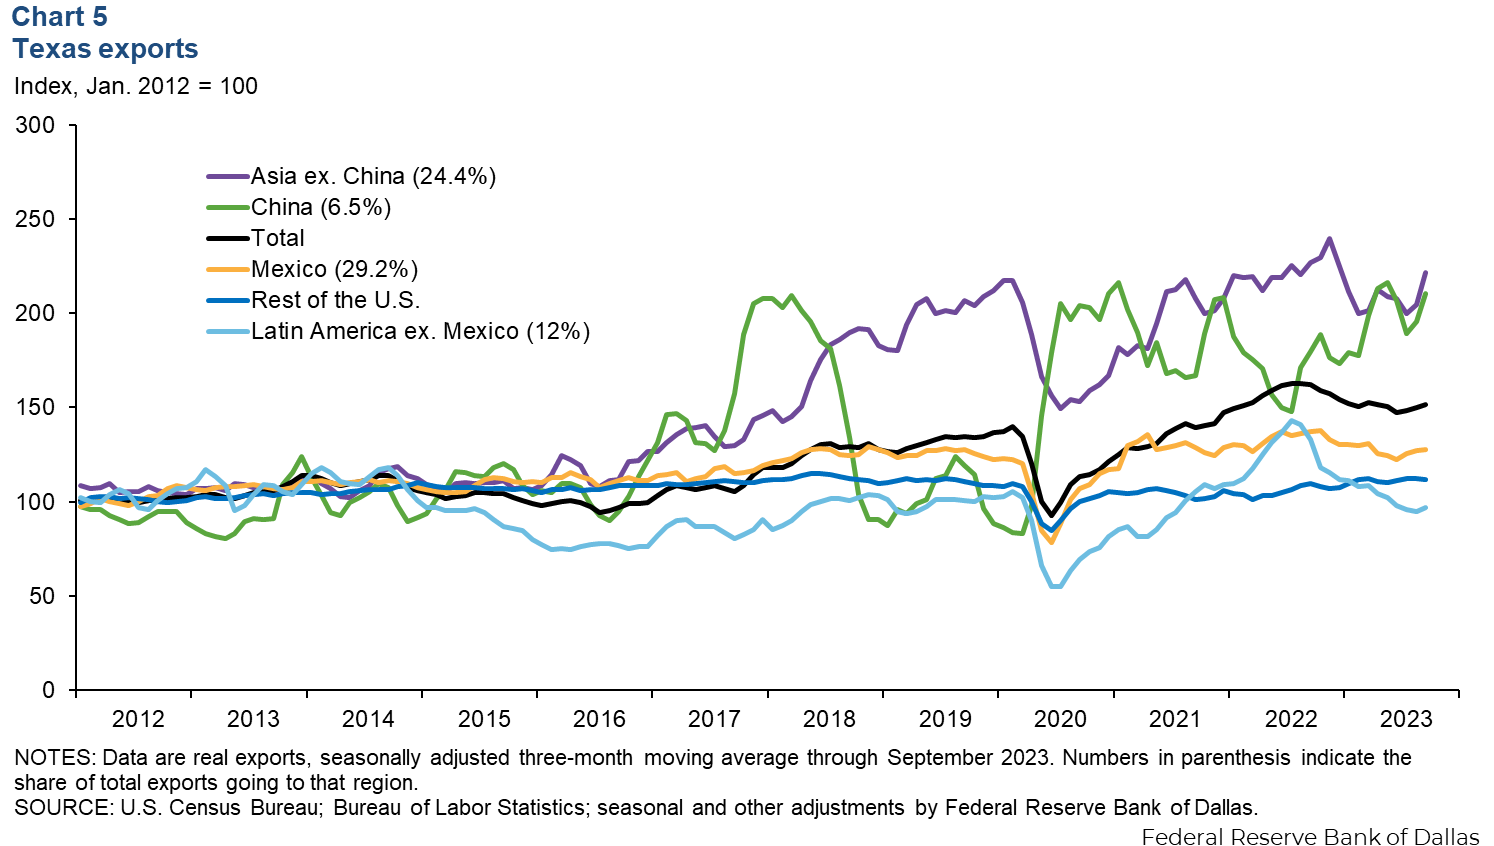
Exports
In September, the three-month moving average of Texas exports climbed 1.1 percent, while the rest of the U.S. contracted 0.3 percent (Chart 5). The three-month average of Texas exports to China ticked up 7.6 percent in September, and exports to the rest of Asia were up 8.3 percent. Over the same period, Texas exports to Mexico, the state’s largest trading partner, grew 0.4 percent and 2.0 percent to the rest of Latin America.
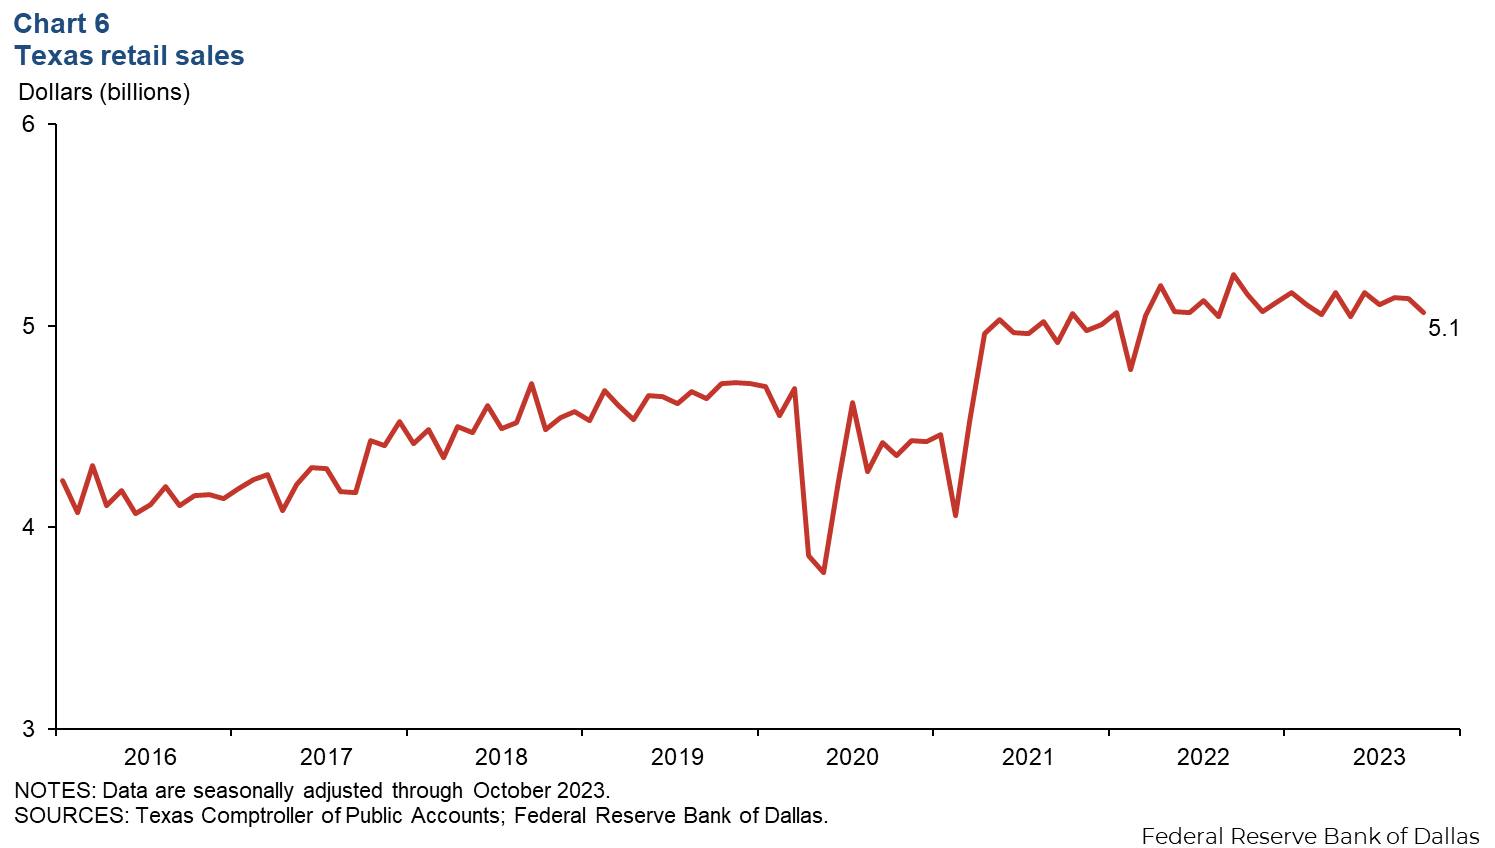
Sales tax collections
Texas retail sales tax collections decreased for the second consecutive month in October to $5.1 billion real dollars (Chart 6). Statewide sales tax collection is 2 percent below its peak of $5.2 billion reached in April 2023. Compared with October 2022, real retail sales tax collection is down 1.7 percent.
NOTE: Data may not match previously published numbers due to revisions.
About Texas Economic Indicators
Questions or suggestions can be addressed to Diego Morales-Burnett at diego.morales-burnett@dal.frb.org. Texas Economic Indicators is published every month during the week after state and metro employment data are released.