Texas Economic Indicators

| Texas economy dashboard (July 2024) | |||
| Job growth (annualized) April–July '24 |
Unemployment rate |
Avg. hourly earnings |
Avg. hourly earnings growth y/y |
| 0.4% | 4.1% | $32.97 | 3.7% |
The Texas economy saw payroll employment contract for a second straight month in July, and initial unemployment claims rose, partly due to Hurricane Beryl. The July Texas Business Outlook Surveys employment indexes showed an expansion in manufacturing and no change in the service sector. In June, the Texas headline Consumer Price Index (CPI) remained high compared with last year, and exports flattened. In July, the Texas Leading Index stabilized.
Labor market
Texas payrolls decline in July
Texas employment contracted an annualized 1.2 percent in July (-14,000 jobs) after decreasing a downwardly revised 0.6 percent in June. Significant job gains were seen in financial activities, other services, and oil and gas, while employment in manufacturing, education and health, and professional services declined strongly (Chart 1). Over the same period, U.S. payrolls rose 0.9 percent, with payrolls in education and health and construction rising more than 2 percent each. The Dallas Fed’s Texas Employment Forecast in August was revised down to 1.6 percent job growth this year (December/December).

Texas unemployment claims spike due to Hurricane Beryl
Weekly initial unemployment claims decreased in Texas at the beginning of August but remained above the levels before Hurricane Beryl (Chart 2). For the week ending Aug. 10, Texas new unemployment claims flattened at 18,018 after peaking at 27,476 in the second half of July after the hurricane hit. U.S. unemployment claims ticked down to 227,000 over the same period. In July, the Texas unemployment rate ticked up to 4.1 percent, and U.S. unemployment inched up to 4.3 percent.

Texas Business Outlook Surveys
The Texas Business Outlook Surveys’ employment indexes in July indicated job growth picked up in manufacturing but employment was flat in services (Chart 3). The manufacturing survey’s employment index was 7.1, up from -2.9 the previous month and on par with its 10-year average, whereas the service sector employment index slowed to -0.2 in July from 1.8 in June.

Consumer prices
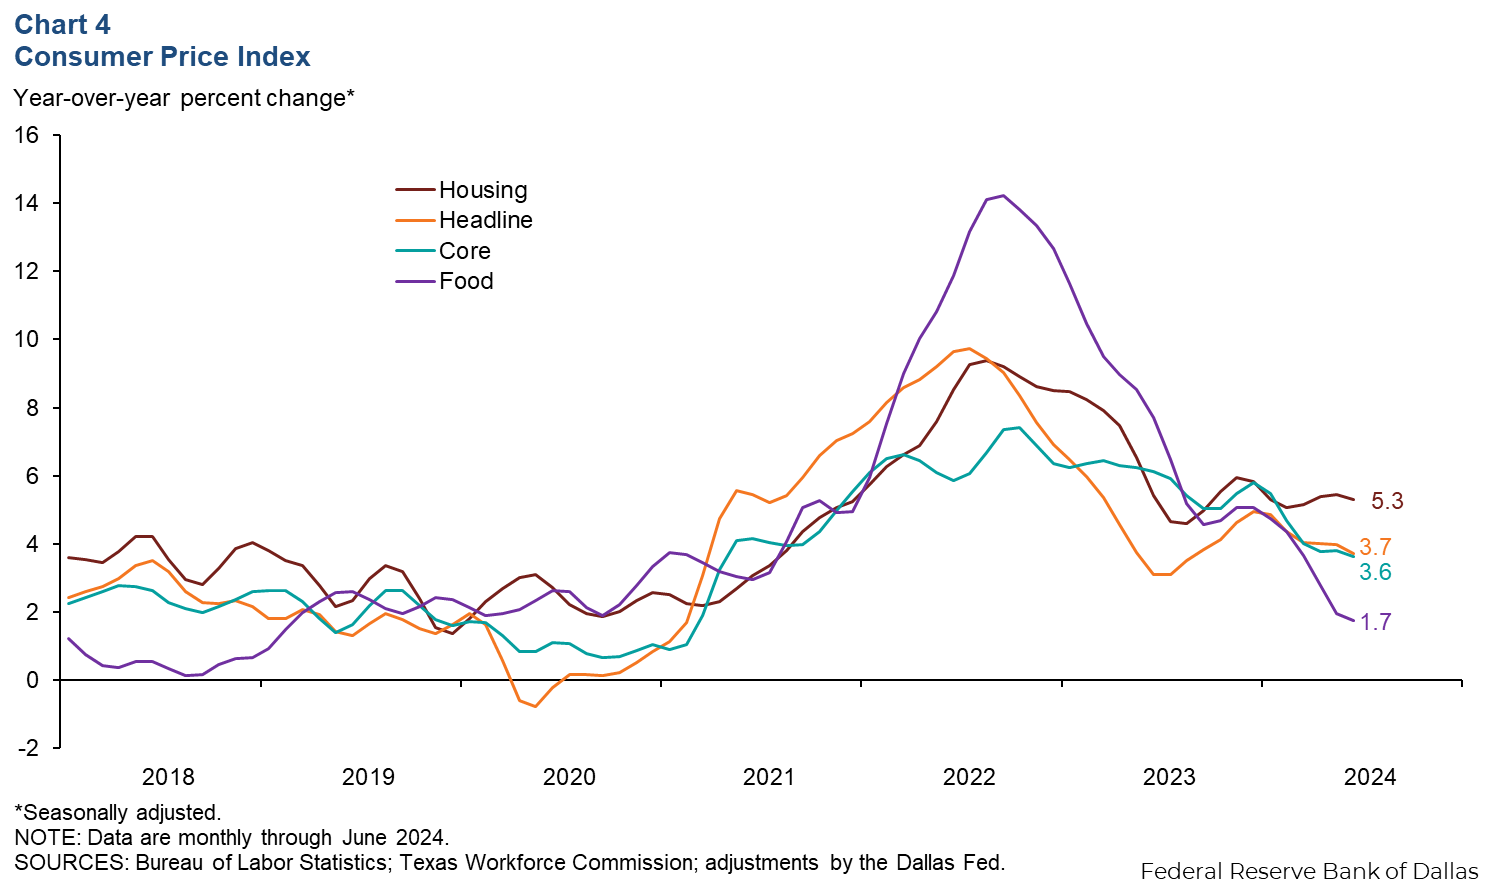
In June, the 12-month change in the Texas headline CPI ticked down to 3.7 percent (Chart 4). Meanwhile core CPI, which excludes food and energy, also edged down, to 3.6 percent. Additionally, housing remained elevated at 5.3 percent over the same period, while the food index fell to 1.7 percent.

Exports
In June, Texas exports declined 1.1 percent, but the three-month moving average was flat (Chart 5). Exports from the rest of the U.S. grew 1.0 percent. On a year-to-date basis through June, the three-month average of Texas exports to China decreased 18.9 percent, while exports to the rest of Asia were up 14.5 percent. Texas exports to Mexico, the state’s largest trading partner, expanded a mere 0.3 percent, but exports to the rest of Latin America rose 10.6 percent.

Texas Leading Index
The Texas Leading Index, a composite of eight leading indicators that sheds light on the future of the state’s economy, was little changed in July (Chart 6). The three-month change was negative, with several components contributing negatively to the index, particularly a strong decline in average hours worked. The exceptions included the Texas Stock Index, which rose moderately.

NOTE: Data may not match previously published numbers due to revisions.
About Texas Economic Indicators
Questions or suggestions can be addressed to Diego Morales-Burnett at diego.morales-burnett@dal.frb.org. Texas Economic Indicators is published every month during the week after state and metro employment data are released.