Texas Economic Indicators

| Texas economy dashboard (April 2025) | |||
| Job growth (annualized) Jan.–April '25 |
Unemployment rate |
Avg. hourly earnings |
Avg. hourly earnings growth y/y |
| 2.8% | 4.1% | $34.30 | 4.9% |
The Texas economy expanded in April. Employment growth was strong, and earnings rose. At the same time, the April Texas Business Outlook Surveys showed a continued decline in business activity. In March, housing activity cooled amid high mortgage rates.
Labor market
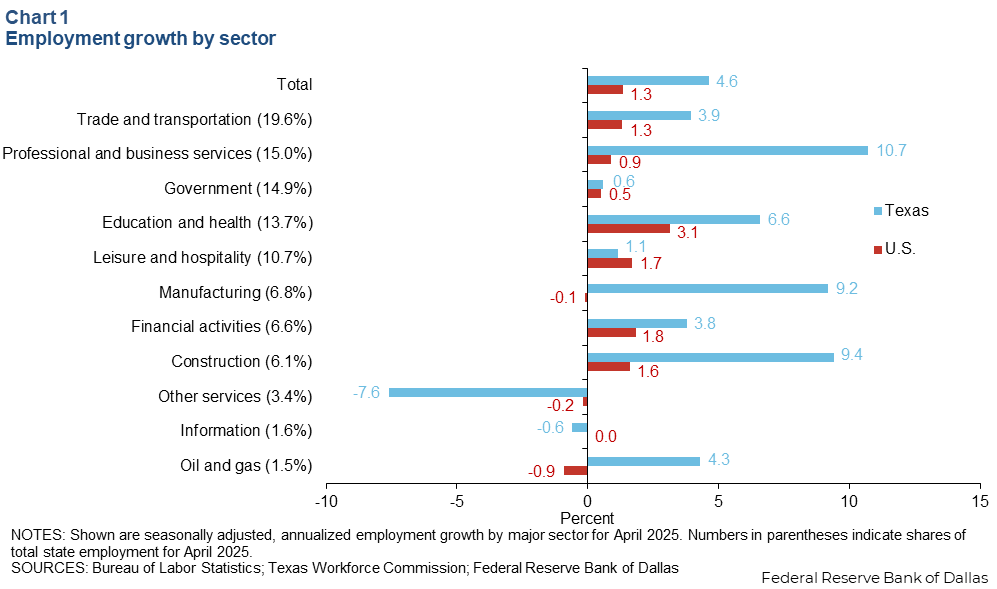
Job growth picks up in April
Texas employment grew an annualized 4.6 percent in April (54,000 jobs) after expanding 1.4 percent in March. Significant job gains were seen in professional and business services, construction, and manufacturing, all growing above 9 percent (Chart 1). The Dallas Fed’s Texas Employment Forecast is for 1.7 percent growth in 2025 (December/December).
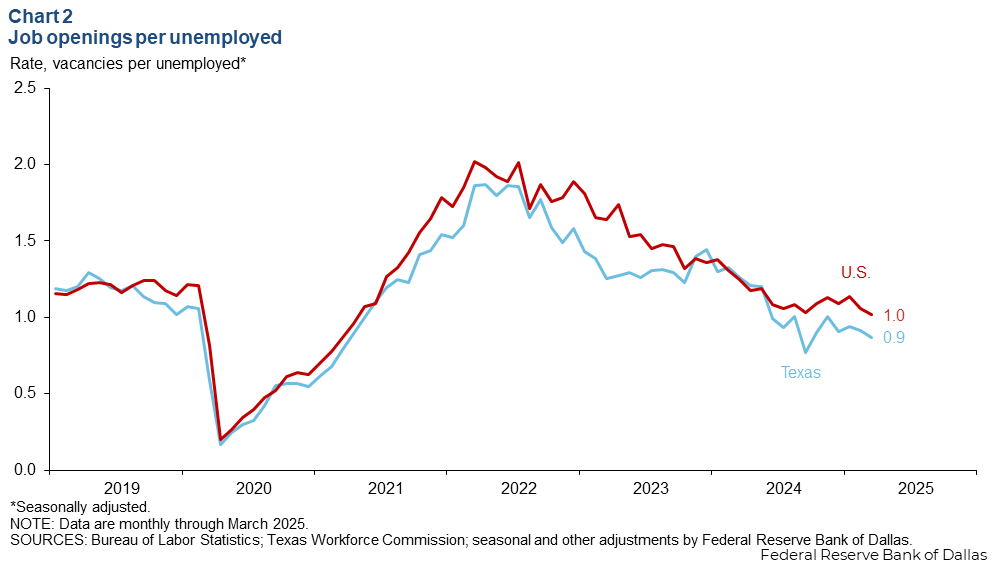
Labor market is balanced
In March, Texas had 0.9 job vacancies per unemployed worker, slightly lower than the nation’s 1.0 reading (Chart 2). The job-openings-per-unemployed-worker ratio serves as a measure of labor market tightness, and a rate equal to one implies a balanced labor market.
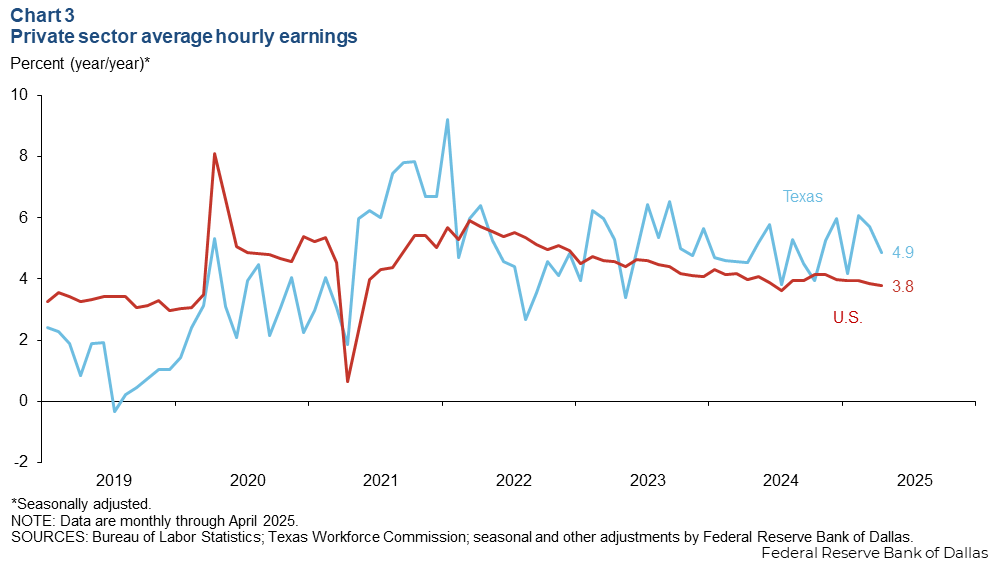
Texas wage growth outpaces the nation’s rise
Texas private hourly earnings grew 4.9 percent year over year in April, ahead of the nation’s 3.8 percent rise (Chart 3). Since mid-2023, annual wage growth in Texas has outpaced year-over-year rises in the Texas consumper price index by about 2 percentage points, on average. Similarly for the U.S., private wage growth has outpaced the headline inflation rate by 1 percentage point over the same period.
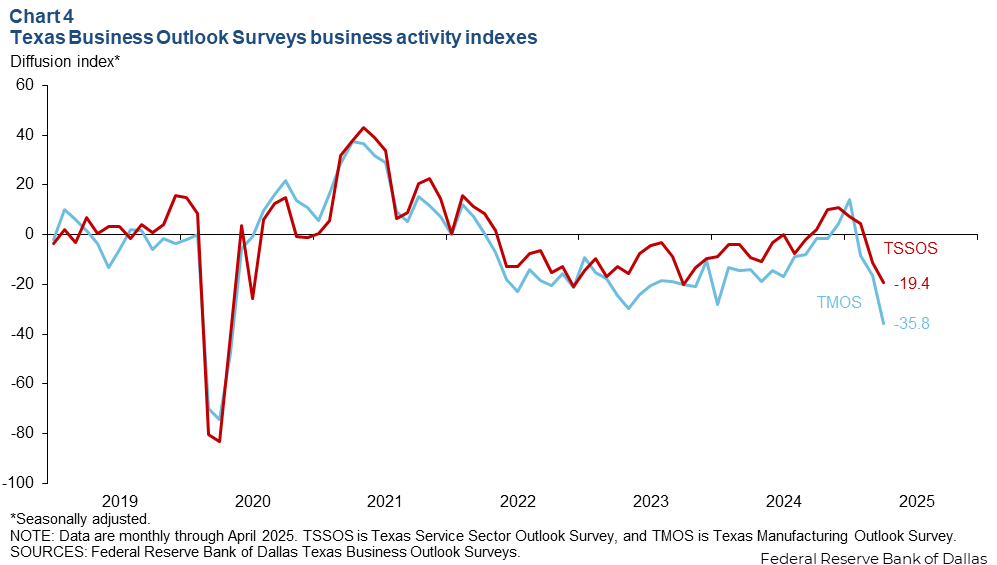
Texas Business Outlook Surveys
The April Texas Business Outlook Surveys indicated a sharp decline in business activity. The service sector’s business activity index further declined to -19.4, while the manufacturing index dropped to -35.8 from -16.3 (Chart 4). From mid-2022 to fall 2024, both indexes were negative, in line with a period of high inflation, elevated interest rates and squeezed profit margins. Participant comments primarily attribute the recent weakening in sentiment to uncertainty about tariff policy. Greater pessimism in the manufacturing sector is likely a result of its higher exposure to shifting trade policies.
Housing
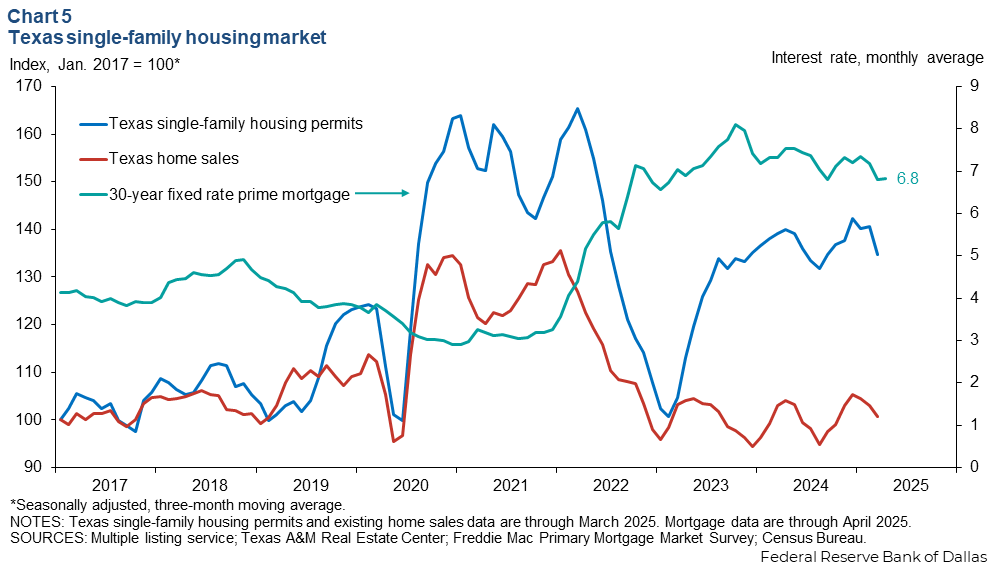
Texas existing-home sales decreased in March. The three-month moving average declined 2.2 percent, and the three-month moving average of single-family housing construction permits fell 4.1 percent (Chart 5). In April, mortgage rates remained at an elevated 6.8 percent, continuing to impact housing affordability. Although the spring season tends to be the busiest time for the housing market, a sharp drop in consumer confidence along with elevated home prices and mortgage rates likely held back potential buyers from making large purchases.
NOTE: Data may not match previously published numbers due to revisions.
About Texas Economic Indicators
Questions or suggestions can be addressed to Diego Morales-Burnett at diego.morales-burnett@dal.frb.org. Texas Economic Indicators is published every month during the week after state and metro employment data are released.