Texas Economic Indicators

| Texas economy dashboard (May 2025) | |||
| Job growth (annualized) Feb.–May '25 |
Unemployment rate |
Avg. hourly earnings |
Avg. hourly earnings growth y/y |
| 2.7% | 4.1% | $34.40 | 4.9% |
The Texas economy grew in May. Employment growth was robust, as was labor force growth. The May Texas Business Outlook Surveys showed a moderation in wages and benefits growth. Inflation slowed dramatically, while sales tax revenue increased. Exports ticked down in April.
Labor market
Job growth above long-run average in May
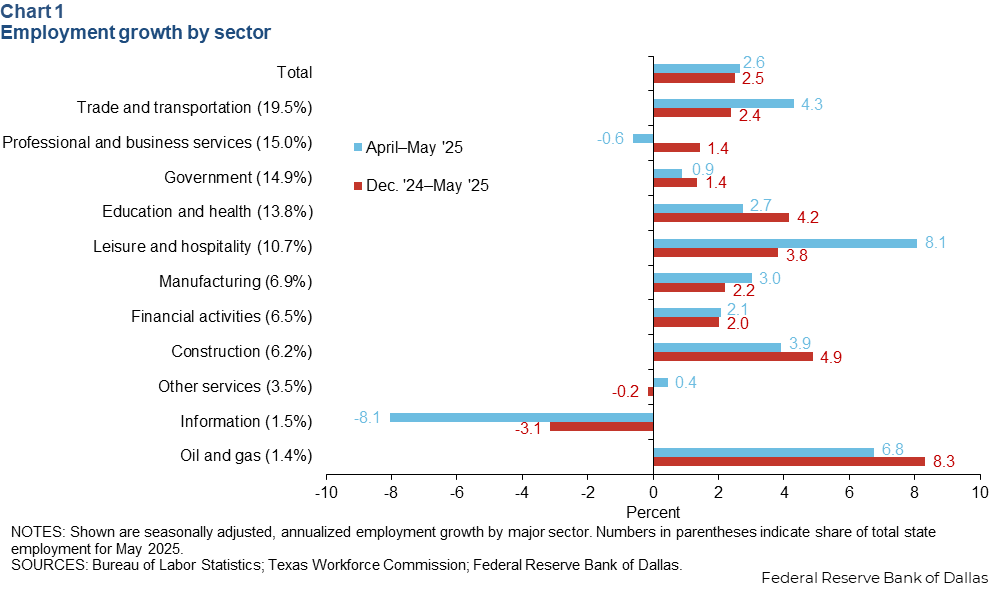
Texas employment grew an annualized 2.6 percent in May (31,000 jobs) after expanding 4.0 percent in April. Significant job gains were seen in leisure and hospitality, oil and gas, and trade and transportation, all growing above 4 percent. (Chart 1) The Dallas Fed Texas Employment Forecast is for 2.0 percent growth in 2025 (December/December).
Labor force growth trends down but remains positive
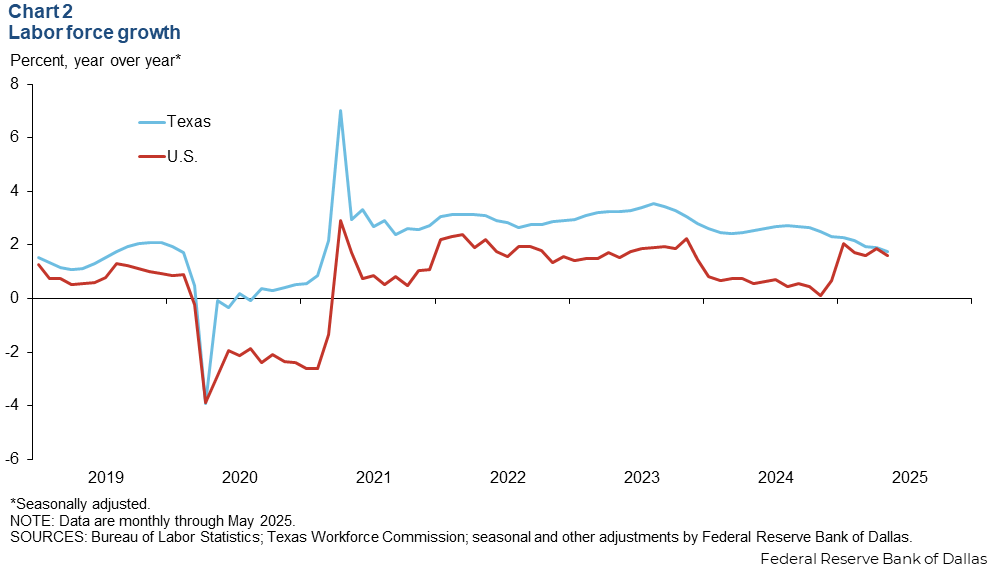
In May, the Texas labor force grew an annualized 1.9 percent, while the nation saw a 4.3 percent annual decrease. The 12-month growth rate had been slowing since August 2023 in Texas, though it began edging up in March 2024 and was up 1.7 percent in May, exceeding the nation’s 1.6 percent year-over-year growth (Chart 2). A growing labor force is critical for a healthy economy as more workers support greater production of goods and services. Moreover, tax revenue from payroll and sales taxes increase with labor force expansion, helping sustain government programs and offset the costs of an aging population.
Texas Business Outlook Surveys
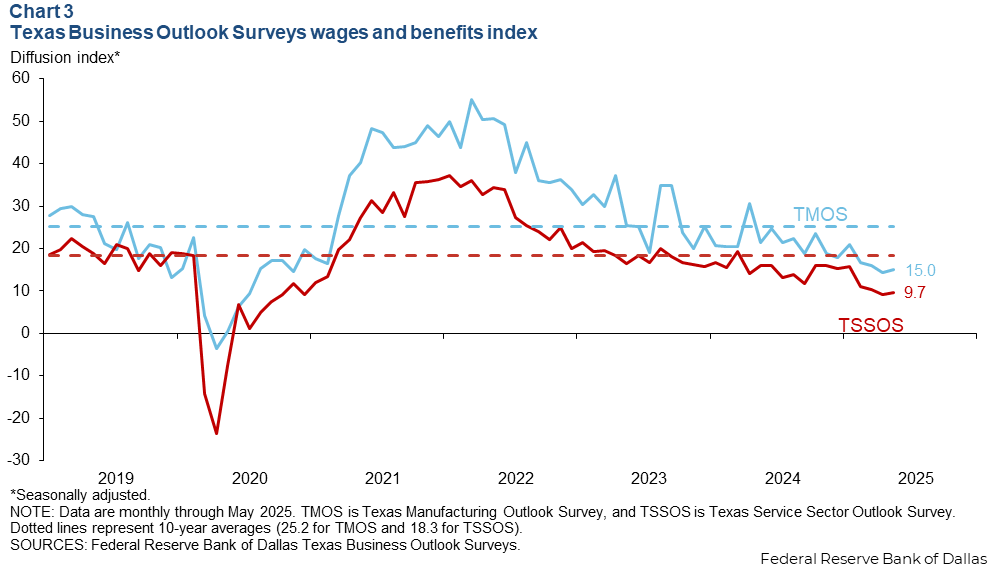
The Texas Business Outlook Surveys indicated continued growth in wages and benefits in May (Chart 3). The Texas Manufacturing Outlook Survey wages and benefits index ticked up to 15.0, still below the series’ recent average. The Texas Service Sector Outlook Survey wages and benefits index also ticked up to 9.7 from 9.1. Both indexes suggested a continued moderate pace of wage growth.
Consumer price index
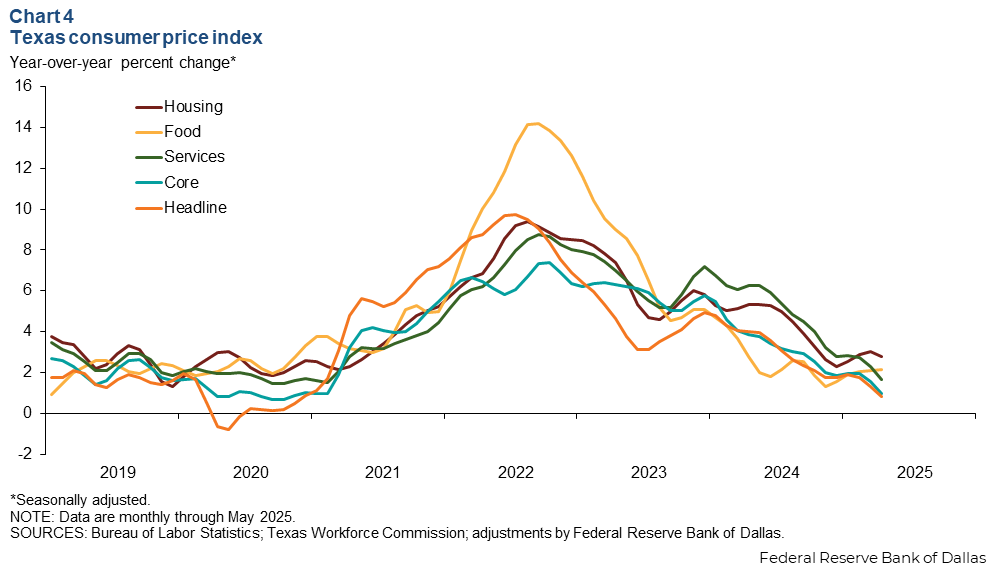
In May, the 12-month change in Texas headline consumer price index (CPI) ticked down to 0.8 percent (Chart 5). Meanwhile, core CPI, which excludes food and energy, also ticked down to 1.0 percent. Additionally, food and housing rose to 2.2 percent and 2.8 percent, respectively. Services inflation was 1.6 percent.
Exports
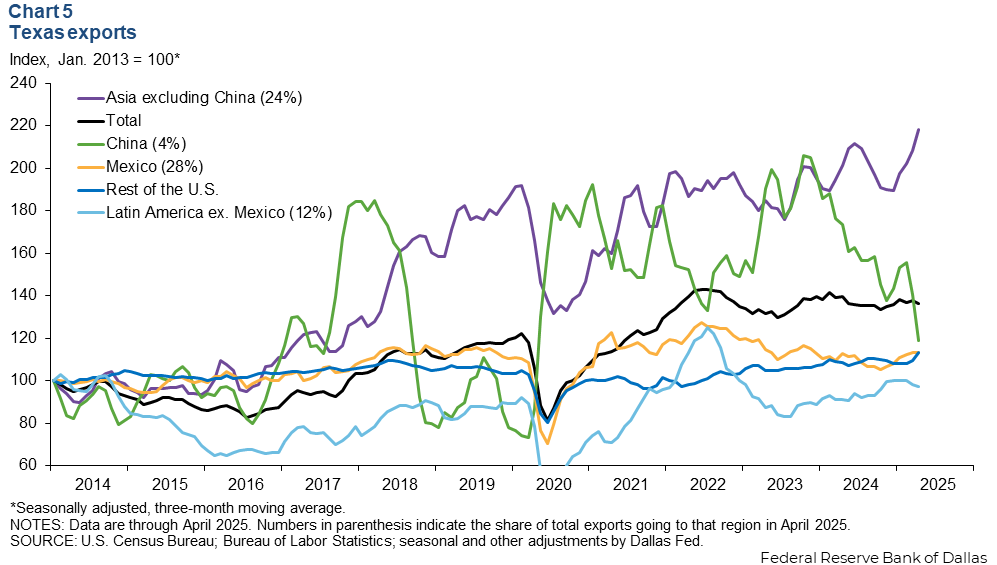
In April, Texas exports declined 2.1 percent, while the three-month moving average ticked down 0.9 percent. Smoothed exports from the rest of the U.S. rose 3.4 percent (Chart 5). The three-month moving average of Texas exports to China decreased 15.4 percent, likely as a result from recent trade tensions. However, exports to the rest of Asia were up 4.8 percent. Texas exports to Mexico, the state’s largest trading partner, fell 0.2 percent, and exports to the rest of Latin America dropped 0.7 percent.
Consumer spending
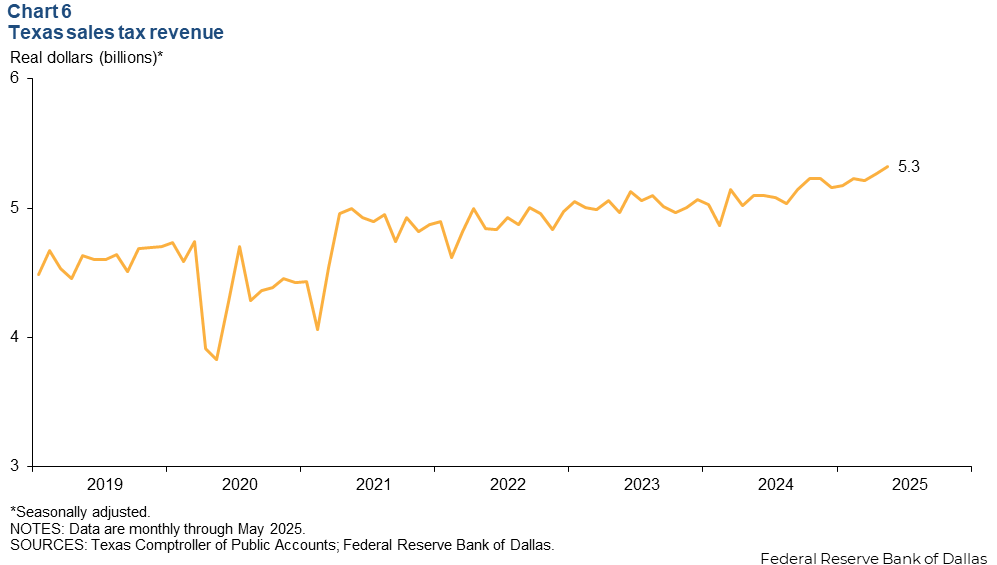
Texas sales tax collections reached a record $5.3 billion in May, up 1.1 percent from April (Chart 6). Compared to May 2024, sales tax collections were up 4.4 percent, reflecting strong consumer spending.
NOTE: Data may not match previously published numbers due to revisions.
About Texas Economic Indicators
Questions or suggestions can be addressed to Diego Morales-Burnett. Texas Economic Indicators is published every month during the week after state and metro employment data are released.