Texas Economic Indicators

| Texas economy dashboard (June 2025) | |||
| Job growth (annualized) March–June '25 |
Unemployment rate |
Avg. hourly earnings |
Avg. hourly earnings growth y/y |
| 1.6% | 4.0% | $34.70 | 4.9% |
The Texas economy slowed in June. Employment declined, and the unemployment rate ticked down. The June Texas Business Outlook Surveys showed flat manufacturing activity and a mild contraction in the service sector. Business formation in Texas remained elevated in early July, while loan volumes for the Eleventh District increased in June.
Labor market
Employment dips in June
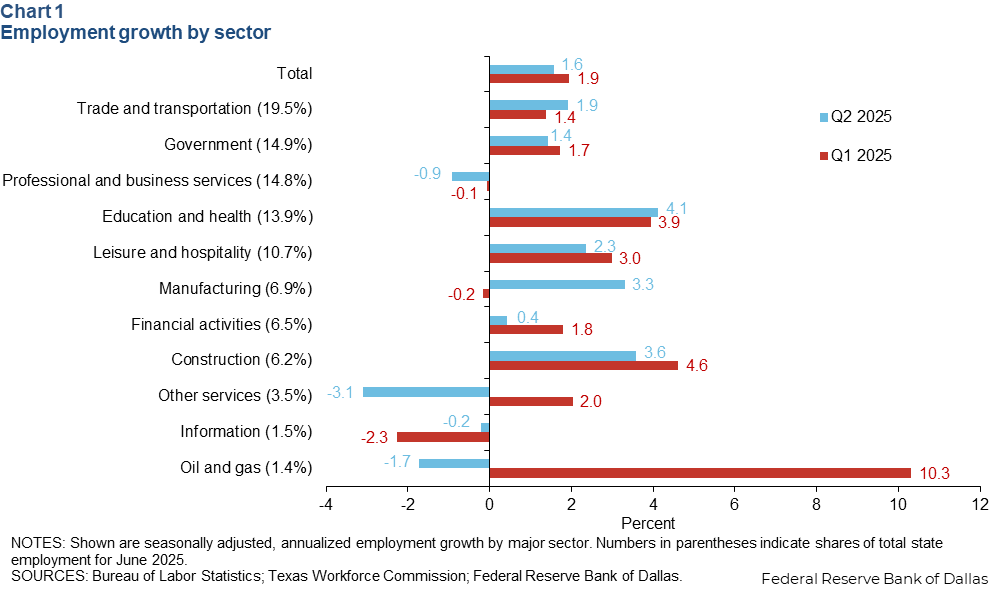
Texas employment contracted an annualized 1.3 percent in June (-15,500 jobs) after expanding 2.1 percent in May. Payrolls expanded an annualized 1.6 percent in the second quarter, lagging first-quarter growth of 1.9 percent (Chart 1). Employment in education and health, construction, and manufacturing grew more than 3 percent in the second quarter, while employment declined in the professional and business services, other services, and oil and gas sectors. The Dallas Fed’s Texas Employment Forecast was revised down to 1.7 percent growth in 2025 (December/December).
Unemployment ticks down
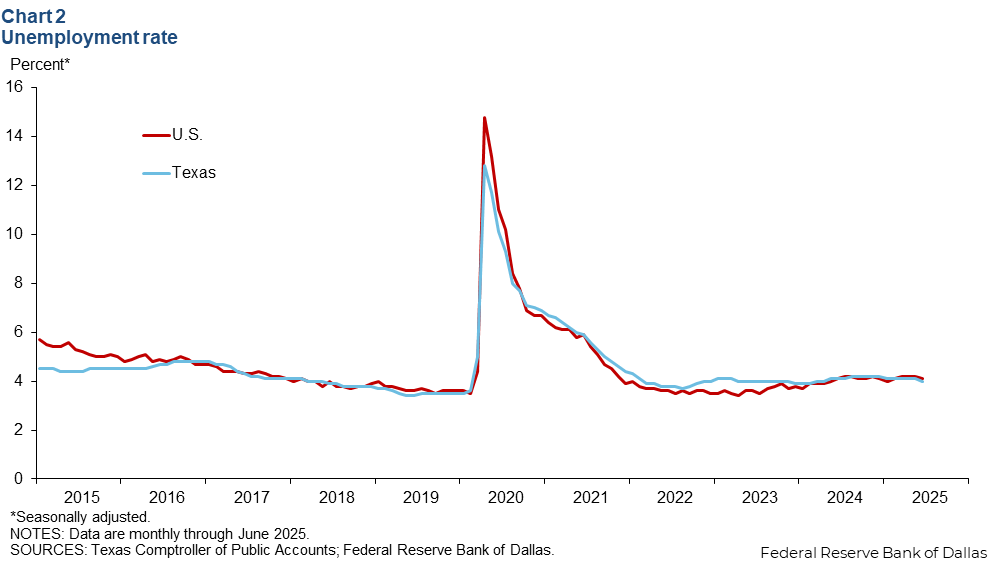
The Texas unemployment rate dipped to 4.0 percent in June (Chart 2). The nation’s jobless rate ticked down to 4.1 percent. During the week ending July 12, initial unemployment claims declined 16.4 percent compared with the previous week, while the nation’s claims ticked down 3.1 percent.
Texas Business Outlook Surveys
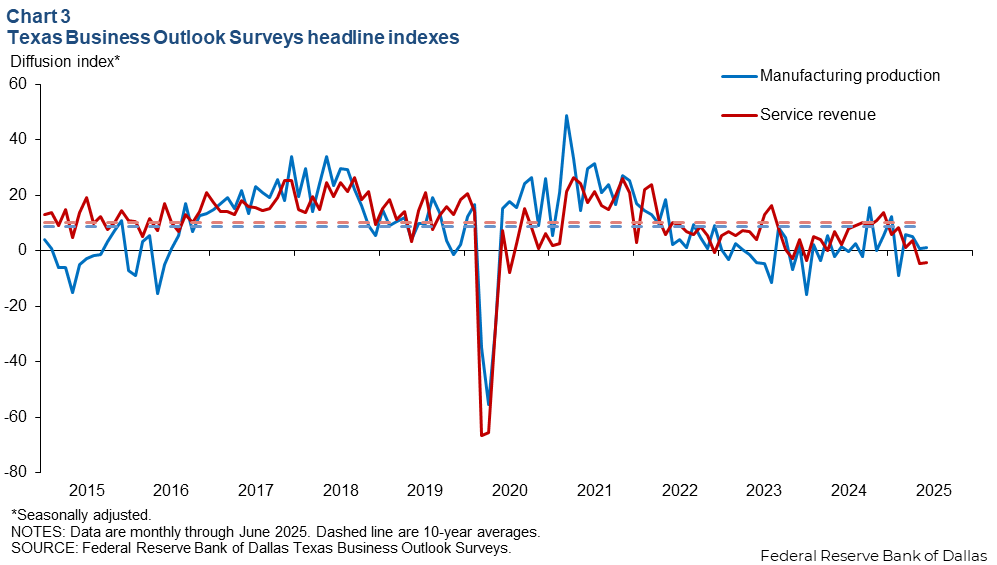
The June Texas Business Outlook Surveys reflected continued weakness in Texas manufacturing and service sector activity (Chart 3). The manufacturing production index held steady at 1.3, indicating a second month of flat output. The service sector revenue index was little changed at -4.1 in June, suggesting revenue declined at the same pace as in May. Both indexes remained below their 10-year average.
High-propensity business applications
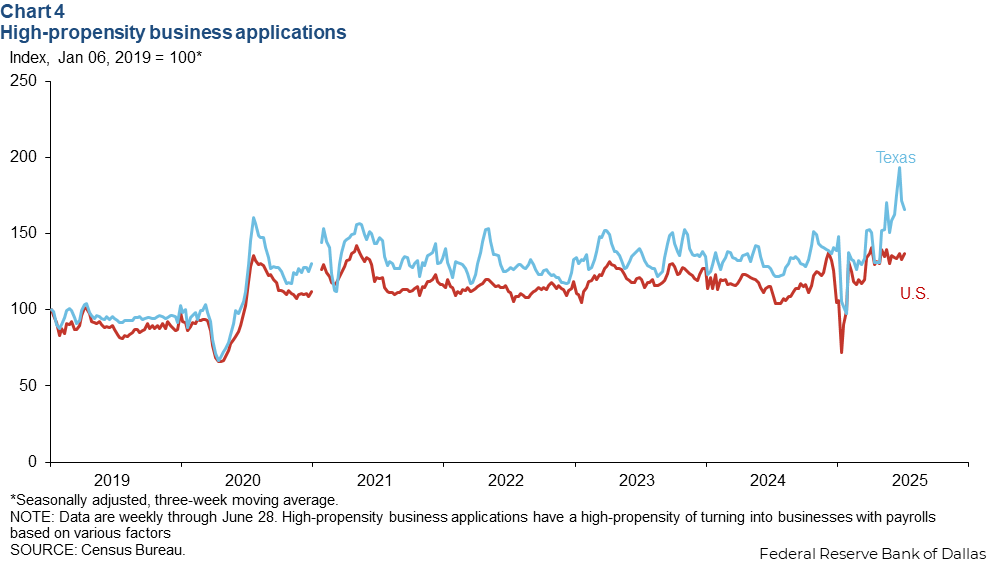
High-propensity business applications (HBA), or business applications with a high propensity of turning into firms with payrolls, increased to 3,352 in Texas and 40,558 in the U.S. the week ending June 28. The three-week moving average decreased 3.3 percent in Texas but rose 3.2 percent in the U.S. compared with the previous week (Chart 4). The three-week moving average in late June was up 66 percent in Texas and 37 percent in the U.S. relative to early 2019. A rising number of HBAs typically reflects confidence in business outlooks and contributes positively to employment growth.
Banking Conditions Survey
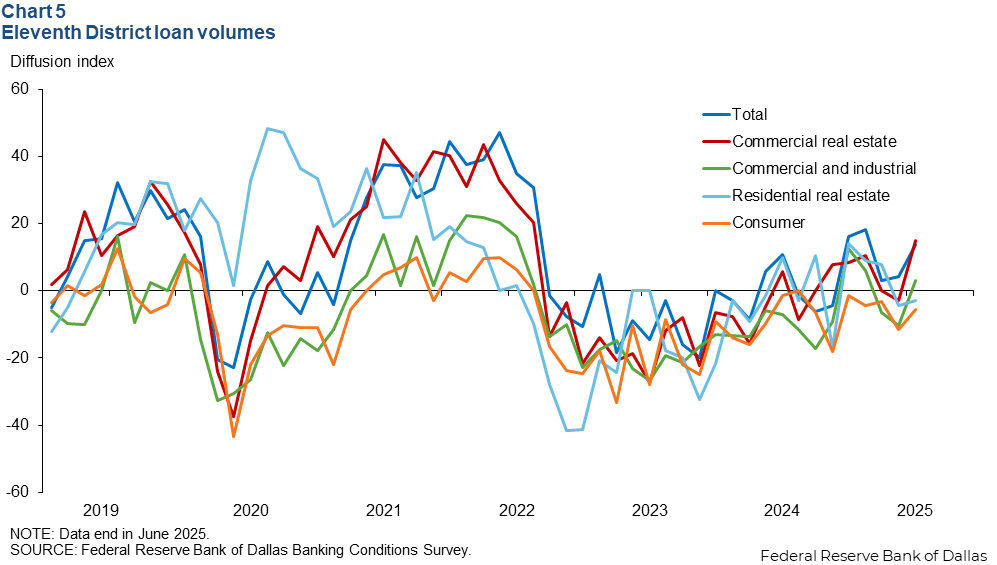
The Dallas Fed's Banking Conditions Survey suggested expansion in overall loan volumes in June. Lending growth was mixed across categories (Chart 5). The total loan volume index jumped 9.5 points to 13.7, reflecting a pickup in the pace of loan expansion. The commercial and industrial loan volume and commercial real estate loan volume indexes rose and were positive. Meanwhile, the residential real estate loan volume index and consumer loan volume index remained in negative territory, suggesting slight declines in lending activity within these segments.
NOTE: Data may not match previously published numbers due to revisions.
About Texas Economic Indicators
Questions or suggestions can be addressed to Diego Morales-Burnett. Texas Economic Indicators is published every month during the week after state and metro employment data are released.