Texas Economic Indicators

| Texas economy dashboard (August 2025) | |||
| Job growth (annualized) May–Aug. '25 |
Unemployment rate |
Avg. hourly earnings |
Avg. hourly earnings growth y/y |
| 0.7% | 4.1% | $34.33 | 3.1% |
The Texas economy expanded in August. Employment growth was strong, though the unemployment rate ticked up slightly and initial unemployment insurance claims were elevated in mid-September. The September Texas Business Outlook Surveys showed continued expansion in manufacturing but contraction in the service sector. The July CPI readings marked an additional month of low inflation.
Labor market
Payroll employment accelerates in August
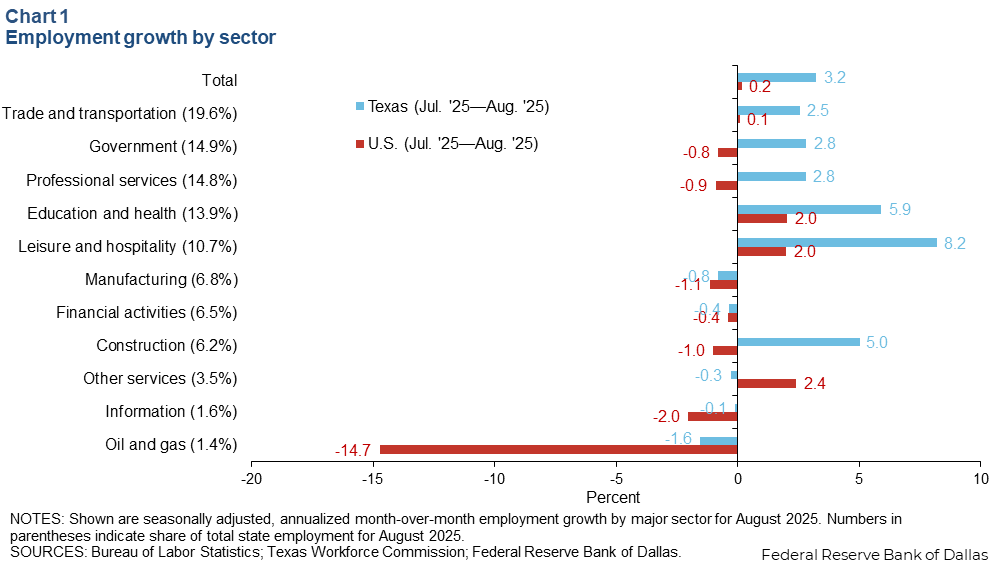
Texas employment grew an annualized 3.2 percent in August (38,000 jobs), outpacing the nation’s 0.2 percent increase (Chart 1). Significant job gains were seen in leisure and hospitality, education and health (primarily health services), and construction sectors. The Dallas Fed’s Texas Employment Forecast is for 1.3 percent growth in 2025 (December/December).
Unemployment rises
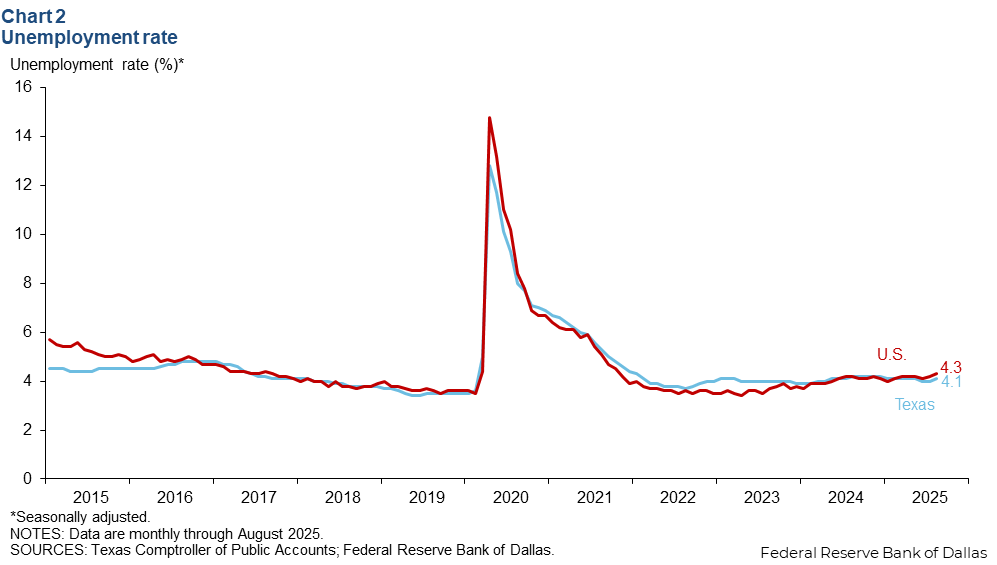
The Texas unemployment rate ticked up to 4.1 percent in August (Chart 2). The nation’s jobless rate edged up to 4.3 percent. Moreover, the U6 unemployment rate—the broadest measure of unemployment which includes those who are underemployed, marginally attached to the labor force and discouraged workers—rose in Texas to 8.5 percent in August from 8.0 percent in July and ticked up to 8.1 percent for the nation.
Unemployment insurance claims drop in mid-September
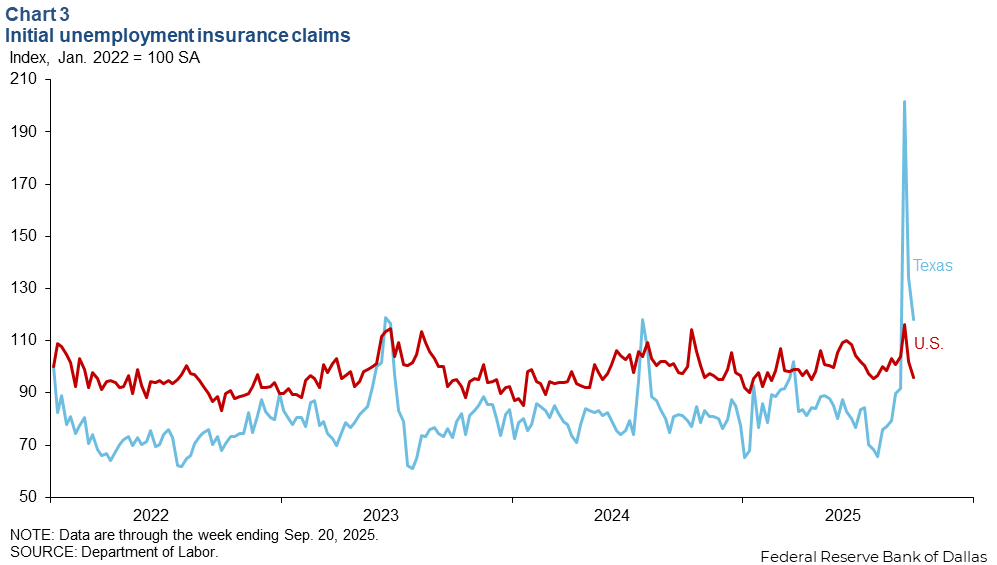
Texas weekly initial unemployment claims fell in mid-September after spiking earlier in the month (Chart 3). Texas’ new unemployment claims trended down to 23,162 in the week ending Sept. 20 from a recent high of 39,459 in early September. According to a Texas Workforce Commission official, the rise in the number of claims filed in the first week of September was due to a surge in fraudulent claims. U.S. initial claims fell 6.0 percent to 218,000 claims in the week ending Sept. 20.
Texas Business Outlook Surveys
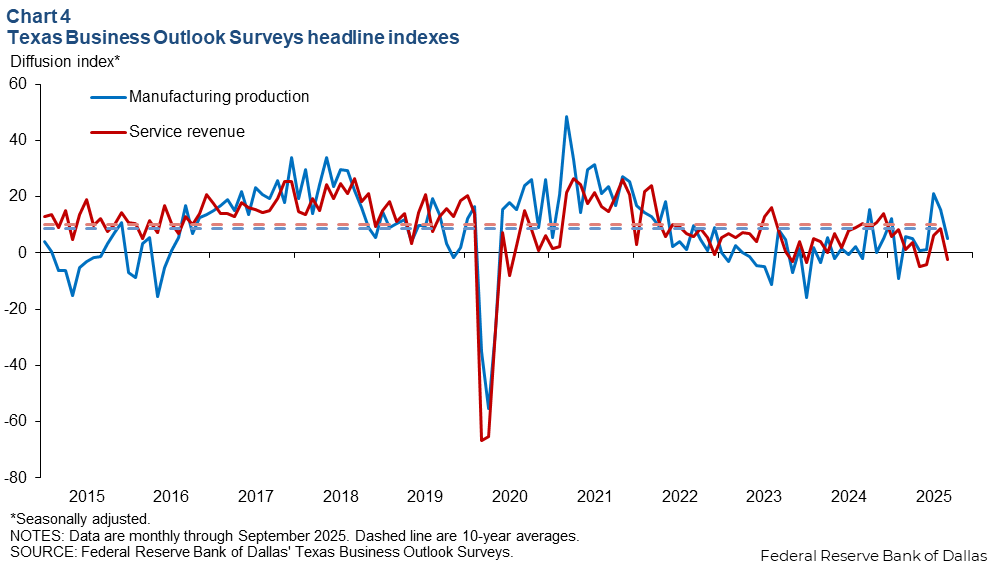
The Texas Business Outlook Surveys indicated a slower pace of expansion in manufacturing and a mild contraction in the service sector (Chart 4). The Texas Manufacturing Outlook Survey headline index ticked down to 5.2, below its 10-year average. The Texas Service Sector Outlook Survey index fell to -2.4.
Consumer Price Index
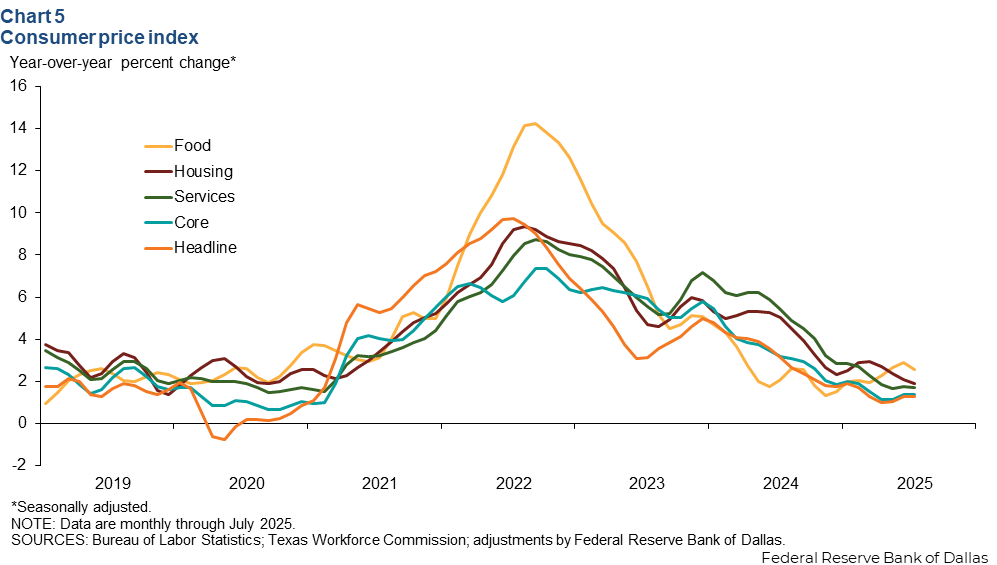
The 12-month change in Texas’ headline consumer price index (CPI), along with most of its components, remained modest in July (Chart 5). Headline CPI and core CPI held steady at 1.3 percent and 1.4 percent, respectively. Similarly, the 12-month change in services was flat at 1.7 percent. Year-over-year growth in the housing component ticked down to 1.9 percent while food edged down to 2.6 percent.
NOTE: Data may not match previously published numbers due to revisions.
About Texas Economic Indicators
Questions and suggestions can be addressed to Diego Morales-Burnett. Texas Economic Indicators is published every month the week after Texas employment data are released.