Texas Economic Indicators

| Texas economy dashboard (November 2025) | |||
| Job growth (annualized) Aug.–Nov. '25 |
Unemployment rate |
Avg. hourly earnings |
Avg. hourly earnings growth y/y |
| -0.6% | 4.2% | $35.27 | 5.1% |
The Texas economy decelerated toward the end of 2025. Employment fell in October and November, and the unemployment rate ticked up from September. The December Texas Business Outlook Surveys showed a slight contraction in manufacturing along with flat service activity. Exports declined in October, though retail sales tax revenue grew in December.
Labor market
Payroll employment growth halts
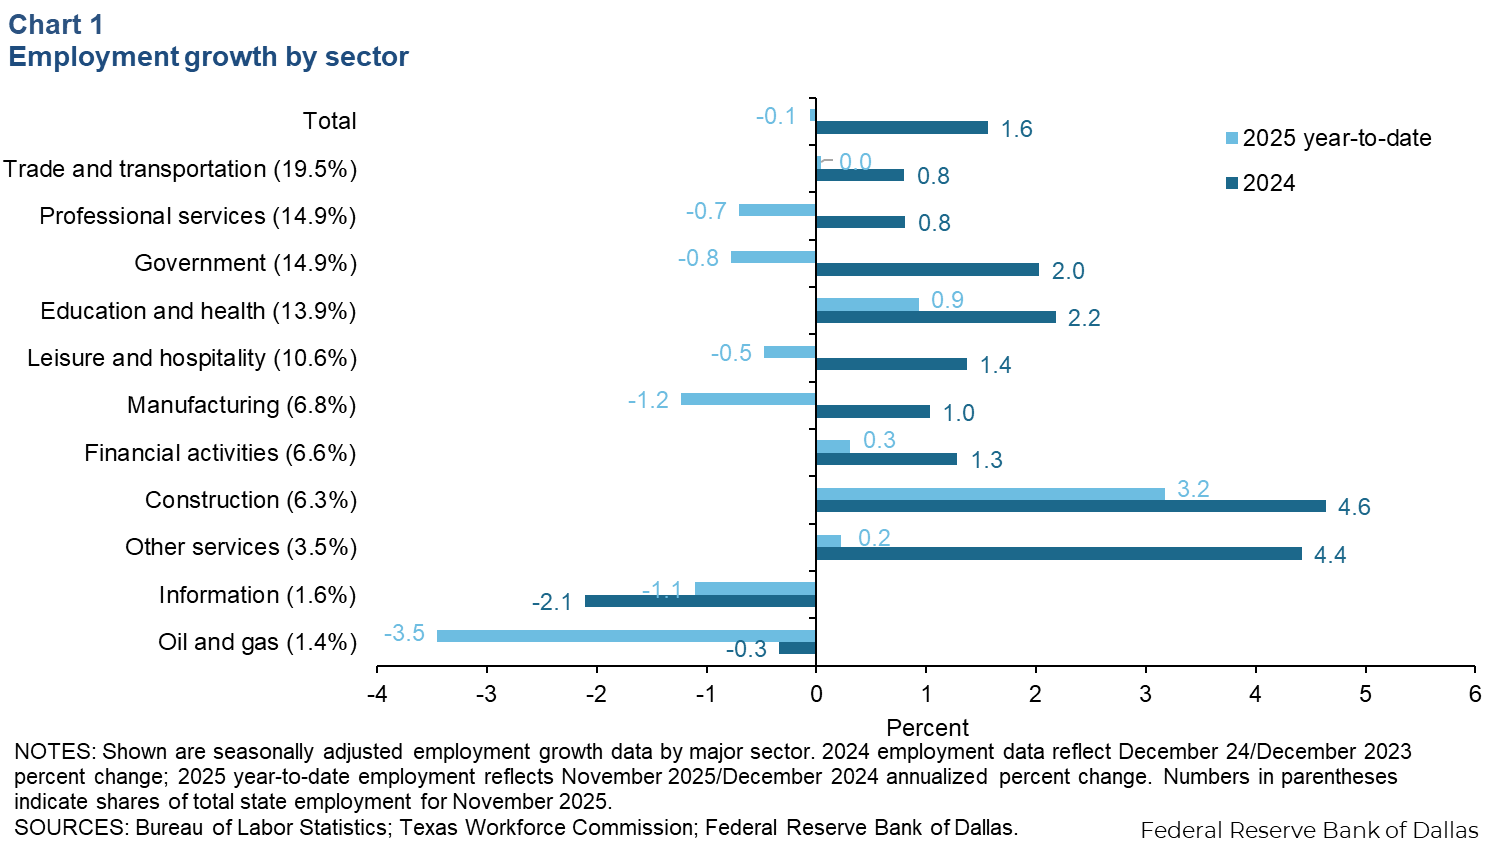
Texas employment contracted an annualized 0.4 percent in November (-4,500 jobs). On a year-to-date basis through November, Texas payrolls contracted 0.1 percent, slower than the 1.6 percent growth recorded in 2024 (Chart 1). Employment growth in 2025 was mixed, with robust gains in construction and education and health (primarily health services) but declines in most other major sectors. The Dallas Fed’s Texas Employment Forecast is for zero job growth in 2025 (December/December).
Unemployment edges up
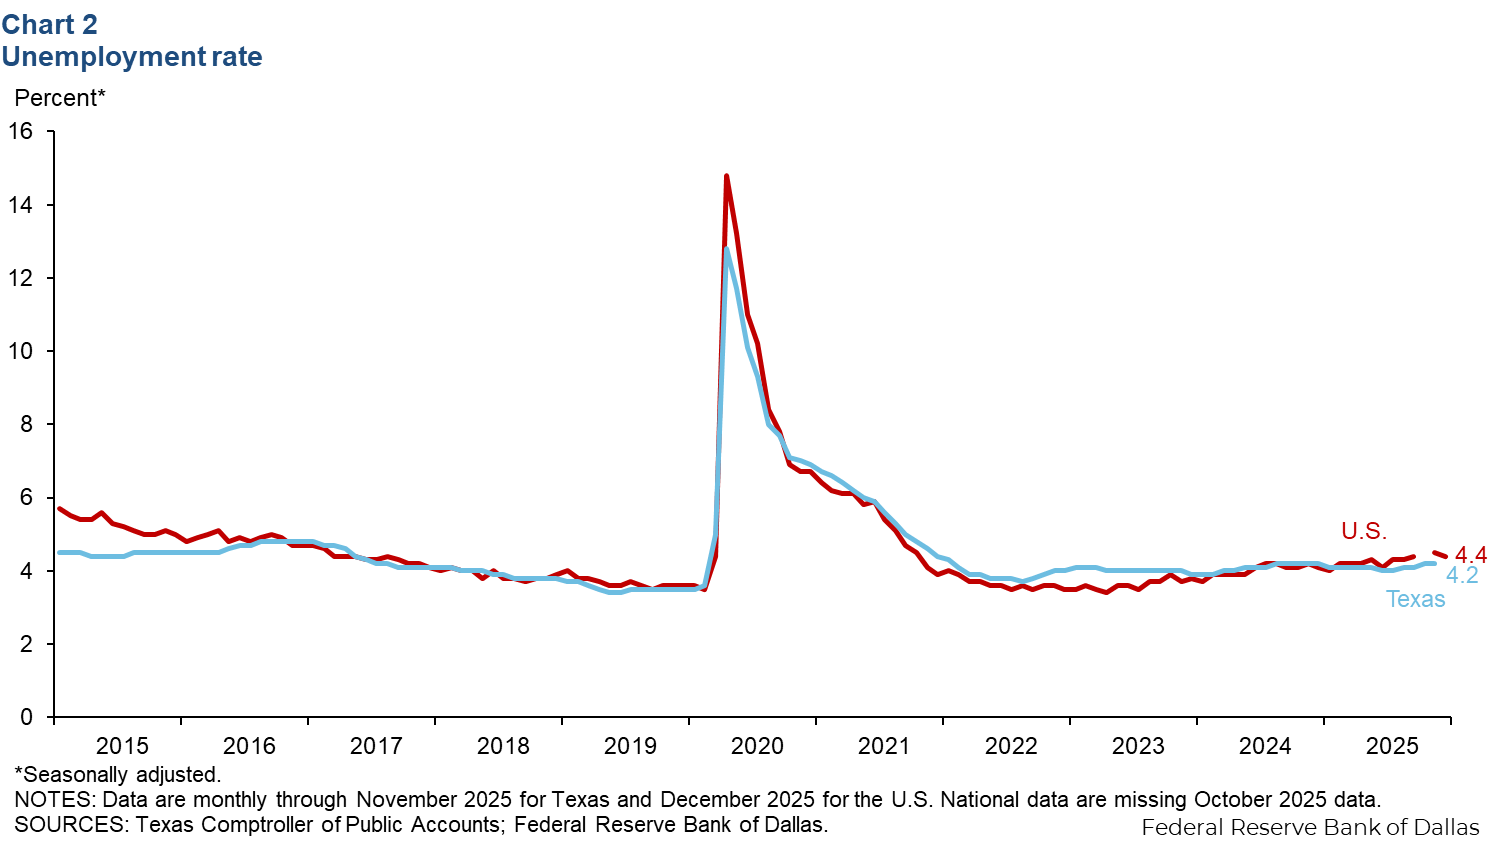
The Texas unemployment rate ticked up to 4.2 percent in November from 4.1 percent in September (Chart 2). The nation’s jobless rate edged down to 4.4 percent in December from the previous month’s 4.5 percent rate. Moreover, the U6 unemployment rate, the broadest measure of unemployment that includes those who are underemployed, marginally attached to the labor force and discouraged workers, rose in Texas to 8.5 percent in November from 8.0 percent in September and edged up to 8.8 percent for the nation in November.
Texas Business Outlook Surveys
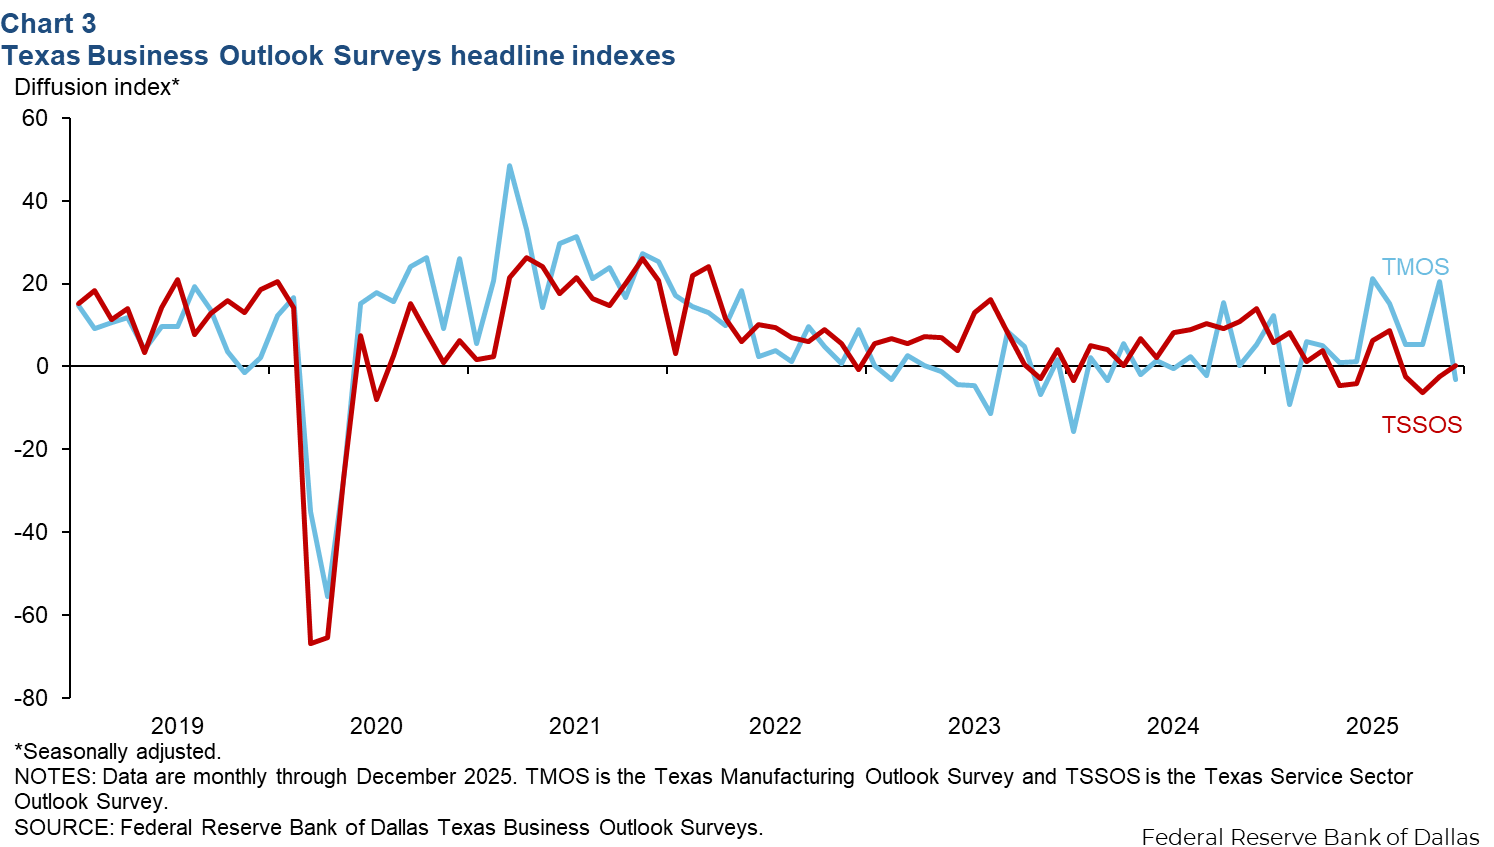
The Texas Business Outlook Surveys indicated a slight decline in manufacturing production and flat service sector revenue (Chart 3). The Texas Manufacturing Outlook Survey headline index fell to -3.2 from 20.5, while the Texas Service Sector Outlook Survey index ticked up to 0.1 from -2.5, with the near-zero reading suggesting no expansion.
Housing
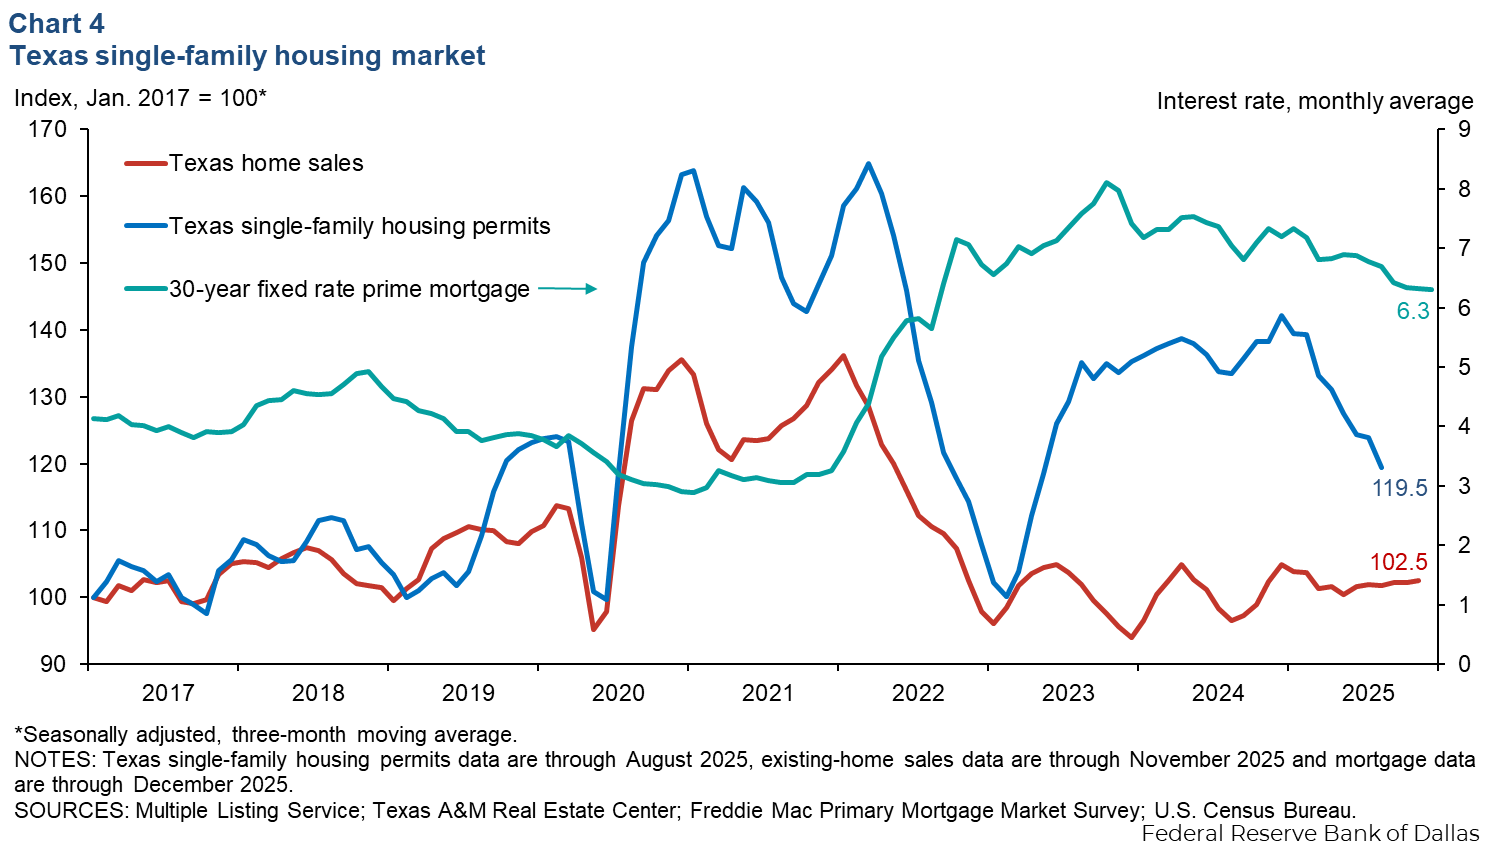
Activity in the Texas housing market remained slow. The three-month moving average of single-family housing permits fell 3.5 percent in August (Chart 4). Meanwhile the three-month moving average of existing-home sales edged up 0.2 percent in November, and existing-home inventories in Texas were at 5.1 months of supply. Mortgage rates have been trending down over the past few months but remained elevated at 6.3 percent in December, continuing to impact housing affordability.
Consumer Spending
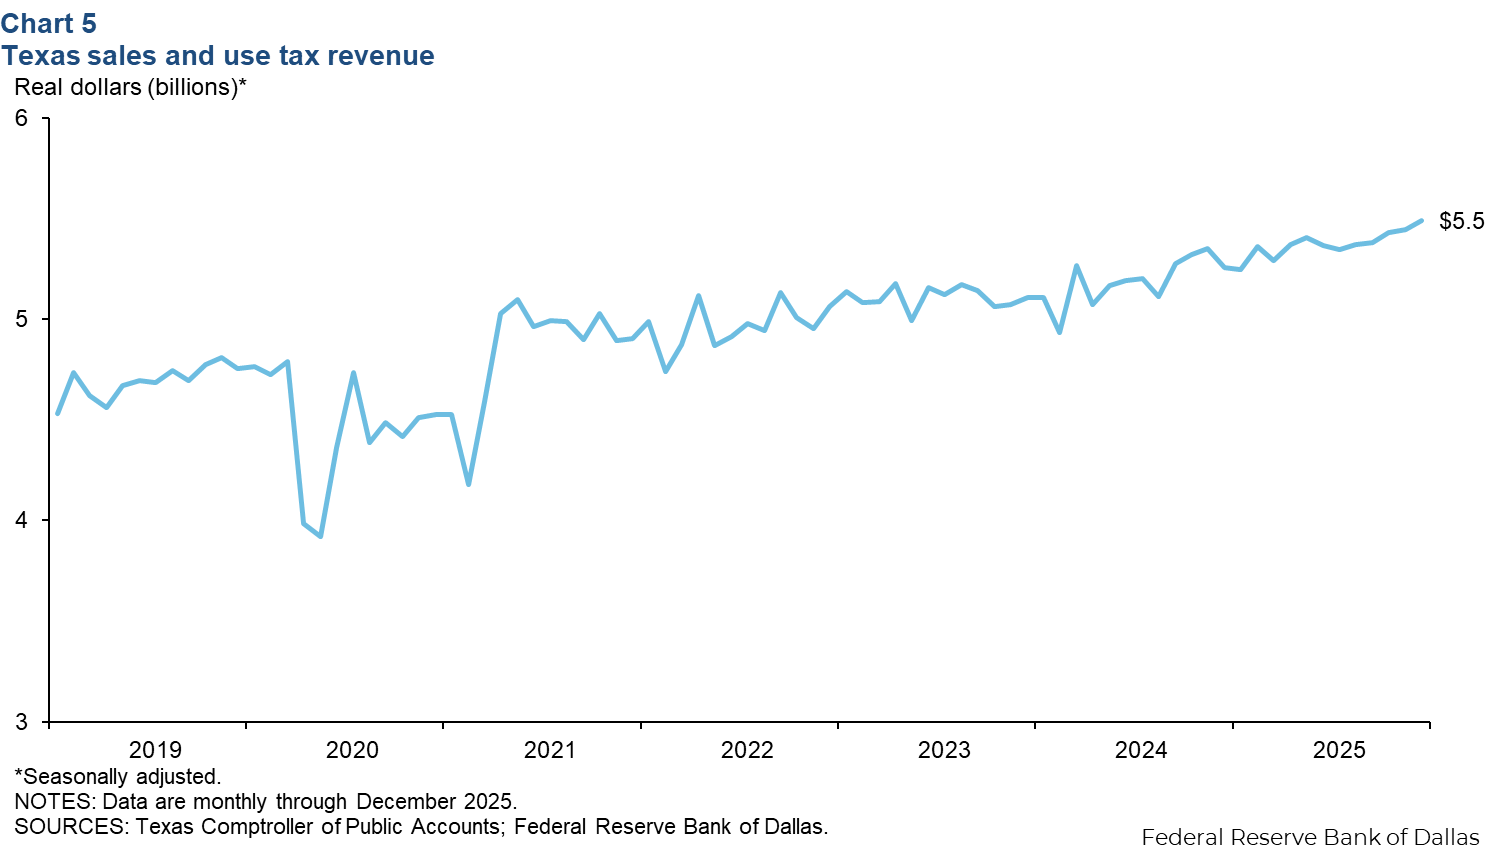
Texas sales and use tax collections edged up 0.9 percent to a record high of $5.5 billion in December (Chart 5). Compared to a year ago, inflation-adjusted sales tax collections were up 4.5 percent, indicating rising consumer spending.
NOTE: Data may not match previously published numbers due to revisions.
About Texas Economic Indicators
Questions or suggestions can be addressed to Diego Morales-Burnett. Texas Economic Indicators is published every month the week after Texas employment data are released.