Texas Economic Indicators

| Texas economy dashboard (December 2025) | |||
| Job growth (annualized) Sep.–Dec. '25 |
Unemployment rate |
Avg. hourly earnings |
Avg. hourly earnings growth y/y |
| 0.2% | 4.3% | $35.40 | 3.9% |
The Texas economy decelerated at the end of 2025. Overall, employment growth slowed notably in Texas and major metro areas in 2025 relative to 2024, though payrolls expanded in December. Private hourly wages rose, with growth outpacing inflation last year. The January Texas Business Outlook Surveys showed a strong rebound in manufacturing and service sector activity. Texas consumer price index (CPI) increases remained modest in November.
Labor market
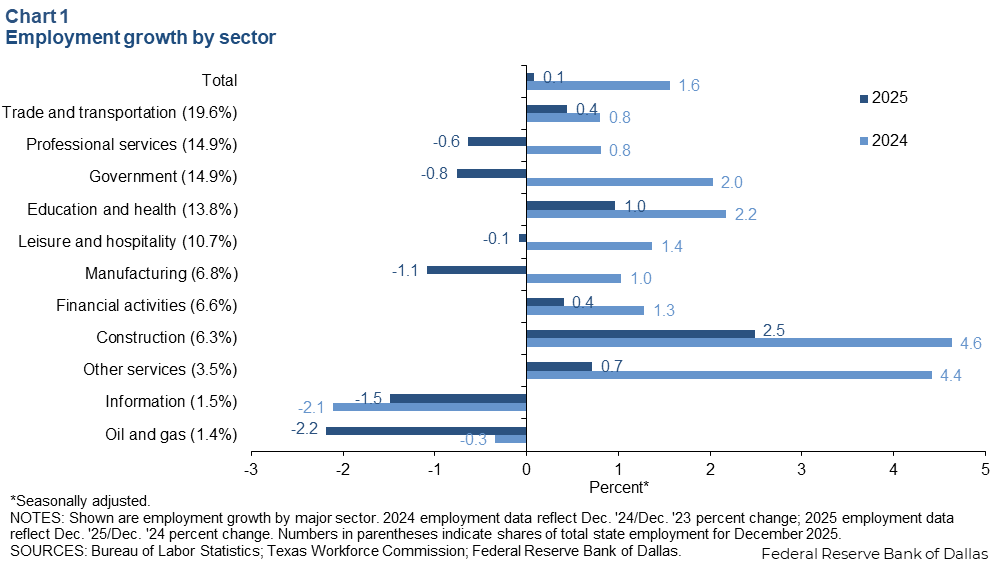
Texas employment flat in 2025
Texas employment grew an annualized 1.7 percent in December (20,200 jobs). Texas payrolls held steady in 2025 following a 1.6 percent increase in 2024 (Chart 1). Employment growth in 2025 was mixed across major sectors, with robust gains in construction and education and health (primarily health services), but modest growth or declines in most other sectors. In 2025, job growth in no major sector outpaced the growth of the previous year.
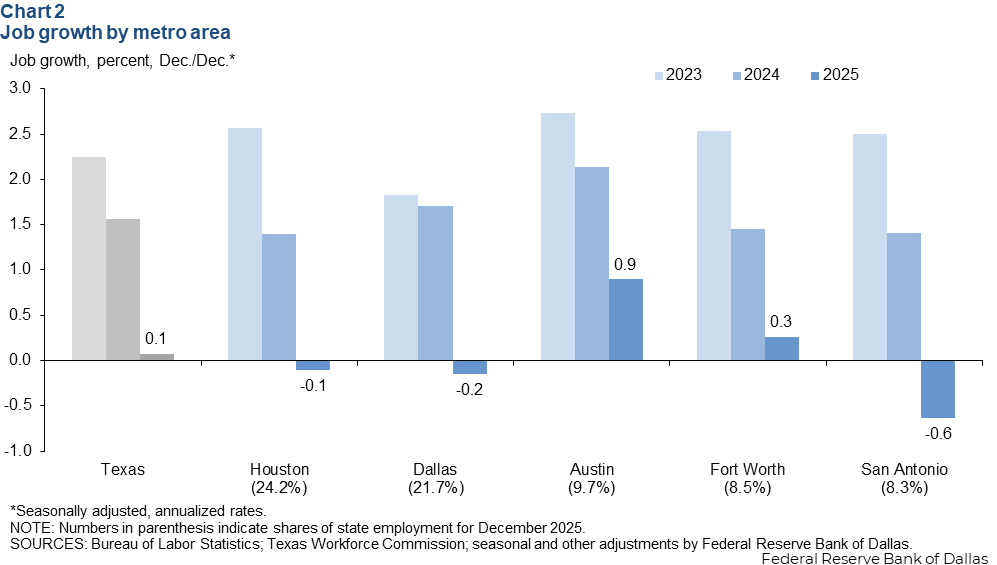
Metro job growth sluggish
Texas’ major metro job gains have been slowing over the past three years (Chart 2). In 2025, only Austin and Fort Worth saw modest gains, rising 0.9 percent and 0.3 percent respectively. San Antonio contracted 0.6 percent, while Dallas fell 0.2 percent and Houston declined 0.1 percent.
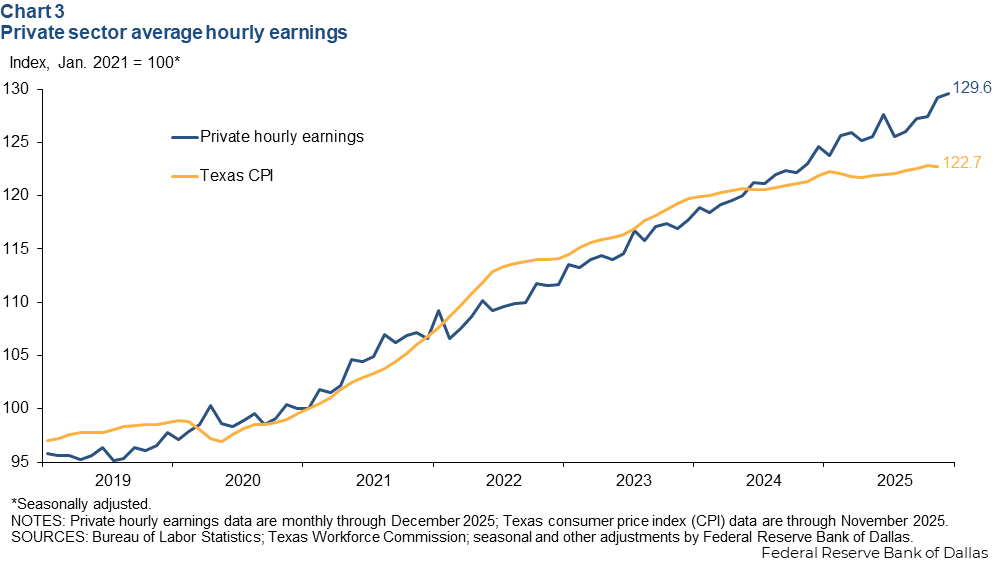
Texas wage growth outpaced inflation
Texas private hourly earnings grew 3.9 percent year over year in December 2025, and the 12-month growth in CPI for Texas was 1.1 percent in November. During a period of high inflation from mid-2021 to late 2022, Texas wage growth lagged CPI but has outpaced price increases since mid-2024 (Chart 3).
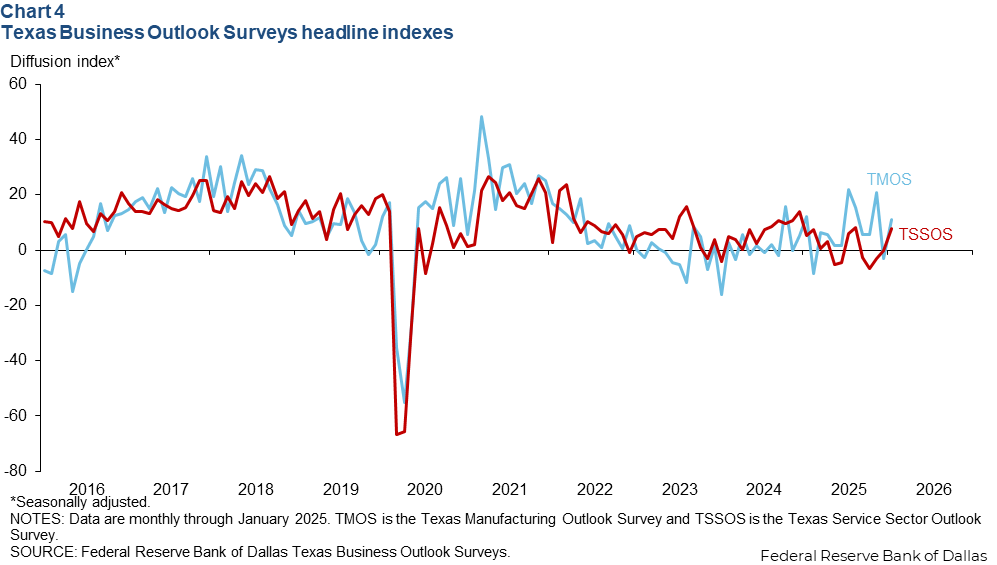
Texas Business Outlook Surveys
The Texas Business Outlook Surveys indicated a sharp rebound in manufacturing production and service sector revenue (Chart 4). The Texas Manufacturing Outlook Survey headline index rose to 11.2 in January from -3.0 in December, while the Texas Service Sector Outlook Survey index increased to 7.8 from 0.0, suggesting an acceleration in economic activity in January.
Consumer Price Index
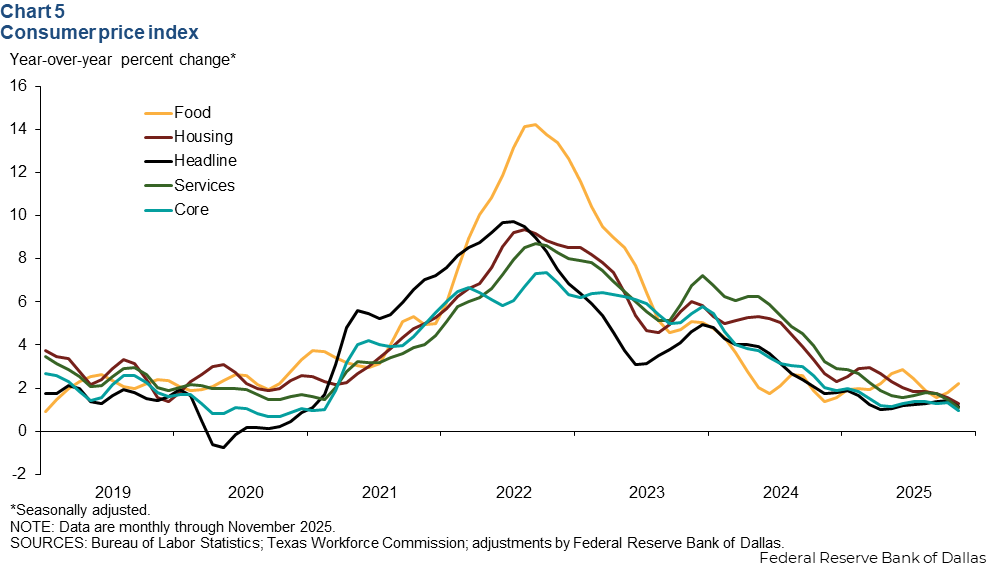
In November, the 12-month change in Texas headline CPI was 1.1 percent (Chart 5). Meanwhile, core CPI, which excludes food and energy, was up 1.0 percent. Housing and services inflation was modest as well, with housing prices up 1.3 percent and services up 1.1 percent, while food prices were up 2.2 percent.
NOTE: Data may not match previously published numbers due to revisions.
About Texas Economic Indicators
Questions or suggestions can be addressed to Diego Morales-Burnett. Texas Economic Indicators is published every month the week after Texas employment data are released.