Texas Economic Indicators

| Texas economy dashboard (February 2026) | |||
| Job growth (annualized) Nov. '25–Feb. '26 |
Unemployment rate |
Avg. hourly earnings |
Avg. hourly earnings growth y/y |
| 1.2% | 4.3% | $35.20 | 2.0% |
The Texas economy expanded modestly in February. Overall, employment growth slowed but remained positive. The labor force declined in February but was up from year-ago levels. The April Texas Business Outlook Surveys showed continued expansion in wages and benefits. Contract values rose in March, and sales tax revenue increased.
Labor market
Texas employment expands slowly
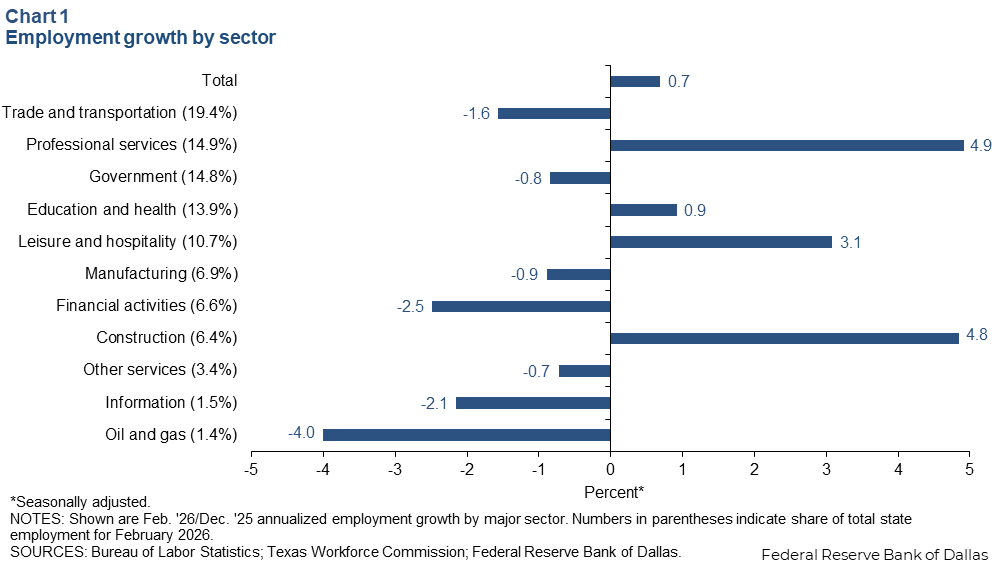
Texas employment grew an annualized 1.1 percent in January and 0.3 percent in February. Employment growth in the first two months of 2026 was mixed across major sectors, with robust gains seen in professional and business services, construction, and leisure and hospitality, but modest growth or declines in other sectors (Chart 1).
Labor force fell
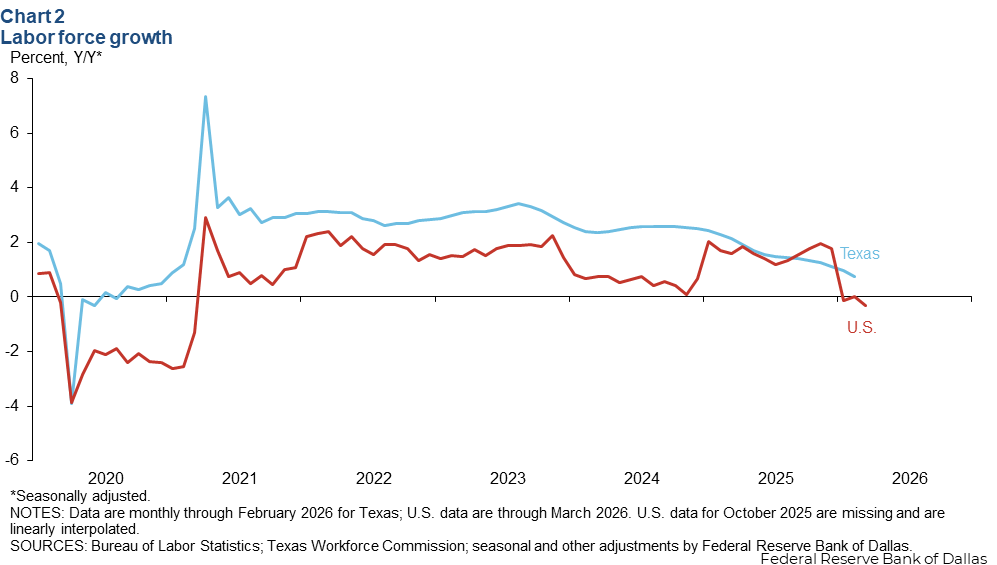
The Texas labor force declined an annualized 1.0 percent in February, while the nation saw a 2.8 percent decrease. The 12-month growth rate has been slowing in Texas since August 2023 but remained positive at 0.8 percent in February, exceeding the nation’s 0.3 percent year-over-year decline in March (Chart 2). A growing labor force is critical for a healthy economy as more workers support greater production of goods and services. Moreover, revenue from payroll and sales tax increases with labor force expansion, helping sustain government programs and offset other costs.
Texas Business Outlook Surveys
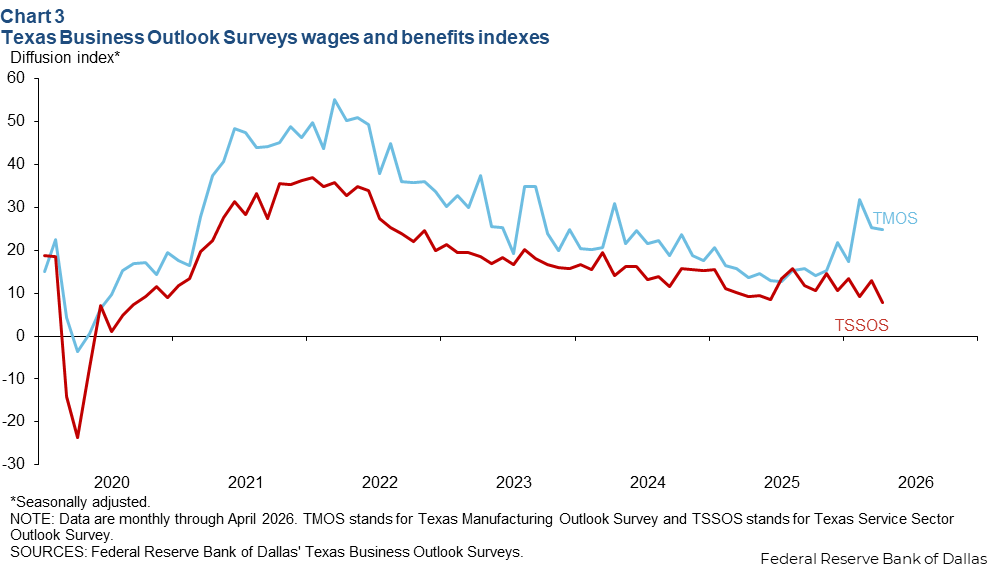
The Texas Business Outlook Surveys indicated continued growth in wages and benefits in April (Chart 3). The manufacturing survey’s wages and benefits index was 24.8 in April, lower than its previous reading of 25.2, but above its series average. The service sector’s wages and benefits index ticked down to 7.7 and was below its series average, indicative of below average wage growth.
Construction
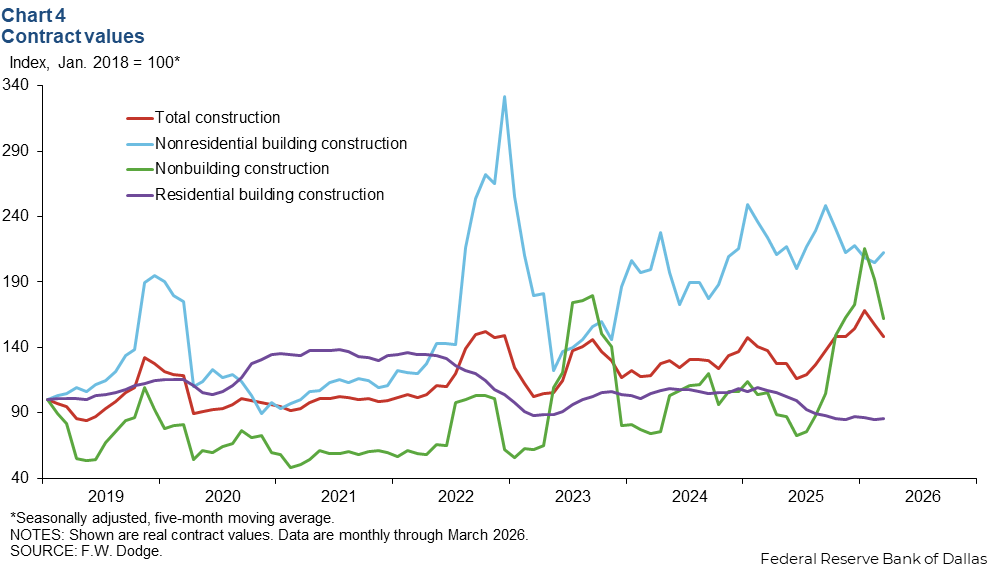
Construction contract values rose in March, while the five-month moving average fell 5.6 percent to $17.6 billion (Chart 4). The five-month moving average of nonbuilding contract values declined the most, falling 15.6 percent to $7.2 billion, while residential contract values increased 1.1 percent to $3.6 billion. Nonresidential contract values rose by 3.7 percent to $6.8 billion.
Consumer spending
Texas sales and use tax collections edged up 1.7 percent to a record high of $5.6 billion in March (Chart 5). Compared to a year ago, inflation-adjusted sales tax collections were up 5.3 percent, indicating rising consumer spending.

NOTE: Data may not match previously published numbers due to revisions.
About Texas Economic Indicators
Questions or suggestions can be addressed to Diego Morales-Burnett. Texas Economic Indicators is published every month the week after Texas employment data are released.