Agricultural Survey

First Quarter 2018
Survey Highlights
Bankers responding to the first-quarter survey noted conditions remained dry across a number of regions. Winter wheat conditions declined as a result. Lack of moisture limited pasture grazing of cattle in some regions. More cotton acres are expected this year in a couple of regions.
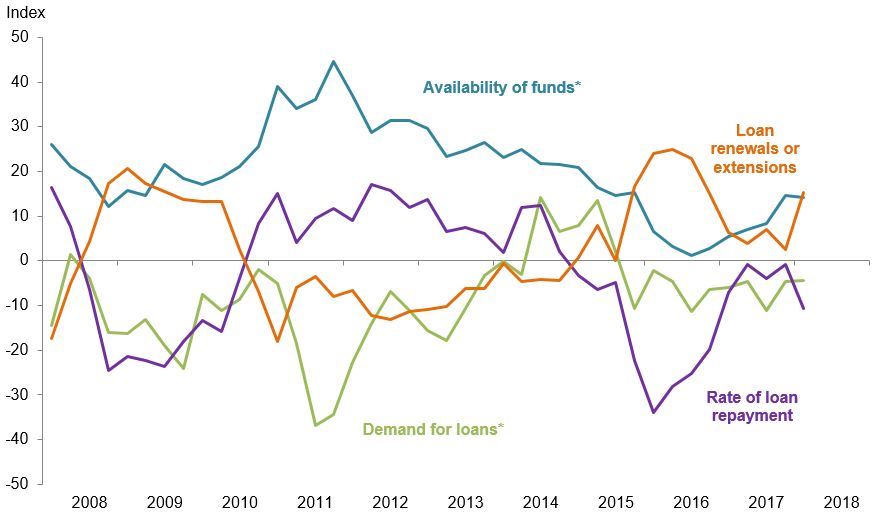
Demand for agricultural loans overall continued to decrease for a 10th consecutive quarter. Loan renewals and extensions accelerated, while the rate of loan repayment declined after stabilizing last quarter. Overall, the volume of non-real-estate farm loans was in line with a year ago, but the volume of farm real estate loans declined. The volume of operating loans continued to increase, and crop storage loans increased in the first quarter for the first time in three years. Volumes of other loan categories continued to decline in the first quarter (Figure 1).
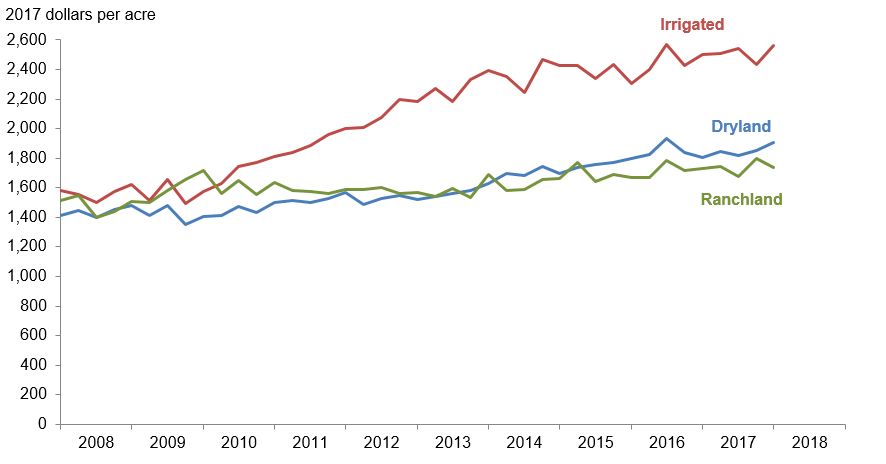
District real dryland and irrigated cropland values increased this quarter, while ranchland values decreased (Figure 2). According to bankers who responded in both this quarter and first quarter 2017, nominal dryland and ranchland values increased year over year in Texas (Table 1). Southern New Mexico respondents indicated cropland values increased while ranchland values decreased, and northern Louisiana respondents reported cropland and ranchland values all increased.
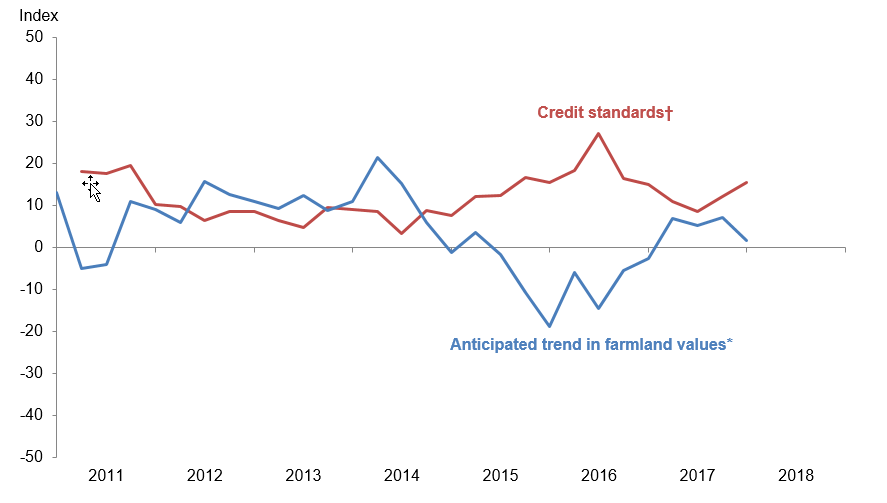
The anticipated trend in the farmland values index remained positive for a fourth consecutive quarter, suggesting respondents expect farmland values to trend up in the upcoming months. The credit standards index indicated continued tightening of standards on net (Figure 4).
Agricultural Survey is compiled from a survey of Eleventh District agricultural bankers, and data have been seasonally adjusted as necessary. Data were collected March 13–21, and 118 bankers responded to the survey.
Quarterly Comments

District bankers were asked for additional comments concerning agricultural land values and credit conditions. These comments have been edited for publication.
Region 1—Northern High Plains
- We need rain.
Region 2—Southern High Plains
- Drought is hurting our ag customers, and we are approaching the critical stage. Good, slow, soaking rain would help tremendously. I am happy to see positive movement for seed cotton to provide a safety net for our cotton farmers.
- We have had an increased number of carryover loans due to the quality of the cotton crop. We have started off the year extremely dry, and the forecast is not favorable.
- Our area is extremely dry. There has been no measurable rainfall for well over 100 days. Dry weather has caused winter wheat to struggle; therefore, winter cattle grazing has been cut extremely short with cattle being sold or transferred to grow yards. This is extremely expensive and not cost effective at this point. All farm operating renewals have been extremely tight with some producers having a carryover balance from the 2017 crop year.
- It has been an easier renewal season. Most rowcrop borrowers have either paid out or will once their cotton is ginned. There have been some exceptions stemming either from short crops due to early storm losses or from low cotton-fiber quality. Better cotton prices have helped. The recently announced ginning assistance support program will help as well. Stocker cattle have been challenged by poor wheat pasture for grazing. Cattle feeding margins have bounced back, at least for a while. Those who can will plant cotton instead of grain this year. If it doesn’t start raining, it won’t matter. Cotton insurance guarantees are decent at $0.85 including seed.
Region 3—Northern Low Plains
- Washington politics is creating very unstable market conditions. There are some pricing opportunities in cotton and livestock, but grains are still too low for much opportunity. Drought conditions continue to be the driving factor in planning and budgeting this year. If conditions persist, there will be fewer producers next year.
- Current drought conditions have everyone concerned. There has been no significant moisture since Oct. 1. Pasture and wheat conditions are poor. Very little dryland farm prep has been started. Irrigated producers are watering their cover crops to get a stand.
- Our county is in extreme drought and has been since September. Winter wheat is poor, and there is no stocker grazing to speak of. About half the wheat has not even come up yet. Stock ponds are drying up and grass is short. Without substantial rain soon, producers will be forced to downsize cow herds again.
- The last several months have been extremely dry. The majority of wheat pasture cattle were moved to grow yards. We were finally blessed with some good moisture. All pastures are recovering nicely.
Region 4—Southern Low Plains
- We had good cotton production, but it was a very expensive crop with no net revenue. Drought conditions are having a negative impact on livestock and wheat operations. Moisture is a great concern this year. Possible trade negotiations will directly impact agriculture, which could be good and bad.
Region 5—Cross Timbers
- Recent rains make for a brighter outlook after six months of very dry conditions.
Region 6—North Central Texas
- In the last week of February, our area got 12 to 17 inches of rain. We will have to see how it affects spring hay and crops.
Region 7—East Texas
- Corn planting is in full swing. Cotton acreage across the area is expected to be 10 to 15 percent higher. Cold and dry conditions until recently hampered winter grazing prospects. As a result, hay inventories are virtually depleted. A late and extended cold period could be costly.
Region 8—Central Texas
- Oil field activity has slowly returned to our area, with several mergers and sellouts being noted, as well as new drilling and leasing in some areas. Rural land with wildlife is still selling the best, with a slowdown in commercial loan requests. Ranchers are watching the pricing on spring calves to determine how bullish or bearish they will be this spring in buying cattle. The biggest single factor for all of the agriculture in our area will be rain in the coming months. Most people have run through old hay supplies and are anxious to start making new hay and to see green grass again. The rains we had were helpful, but more is needed in the coming months and summertime. Little or no corn has been planted yet due to wet field conditions. The cold winter should help the fruit trees and the fall pecan harvest if rains continue through the spring and summer.
- We have ample moisture going into spring. Winter grasses and grains are looking good for grazing and haying later in the season.
Region 9—Coastal Texas
- Land with the agricultural property tax exemption is generally selling for an average of $3,000 an acre. Smaller tracts (under a 100 acres) sell for more, and larger tracts generally sell for less. Additionally, properties with greater recreational value sell for more per acre. In general, land is not being valued using agricultural production as the primary valuation metric. Recreational usage is a significant factor.
Region 11—Trans-Pecos and Edwards Plateau
- Ranchers are having to bear higher feed costs as ranchland is extremely dry.
- Livestock prices are good across the board. Future expectations continue to be driven by rainfall. Some areas recently received generous rainfall, but some areas continue to be shorted. Like most years, this is when moisture is expected, but if it does not rain in a general pattern over the Edwards Plateau in the next couple of months, many operators will be faced with some difficult decisions with hot summer approaching. If rainfall rates are normal or above, this could be a very good year for our area with prices the way they are. Predators continue to be a major hurdle for sheep and goat operations as more and more places are sold off and taken out of production. Most new owners are not terribly concerned with predator control because it is not apparent to them on a daily basis how costly the problem is. However, when the deer herds begin to dwindle due to hogs, bobcats, foxes and coyotes, the issue will become more of a general concern to all landowners.
- Rainfall overall has been scattered and light in relation to what is needed. Dry conditions are or will become critical if good rainfall is not received soon. Sheep and goat markets are very good, with cattle markets being reasonable based on historic prices. Predators remain a huge, increasing problem for sheep and goat producers and continue to drive many more to cattle, when the country is more suited to sheep and goats. The number of wild hogs continues to be high, and efforts to control them and other predators remain very important.
Region 12—Southern New Mexico
- We have extremely dry conditions over our lending area. Dryland wheat will likely be a complete loss this year. Livestock sale prices have remained steady to better, and lots of livestock continue to come to market as dry range conditions persist.
- Conditions are very dry with no foreseeable change in weather patterns. The pecan harvest was very good with production approaching 4,000 pounds per acre. Cattle are coming off of alfalfa and forage pasture with preparations for the 2018 farm season. Commodity prices have improved slightly; however, they still remain somewhat compressed.
- No measurable precipitation for five months is concerning, which impacts irrigated farmers’ expenses and negatively impacts dryland yields as well.
Eleventh District Agricultural Data
Figures
|
Figure 1 Farm Lending Trends | |||||
|---|---|---|---|---|---|
| What changes occurred in non-real-estate farm loans at your bank in the past three months compared with a year earlier? | |||||
| Index | Percent reporting, Q1 | ||||
| 2017:Q4 | 2018:Q1 | Greater | Same | Less | |
| Demand for loans* | -4.6 | -4.3 | 13.5 | 68.7 | 17.8 |
| Availability of funds* | 14.6 | 14.1 | 16.2 | 81.7 | 2.1 |
| Rate of loan repayment | -0.8 | -10.6 | 6.2 | 77.0 | 16.8 |
| Loan renewals or extensions | 2.4 | 15.3 | 17.1 | 81.1 | 1.8 |
| What changes occurred in the volume of farm loans made by your bank in the past three months compared with a year earlier? | |||||
| Index | Percent reporting, Q1 | ||||
| 2017:Q4 | 2018:Q1 | Greater | Same | Less | |
| Non-real-estate farm loans | -2.4 | 0.0 | 12.4 | 75.2 | 12.4 |
| Feeder cattle loans* | -1.9 | -13.2 | 7.3 | 72.2 | 20.5 |
| Dairy loans* | -12.5 | -14.1 | 1.9 | 82.1 | 16.0 |
| Crop storage loans* | -2.3 | 2.9 | 11.1 | 80.7 | 8.2 |
| Operating loans | 3.3 | 7.8 | 16.5 | 74.8 | 8.7 |
| Farm machinery loans* | -15.1 | -9.6 | 8.9 | 72.6 | 18.5 |
| Farm real estate loans* | -10.0 | -3.5 | 9.6 | 77.3 | 13.1 |
| *Seasonally adjusted. NOTE: Survey responses are used to calculate an index for each item by subtracting the percentage of bankers reporting less from the percentage reporting greater. Positive index readings generally indicate an increase, while negative index readings generally indicate a decrease. |
|||||
| Figure 2 Real Land Values |
|---|
| Figure 3 Real Cash Rents |
|---|
|
Figure 4 Anticipated Farmland Values and Credit Standards | |||||
|---|---|---|---|---|---|
| What trend in farmland values do you expect in your area in the next three months? | |||||
| Index | Percent reporting, Q1 | ||||
| Anticipated trend in farmland values* | 2017:Q4 | 2018:Q1 | Up | Stable | Down |
| 7.1 | 1.6 | 7.4 | 86.8 | 5.8 | |
| What change occurred in credit standards for agricultural loans at your bank in the past three months compared with a year earlier?† | |||||
| Credit standards | 2017:Q4 | 2018:Q1 | Tightened | Same | Loosened |
| 12.1 | 15.5 | 15.5 | 84.5 | 0.0 | |
†Added to survey in second quarter 2011.
NOTE: Survey responses are used to calculate an index for each item by subtracting the percentage of bankers reporting less from the percentage reporting greater. Positive index readings generally indicate an increase, while negative index readings generally indicate a decrease.
Tables
Tables | ||||
| Table 1 Rural Real Estate Values—First Quarter 2018 |
||||
|---|---|---|---|---|
| Banks1 | Average value2 | Percent change in value from previous year3 | ||
| Cropland—Dryland | ||||
| District* | 95 | 1,928 | 9.1 | |
| Texas* | 81 | 1,957 | 9.2 | |
| 1 | Northern High Plains | 7 | 1,025 | 0.9 |
| 2 | Southern High Plains | 9 | 756 | 11.8 |
| 3 | Northern Low Plains* | 7 | 915 | 5.7 |
| 4 | Southern Low Plains* | 7 | 1,185 | 6.6 |
| 5 | Cross Timbers | 5 | 1,550 | 20.5 |
| 6 | North Central Texas | 15 | 2,870 | 7.9 |
| 7 | East Texas* | 4 | 2,889 | 6.7 |
| 8 | Central Texas | 10 | 3,730 | 6.3 |
| 9 | Coastal Texas | 7 | 2,543 | 16.0 |
| 10 | South Texas | 4 | 2,350 | 8.7 |
| 11 | Trans-Pecos and Edwards Plateau | 6 | 2,283 | 16.7 |
| 12 | Southern New Mexico | 6 | 425 | 14.3 |
| 13 | Northern Louisiana | 8 | 2,519 | 7.1 |
| Cropland—Irrigated | ||||
| District* | 69 | 2,596 | 2.0 | |
| Texas* | 54 | 2,385 | -0.3 | |
| 1 | Northern High Plains | 7 | 2,243 | -1.4 |
| 2 | Southern High Plains | 9 | 1,735 | -6.3 |
| 3 | Northern Low Plains* | 4 | 2,532 | 12.3 |
| 4 | Southern Low Plains | 5 | 1,600 | 13.5 |
| 5 | Cross Timbers | n.a. | n.a. | n.a. |
| 6 | North Central Texas | 4 | 2,938 | 18.5 |
| 7 | East Texas | 3 | 3,300 | 9.1 |
| 8 | Central Texas | 6 | 3,992 | 7.2 |
| 9 | Coastal Texas | 6 | 3,083 | 0.0 |
| 10 | South Texas | 4 | 2,925 | 6.5 |
| 11 | Trans-Pecos and Edwards Plateau | 4 | 3,963 | -1.4 |
| 12 | Southern New Mexico | 7 | 3,607 | 8.0 |
| 13 | Northern Louisiana | 8 | 3,625 | 10.4 |
| Ranchland | ||||
| District* | 108 | 1,757 | 3.8 | |
| Texas* | 93 | 2,089 | 4.5 | |
| 1 | Northern High Plains | 7 | 721 | -5.9 |
| 2 | Southern High Plains | 7 | 671 | 5.2 |
| 3 | Northern Low Plains | 6 | 992 | 17.3 |
| 4 | Southern Low Plains* | 7 | 1,138 | -12.4 |
| 5 | Cross Timbers | 6 | 1,742 | -0.7 |
| 6 | North Central Texas | 16 | 2,991 | 11.6 |
| 7 | East Texas | 11 | 2,891 | 8.2 |
| 8 | Central Texas | 11 | 5,595 | 8.2 |
| 9 | Coastal Texas | 6 | 2,717 | -3.2 |
| 10 | South Texas | 4 | 2,575 | 10.0 |
| 11 | Trans-Pecos and Edwards Plateau | 12 | 1,629 | -1.2 |
| 12 | Southern New Mexico | 6 | 321 | -12.1 |
| 13 | Northern Louisiana | 9 | 2,172 | 10.2 |
| *Seasonally adjusted. 1 Number of banks reporting land values. 2 Prices are dollars per acre, not adjusted for inflation. 3 Not adjusted for inflation and calculated using responses only from those banks reporting in both the past and current quarter. n.a.—Not published due to insufficient responses but included in totals for Texas and district. |
||||
| Table 2 Interest Rates by Loan Type |
|||||
|---|---|---|---|---|---|
| Feeder cattle | Other farm operating | Intermediate term | Long-term farm real estate | ||
| Fixed (average rate, percent) | |||||
| 2017:Q1 | 6.19 | 6.24 | 6.21 | 5.95 | |
| Q2 | 6.05 | 6.17 | 6.05 | 5.89 | |
| Q3 | 6.17 | 6.30 | 6.24 | 5.93 | |
| Q4 | 6.24 | 6.29 | 6.25 | 5.99 | |
| 2018:Q1 | 6.41 | 6.51 | 6.28 | 6.10 | |
| Variable (average rate, percent) | |||||
| 2017:Q1 | 5.73 | 5.74 | 5.80 | 5.47 | |
| Q2 | 5.75 | 5.81 | 5.74 | 5.47 | |
| Q3 | 5.92 | 5.96 | 5.95 | 5.64 | |
| Q4 | 5.91 | 5.93 | 5.97 | 5.65 | |
| 2018:Q1 | 6.18 | 6.17 | 6.04 | 5.75 | |
Back issues of Agricultural Survey »
For More Information
Questions regarding the Agricultural Survey can be addressed to Emily Kerr at emily.kerr@dal.frb.org.