Agricultural Survey

Survey highlights
Bankers responding to the fourth-quarter survey reported stable conditions in the agricultural industry in most regions of the Eleventh District. Weather supported strong cotton yields across most of the district, and the wheat crop is off to a mixed start depending on the rainfall in the region. Farmers are still contending with low commodity prices and inflated input costs that are continuing to rise. Some farmers are relying on government payments to persist, but for many the assistance will arrive too late. Ranchers continue to do significantly better than farmers as cattle prices remain elevated.
“Commodity prices continue to slump, making profitability more difficult especially in high input crops like rice and cotton,” noted one survey participant. Farmers are looking for alternative sources of income, as reported by a commenter who said: “Many producers are looking to livestock or hunting to help with crop production revenue shortfalls.” Despite a recently announced farm relief package, a respondent reported, “Some farm relief from government payments are on the horizon but may be too little too late for several operators.” Another commented, “Some farmers will likely not make it.”
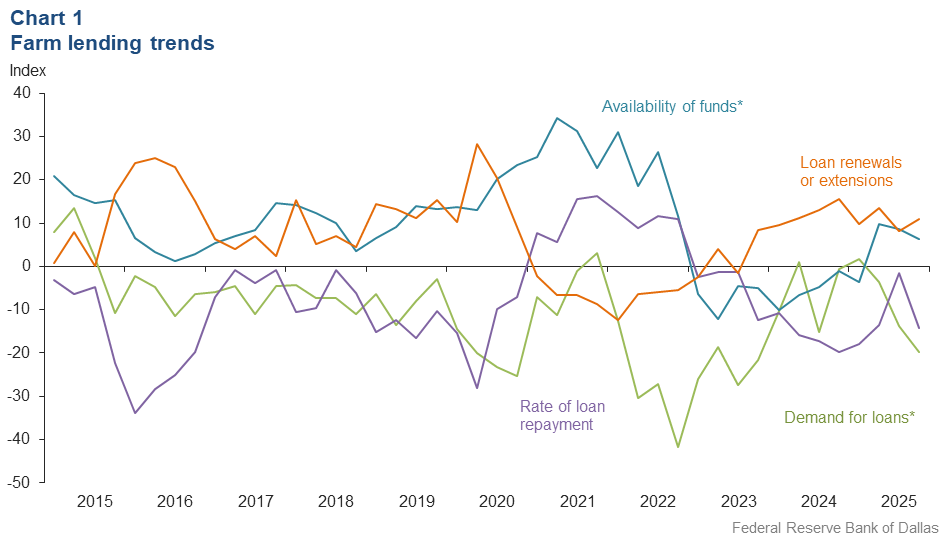
Demand for agricultural loans continued to decline in the fourth quarter. Availability of funds increased. The rate of loan repayment plummeted after almost stabilizing in the third quarter. Loan renewals or extensions continued to rise. Except for operating and feeder cattle loans, loan volume was down for all remaining categories compared with a year ago (Chart 1).
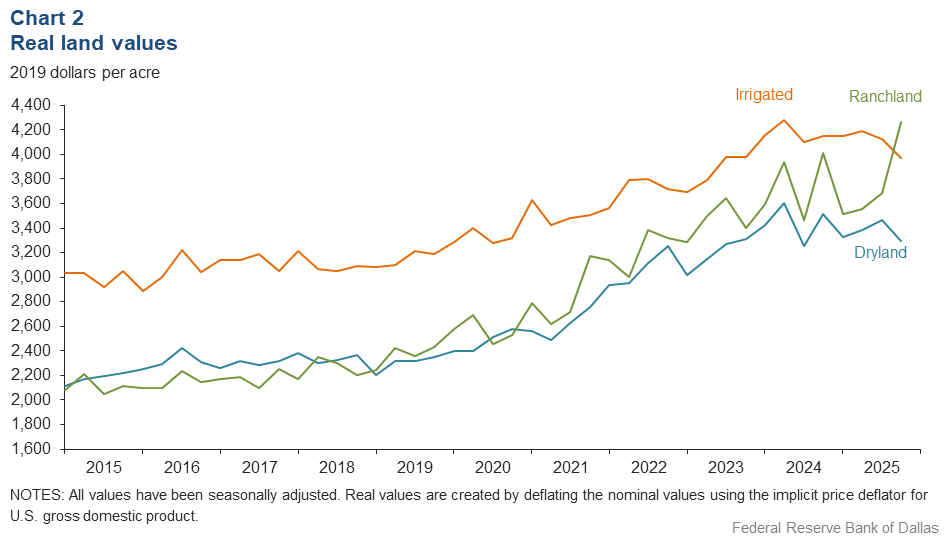
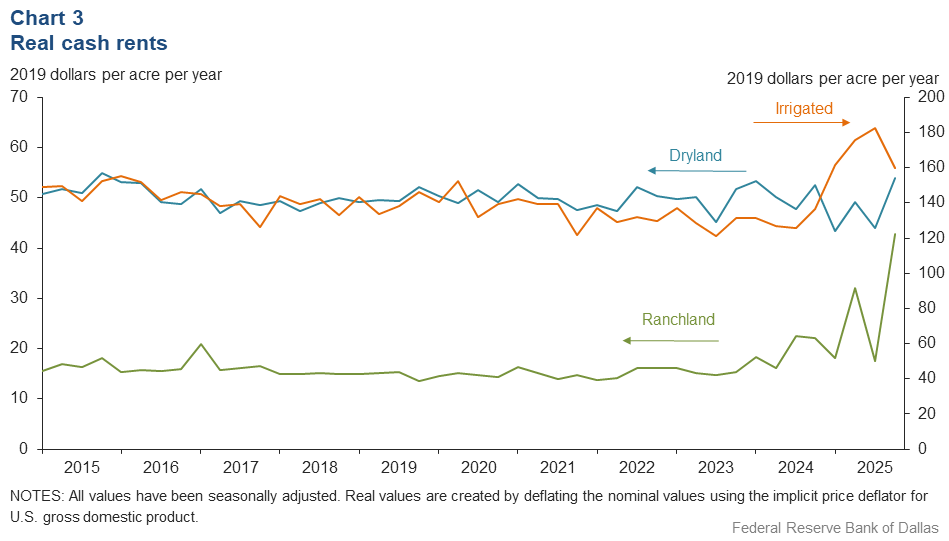
Real land values for ranchland increased, but values declined for dryland and irrigated land this quarter (Chart 2). Surprisingly, in the district, dryland and irrigated land values grew compared to last year, but ranchland values declined year over year (Table 1). In the fourth quarter 2025, real cash rents rose for ranchland and dryland land but were down for irrigated land (Chart 3).
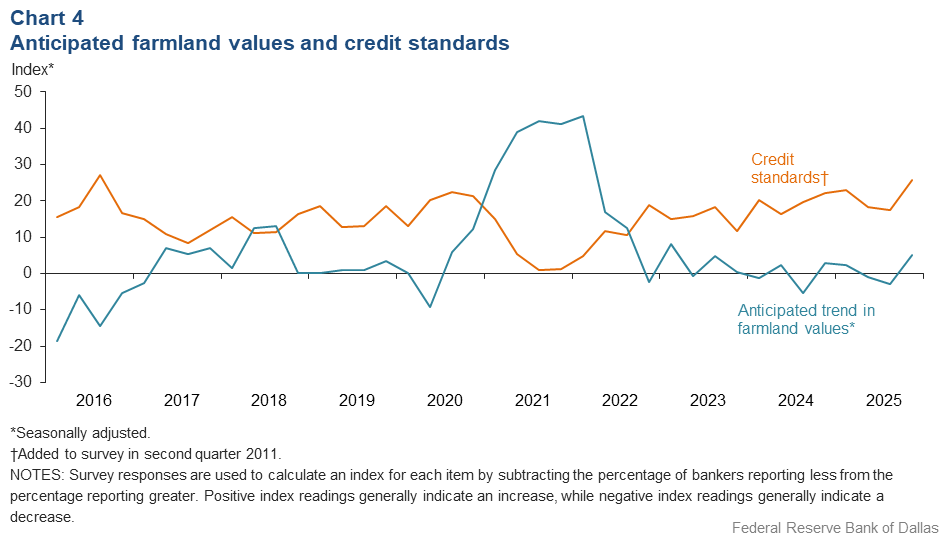
The anticipated trend in the farmland values index increased in the fourth quarter. This implies respondents expect farmland values to increase. A few respondents noted the increased demand for farmland for non-agricultural purposes. The credit standards index showed an increase in credit tightening at an elevated pace as compared to the third quarter (Chart 4). Respondents reported interest rates declines for all types in the current quarter (Table 2).
Next release: March 23, 2026
Agricultural Survey is compiled from a survey of Eleventh District agricultural bankers, and data have been seasonally adjusted as necessary. Data were collected December 2–10, and 58 bankers responded to the survey.
Quarterly comments

District bankers were asked for additional comments concerning agricultural land values and credit conditions. Some comments have been edited for grammar and clarity.
- Cotton production exceeded expectations. The price is below production costs, so cotton acreage in 2026 will be down significantly. Recent rains have the wheat crop off to a great start. Cattle prices have dropped about $60 per cost per hundredweight (CWT) mostly due to reduced tariffs on beef. Cattle numbers and inventory in feedlots are alarmingly low, yet the market is declining.
- I expect to see farmland values drop somewhat with commodity prices being so low. Many producers are looking to livestock or hunting to help with crop production revenue shortfalls. It is a challenging time in farming.
- Recent good rains have lifted spirits. Cattle prices are still high. The wheat crop is behind [schedule] due to dry weather.
- November was exceptionally dry. Weather had no impact on the cotton harvest, production was very good with a majority of the crop, three-bales-plus on dryland and irrigated. Calves are being held over to 2026 for tax reasons. Hay production was good with plenty of inventory on hand.
- Commodity prices continue to slump making profitability more difficult, especially in high input crops like rice and cotton.
- Agricultural land around Harris and surrounding counties is being bought up for development. Agriculture in Southeast Texas as we know it will not be around much longer. Between the depressed rice prices and urbanization, it’ll be a challenge for the industry to survive.
- Commodity prices coupled with inflated input costs have decreased overall farm incomes and slowed repayment speeds. Annual farm loan renewal packages have been slow to come in as margin shrinkage and uncertainty on future planting intentions have caused farm production borrowers to hesitate until there is a clearer picture. Some farm relief from government payments is on the horizon but may be too little too late for several operators who may need to liquidate some assets to bring more operating capital into the farm to generate cash flow for 2026 plans. Ranching economic dynamics remain strong with cheaper feed costs and stronger pricing. Even so, operating lines for stocker and feeder cattle have significantly increased although margins remain around the same dollar per head, posing more risk. Overall prices for farm and ranch land have still been on the increase, but demand has started to slow with increased interest rates. Most transactions in our markets involved 1031 exchange funds. Traditional purchases are very limited.
- Barns continue to hold carry-over alfalfa hay inventory, driven primarily by the reduced number of dairy cattle on feed in the area. Farming season is basically complete except for the pecan harvest, which is already underway. Cattle are on winter wheat, and the ranchers have enjoyed another robust year of cattle prices.
- With the Farm Service Agency tightening its loan standards, it will be somewhat more difficult to get guaranteed loans approved. Some farmers will likely not make it.
- Recent artificial intelligence construction projects are putting pressure on landowners to sell to developers and have taken sizable acreage out of production, etc. This will only continue to get worse as the project gets more intense.
Historical data
Historical data can be downloaded dating back to first quarter 2000.
Charts
Farm lending trends
What changes occurred in non-real-estate farm loans at your bank in the past three months compared with a year earlier?
| Index | Percent reporting, Q4 | ||||
| 2025:Q3 | 2025:Q4 | Greater | Same | Less | |
Demand for loans* | –13.8 | –19.8 | 5.2 | 69.8 | 25.0 |
Availability of funds* | 8.7 | 6.4 | 8.4 | 89.6 | 2.0 |
Rate of loan repayment | –1.6 | –14.3 | 3.6 | 78.6 | 17.9 |
Loan renewals or extensions | 8.1 | 10.9 | 12.7 | 85.5 | 1.8 | *Seasonally adjusted. |
What changes occurred in the volume of farm loans made by your bank in the past three months compared with a year earlier?
| Index | Percent reporting, Q4 | ||||
| 2025:Q3 | 2025:Q4 | Greater | Same | Less | |
Non–real–estate farm loans | –10.2 | –5.5 | 14.6 | 65.5 | 20.0 |
Feeder cattle loans* | –4.1 | 5.6 | 20.8 | 64.0 | 15.2 |
Dairy loans* | –13.7 | –13.6 | 0.2 | 86.0 | 13.8 |
Crop storage loans* | –5.3 | –5.9 | 3.5 | 87.1 | 9.4 |
Operating loans | 11.3 | 1.9 | 16.7 | 68.5 | 14.8 |
Farm machinery loans* | –21.5 | –25.4 | 4.0 | 66.6 | 29.4 |
Farm real estate loans* | –9.0 | –14.3 | 5.3 | 75.1 | 19.6 | *Seasonally adjusted. NOTES: Survey responses are used to calculate an index for each item by subtracting the percentage of bankers reporting less from the percentage reporting greater. Positive index readings generally indicate an increase, while negative index readings generally indicate a decrease. |
Real land values
Real cash rents
Anticipated farmland values and credit standards
What trend in farmland values do you expect in your area in the next three months?
| Index | Percent reporting, Q3 | ||||
| 2025:Q3 | 2025:Q4 | Up | Same | Down | |
| Anticipated trend in farmland values* | –2.8 | 5.2 | 12.4 | 80.4 | 7.2 |
| *Seasonally adjusted. | |||||
What change occurred in credit standards for agricultural loans at your bank in the past three months compared with a year earlier?
| 2025:Q3 | 2025:Q4 | Up | Same | Down | |
| Credit standards | 17.5 | 25.9 | 27.6 | 70.7 | 1.7 |
Tables
Rural real estate values—fourth quarter 2025
| Banks1 | Average value2 | Percent change in value from previous year3 | ||
Cropland–Dryland | ||||
District* | 47 | 3,410 | 5.7 | |
Texas* | 41 | 3,490 | 5.6 | |
1 | Northern High Plains | 6 | 1,204 | –1.6 |
2 | Southern High Plains | 6 | 1,450 | 0.6 |
3 | Northern Low Plains* | n.a. | n.a. | n.a. |
4 | Southern Low Plains* | 5 | 2,210 | 4.8 |
5 | Cross Timbers | 3 | 4,967 | –1.3 |
6 | North Central Texas | 3 | 6,333 | 5.6 |
7 | East Texas* | n.a. | n.a. | n.a. |
8 | Central Texas | 7 | 7,079 | 28.7 |
9 | Coastal Texas | n.a. | n.a. | n.a. |
10 | South Texas | 3 | 3,067 | 0.0 |
11 | Trans–Pecos and Edwards Plateau | n.a. | n.a. | n.a. |
12 | Southern New Mexico | n.a. | n.a. | n.a. |
13 | Northern Louisiana | 4 | 4,000 | 9.5 |
Cropland–Irrigated | ||||
District* | 41 | 4,111 | 1.2 | |
Texas* | 35 | 3,339 | –1.6 | |
1 | Northern High Plains | 6 | 3,208 | –1.2 |
2 | Southern High Plains | 5 | 2,450 | –3.9 |
3 | Northern Low Plains* | n.a. | n.a. | n.a. |
4 | Southern Low Plains | 5 | 3,450 | 3.1 |
5 | Cross Timbers | 3 | 5,833 | 0.0 |
6 | North Central Texas | 3 | 7,667 | 0.0 |
7 | East Texas | n.a. | n.a. | n.a. |
8 | Central Texas | 4 | 6,375 | 2.9 |
9 | Coastal Texas | n.a. | n.a. | n.a. |
10 | South Texas | 3 | 4,500 | 3.0 |
11 | Trans–Pecos and Edwards Plateau | n.a. | n.a. | n.a. |
12 | Southern New Mexico | n.a. | n.a. | n.a. |
13 | Northern Louisiana | 4 | 5,375 | 3.5 |
Ranchland | ||||
District* | 49 | 4,410 | –2.1 | |
Texas* | 42 | 5,250 | –2.2 | |
1 | Northern High Plains | 6 | 1,117 | –13.6 |
2 | Southern High Plains | 5 | 1,220 | –4.5 |
3 | Northern Low Plains | n.a. | n.a. | n.a. |
4 | Southern Low Plains* | 5 | 2,491 | 6.7 |
5 | Cross Timbers | 3 | 5,250 | 0.0 |
6 | North Central Texas | 3 | 7,000 | 7.7 |
7 | East Texas | 5 | 4,160 | –23.3 |
8 | Central Texas | 6 | 12,417 | 13.5 |
9 | Coastal Texas | n.a. | n.a. | n.a. |
10 | South Texas | 3 | 3,433 | 6.2 |
11 | Trans–Pecos and Edwards Plateau | n.a. | n.a. | n.a. |
12 | Southern New Mexico | 3 | 783 | 0.0 |
13 | Northern Louisiana | 4 | 3,313 | 5.1 |
| *Seasonally adjusted. 1 Number of banks reporting land values. 2 Prices are dollars per acre, not adjusted for inflation. 3 Not adjusted for inflation and calculated using responses only from those banks reporting in both the past and current quarter. n.a.—Not published due to insufficient responses but included in totals for Texas and district. |
||||
Interest rates by loan type—fourth quarter 2025
| Feeder cattle | Other farm operating | Intermediate term | Long-term farm real estate | Fixed (average rate, percent) |
2024:Q4 | 8.72 | 8.77 | 8.54 | 8.18 |
2025:Q1 | 8.63 | 8.59 | 8.26 | 7.94 |
2025:Q2 | 8.51 | 8.53 | 8.20 | 7.88 |
2025:Q3 | 8.35 | 8.30 | 8.11 | 7.84 |
2025:Q4 | 8.06 | 8.06 | 7.87 | 7.38 | Variable (average rate, percent) |
2024:Q4 | 8.82 | 8.82 | 8.59 | 8.20 |
2025:Q1 | 8.67 | 8.58 | 8.39 | 8.02 |
2025:Q2 | 8.48 | 8.49 | 8.12 | 7.96 |
2025:Q3 | 8.45 | 8.38 | 8.09 | 7.76 |
2025:Q4 | 8.07 | 8.12 | 7.92 | 7.54 |
For More Information
Questions regarding the Agricultural Survey can be addressed to Mariam Yousuf at Mariam.Yousuf@dal.frb.org.