Agricultural Survey

Second Quarter 2018
Survey Highlights
Bankers responding to the second-quarter survey noted continuing drought conditions across many regions of the Eleventh District. Lack of moisture continues to put pressure on pasture grazing for cattle in many regions, and hay inventories were reported as being low. Many respondents noted wheat and corn crops were suffering due to extreme heat.
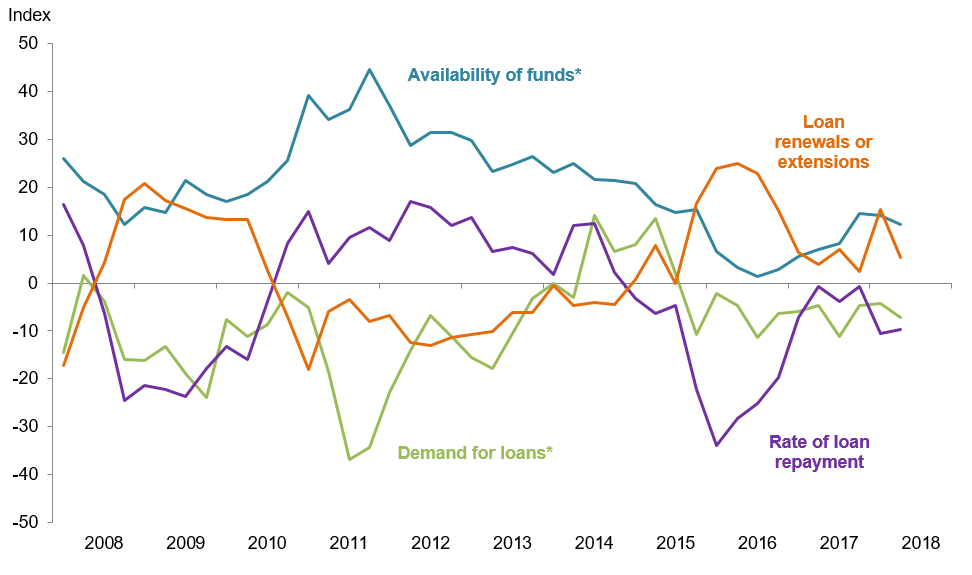
Demand for agricultural loans overall decreased for an 11th consecutive quarter. Loan renewals and extensions rose but at a slower pace, while the rate of loan repayment continued to decline. Overall, the volume of non-real-estate farm loans fell compared with a year ago, as did the volume of farm real estate loans. The volume of operating loans flattened out, and feeder cattle loans stabilized after nearly three years of decline. Volumes of all other loan categories continued to decline in the second quarter (Figure 1).
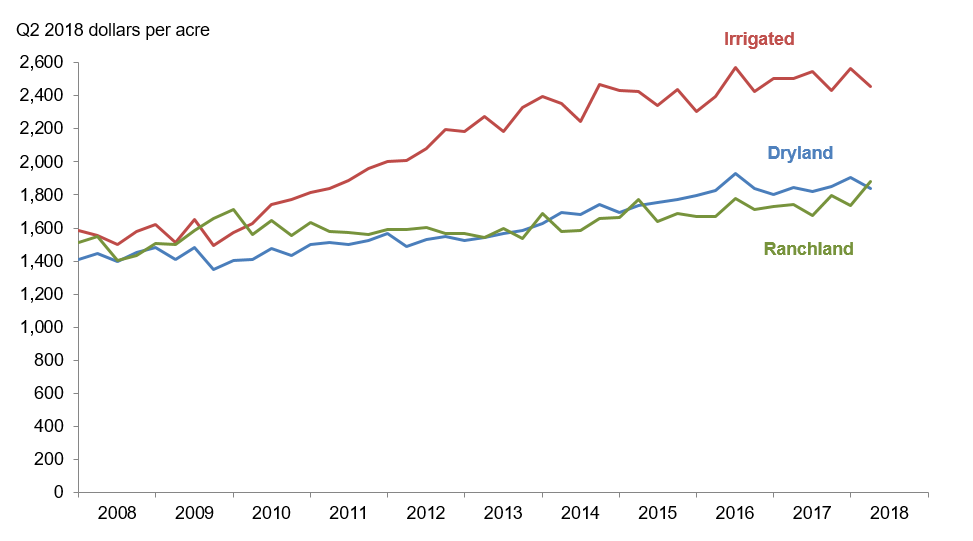
District real ranchland values surged this quarter, while dryland and irrigated cropland values declined (Figure 2). According to bankers who responded in both this quarter and second quarter 2017, nominal dryland and ranchland values increased year over year in Texas (Table 1). Southern New Mexico respondents indicated cropland values increased while ranchland values decreased, and northern Louisiana respondents reported cropland and ranchland values all increased.
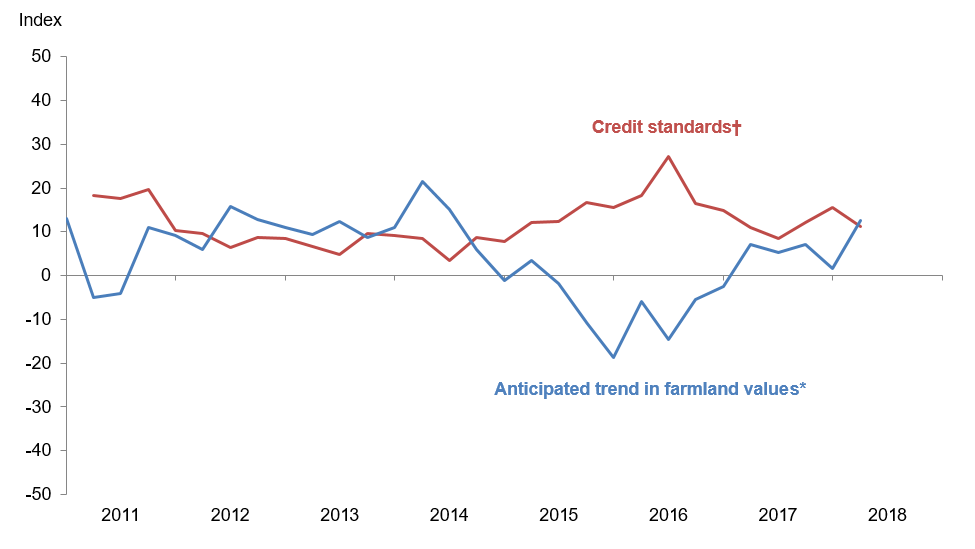
The anticipated trend in the farmland values index rose to its highest level since mid-2014, suggesting respondents expect farmland values to trend up in the upcoming months. The credit standards index indicated continued tightening of standards on net (Figure 4).
Quarterly Comments

District bankers were asked for additional comments concerning agricultural land values and credit conditions. These comments have been edited for publication.
Region 1—Northern High Plains
- Many borrowers’ incomes were less than expected as all the 2017 cotton crop has been ginned. Quality issues reduced the price substantially under projections. The area continues to be in extreme drought with little chance of rain.
- There are extreme drought and dangerous fire conditions.
Region 2—Southern High Plains
- Drought conditions are the major problems in our area. Future prices for our commodities are looking favorable currently if we are able to produce the product. Cattle are having to be supplemented. Hopefully, we will receive needed moisture soon and often.
- Land sales have been very limited—mostly on Conservation Reserve Program land purchased for use in irrigated organic peanut production.
- In most areas, dryland cotton is nonexistent. With the high temperatures and lack of rain, we are struggling to keep enough moisture to get irrigated cotton up and going. We are anticipating many insurance claims to be filed. Unfortunately, in many cases, insurance does not cover the input costs.
- Crop prospects are being challenged by extreme heat and wind and almost no rainfall. Irrigated crops are having difficulties establishing a stand. Rain has fallen in brief, severe downbursts, most of which has run off. Dryland crops will be few and far between. Grazing is almost all depleted, with the decision to cull or to feed looming. Hay supplies are becoming scarce but have been augmented by the baling of wheat. One bright spot has been the big run-up in cotton prices. If these prices hold, those who can stay up with irrigation will be rewarded as will producers who fail their crops for insurance.
Region 3—Northern Low Plains
- Drought conditions persist, although rain showers brought temporary relief in some areas. Livestock herds will have to be dramatically reduced, and dry land production crops will be a fraction of typical years. Any producers that are leveraged are likely candidates to not survive.
- Drought conditions are threatening the dryland cotton crop and forage crops. Pasture conditions are fair. Supplemental feeding of livestock is taking place on a limited basis, but without rain soon, that will be the norm. Herd reduction has not started, but stocker cattle were sold earlier than normal as the wheat played out early.
- Good rains saved cow and calf producers from another selloff. Most stock ponds are now full and grass is growing. Wheat fields are like we summer fallowed them, so we can only hope for good grazing and yields next year as most farmers are getting a head start on field prep.
Region 4—Southern Low Plains
- Conditions are very dry. Our wheat crop was a total loss. Pastures are in very poor shape. Several operators had to reduce herds to one-half or less. Tanks are very low. Cotton fields are generally very dry. Spotty rains in the eastern portion of the county have improved conditions. Most areas are starting to dry plant.
Region 5—Cross Timbers
- Recent dry and hot weather in our area is starting to take a toll on pastures and hay fields. The hay surplus we had a few months ago is mostly gone due to a hard winter. There has not been much change in land values, but a little less seems to be moving. Milk prices are down some, and feed costs are rising for dairymen.
- Pastures are extremely dry, and the lack of stock water is fast becoming a problem due to lack of spring rains and recent hot weather.
- Property values in our area have seen a substantial rise over the last two years.
Region 6—North Central Texas
- Unpredictable weather, weather extremes and poor crop prices continue to plague the local agricultural community.
- Our wheat crop was above average, and stocker calf performance was above average. A drought began in late April and has continued, and the corn crop is expected to be well below average. Crop insurance adjusters should arrive in the next seven to 10 days. We need rain very soon to give cotton crop a reasonable chance.
- After the flood in late February, we had an unusually cool and mild April. Now we have gone from virtually no spring-like weather into full-blown summer. I believe there will be a good hay crop this year.
- This is the beginning of a dry, hot summer, and crops are beginning to suffer.
Region 7—East Texas
- Row crops in the area are in excellent condition, corn and milo crops are being made and cotton is being watered. Early high temperatures and high winds have dried pastures and hay fields earlier than normal. Hay inventories are very low. Ranchers will have to make some critical decisions concerning the size of their herds and hay requirements if conditions persist.
Region 8—Central Texas
- Oilfield activity continues, with rigs drilling and leasing going on in some areas. Recent rains were spotty at best. High heat is starting to take its toll on corn and grasses. Cattle remain in fair condition, with prices still holding up across the board. Cow prices remain low as drought conditions in other areas of Texas and the country have caused more cows than normal to come into the sale barns. The two biggest concerns going forward for the next quarter will be rain and making hay.
Region 9—Coastal Texas
- Current drought conditions are a major concern for 2018 crop yields.
Region 11—Trans-Pecos and Edwards Plateau
- Rainfall in the Edwards Plateau has been a mixed bag in the last quarter. Fortunately, livestock prices have remained fairly strong, and the futures market still looks fairly good for producers. Predator control still ranks among the top worries for the sheep and goat producers of our area. Wool and mohair prices are strong at present for those who can keep herds alive, given the difficulty brought about from predators.
- Cattle market continues on a downward trend.
- Sheep and goat prices continue a cyclical decrease, with cattle prices being lower also, though all are above historic averages. Rainfall has been spotty, but most have at least received some, with some pasture conditions being very good for this time of year. With the higher temperatures, pasture conditions where rainfall has not been received are poor. Predator problems continue to increase, being significant in an ever-growing area.
Region 12—Southern New Mexico
- Commodity prices are holding steady. Rainfall is badly needed.
- We have had spotty rain over some of the trade area, but overall conditions are still extremely dry. There are still large runs at local livestock auctions as breeders trim herds because of dry range conditions. Wheat harvests will be limited, while corn planting is under irrigated conditions only.
- Range conditions remain very dry and, save a quality monsoon season, the late summer and early fall will see producers reducing cattle herd substantially. The forage crop shortfall over the winter has yielded improved prices for wheat, triticale and alfalfa. Dairy continues to struggle with low milk prices, compounded by increasing feed input costs.
Eleventh District Agricultural Data
Figures
|
Figure 1 Farm Lending Trends |
|||||
|---|---|---|---|---|---|
| What changes occurred in non-real-estate farm loans at your bank in the past three months compared with a year earlier? | |||||
| Index | Percent reporting, Q2 | ||||
| 2018:Q1 | 2018:Q2 | Greater | Same | Less | |
| Demand for loans* | -4.3 | -7.3 | 15.1 | 62.5 | 22.4 |
| Availability of funds* | 14.1 | 12.3 | 14.8 | 82.7 | 2.5 |
| Rate of loan repayment | -10.6 | -9.7 | 5.3 | 79.7 | 15.0 |
| Loan renewals or extensions | 15.3 | 5.3 | 9.7 | 86.0 | 4.4 |
| What changes occurred in the volume of farm loans made by your bank in the past three months compared with a year earlier? | |||||
| Index | Percent reporting, Q2 | ||||
| 2018:Q1 | 2018:Q2 | Greater | Same | Less | |
| Non-real-estate farm loans | 0.0 | -6.0 | 11.1 | 71.8 | 17.1 |
| Feeder cattle loans* | -13.2 | -0.6 | 11.0 | 77.4 | 11.6 |
| Dairy loans* | -14.1 | -15.3 | 2.2 | 80.3 | 17.5 |
| Crop storage loans* | 2.9 | -8.5 | 2.2 | 87.1 | 10.7 |
| Operating loans | 7.8 | 0.9 | 14.2 | 72.6 | 13.3 |
| Farm machinery loans* | -9.6 | -20.9 | 4.7 | 69.7 | 25.6 |
| Farm real estate loans* | -3.5 | -6.9 | 11.5 | 70.1 | 18.4 |
| *Seasonally adjusted. NOTE: Survey responses are used to calculate an index for each item by subtracting the percentage of bankers reporting less from the percentage reporting greater. Positive index readings generally indicate an increase, while negative index readings generally indicate a decrease. |
|||||
| Figure 2 Real Land Values |
|---|
| Figure 3 Real Cash Rents |
|---|
|
Figure 4 Anticipated Farmland Values and Credit Standards |
|||||
|---|---|---|---|---|---|
| What trend in farmland values do you expect in your area in the next three months? | |||||
| Index | Percent reporting, Q2 | ||||
| Anticipated trend in farmland values* | 2018:Q1 | 2018:Q2 | Up | Stable | Down |
| 1.6 | 12.6 | 14.5 | 83.6 | 1.9 | |
| What change occurred in credit standards for agricultural loans at your bank in the past three months compared with a year earlier?† | |||||
| Credit standards | 2018:Q1 | 2018:Q2 | Tightened | Same | Loosened |
| 15.5 | 11.1 | 11.1 | 88.9 | 0.0 | |
†Added to survey in second quarter 2011.
NOTE: Survey responses are used to calculate an index for each item by subtracting the percentage of bankers reporting less from the percentage reporting greater. Positive index readings generally indicate an increase, while negative index readings generally indicate a decrease.
Tables
Tables |
||||
| Table 1 Rural Real Estate Values—Second Quarter 2018 |
||||
|---|---|---|---|---|
| Banks1 | Average value2 | Percent change in value from previous year3 | ||
| Cropland—Dryland | ||||
| District* | 95 | 1,871 | 4.0 | |
| Texas* | 80 | 1,883 | 4.0 | |
| 1 | Northern High Plains | 9 | 956 | 2.5 |
| 2 | Southern High Plains | 8 | 763 | 8.6 |
| 3 | Northern Low Plains* | 8 | 834 | -1.6 |
| 4 | Southern Low Plains* | 6 | 982 | 10.1 |
| 5 | Cross Timbers | 6 | 1,733 | 4.5 |
| 6 | North Central Texas | 15 | 2,870 | 10.8 |
| 7 | East Texas* | 6 | 2,675 | 2.2 |
| 8 | Central Texas | 10 | 3,757 | -2.3 |
| 9 | Coastal Texas | 3 | 1,867 | 0.0 |
| 10 | South Texas | 4 | 2,250 | -2.3 |
| 11 | Trans-Pecos and Edwards Plateau | 5 | 2,740 | 10.6 |
| 12 | Southern New Mexico | 5 | 450 | 6.7 |
| 13 | Northern Louisiana | 10 | 2,845 | 4.2 |
| Cropland—Irrigated | ||||
| District* | 73 | 2,497 | 0.3 | |
| Texas* | 56 | 2,252 | -2.3 | |
| 1 | Northern High Plains | 9 | 2,119 | -0.4 |
| 2 | Southern High Plains | 9 | 1,634 | -0.9 |
| 3 | Northern Low Plains* | 5 | 2,149 | 5.8 |
| 4 | Southern Low Plains | 4 | 1,300 | 0.0 |
| 5 | Cross Timbers | 3 | 2,950 | 0.0 |
| 6 | North Central Texas | 5 | 2,910 | 4.8 |
| 7 | East Texas | 4 | 2,688 | -60.0 |
| 8 | Central Texas | 7 | 4,131 | -16.3 |
| 9 | Coastal Texas | n.a. | n.a. | n.a. |
| 10 | South Texas | 4 | 3,375 | 9.7 |
| 11 | Trans-Pecos and Edwards Plateau | 4 | 3,713 | 7.6 |
| 12 | Southern New Mexico | 7 | 3,300 | 1.9 |
| 13 | Northern Louisiana | 10 | 4,120 | 15.0 |
| Ranchland | ||||
| District* | 101 | 1,914 | 7.5 | |
| Texas* | 86 | 2,280 | 8.0 | |
| 1 | Northern High Plains | 8 | 694 | -7.5 |
| 2 | Southern High Plains | 6 | 850 | 30.0 |
| 3 | Northern Low Plains | 7 | 893 | 0.0 |
| 4 | Southern Low Plains* | 7 | 1,191 | -12.1 |
| 5 | Cross Timbers | 7 | 1,907 | 3.3 |
| 6 | North Central Texas | 15 | 3,000 | 7.8 |
| 7 | East Texas | 8 | 2,913 | 2.1 |
| 8 | Central Texas | 11 | 5,909 | 18.5 |
| 9 | Coastal Texas | 3 | 1,833 | 0.0 |
| 10 | South Texas | 4 | 2,550 | 6.8 |
| 11 | Trans-Pecos and Edwards Plateau | 10 | 2,205 | 9.1 |
| 12 | Southern New Mexico | 7 | 329 | -4.1 |
| 13 | Northern Louisiana | 8 | 2,169 | 2.3 |
| *Seasonally adjusted. 1 Number of banks reporting land values. 2 Prices are dollars per acre, not adjusted for inflation. 3 Not adjusted for inflation and calculated using responses only from those banks reporting in both the past and current quarter. n.a.—Not published due to insufficient responses but included in totals for Texas and district. |
||||
| Table 2 Interest Rates by Loan Type |
|||||
|---|---|---|---|---|---|
| Feeder cattle | Other farm operating | Intermediate term | Long-term farm real estate | ||
| Fixed (average rate, percent) | |||||
| 2017:Q2 | 6.05 | 6.17 | 6.05 | 5.89 | |
| Q3 | 6.17 | 6.30 | 6.24 | 5.93 | |
| Q4 | 6.24 | 6.29 | 6.25 | 5.99 | |
| 2018:Q1 | 6.41 | 6.51 | 6.28 | 6.10 | |
| Q2 | 6.55 | 6.57 | 6.50 | 6.24 | |
| Variable (average rate, percent) | |||||
| 2017:Q2 | 5.75 | 5.81 | 5.74 | 5.47 | |
| Q3 | 5.92 | 5.96 | 5.95 | 5.64 | |
| Q4 | 5.91 | 5.93 | 5.97 | 5.65 | |
| 2018:Q1 | 6.18 | 6.17 | 6.04 | 5.75 | |
| Q2 | 6.25 | 6.28 | 6.23 | 5.90 | |
Back issues of Agricultural Survey »
For More Information
Questions regarding the Agricultural Survey can be addressed to Christopher Slijk at christopher.slijk@dal.frb.org.