Agricultural Survey

Third Quarter 2018
Survey Highlights
Bankers responding to the third-quarter survey noted some easing of drought conditions across several regions of the Eleventh District. However, many contacts continued to note significant difficulties with dryland crop production due to lack of moisture. Hay inventories remain very tight, which continues to put pressure on livestock production.
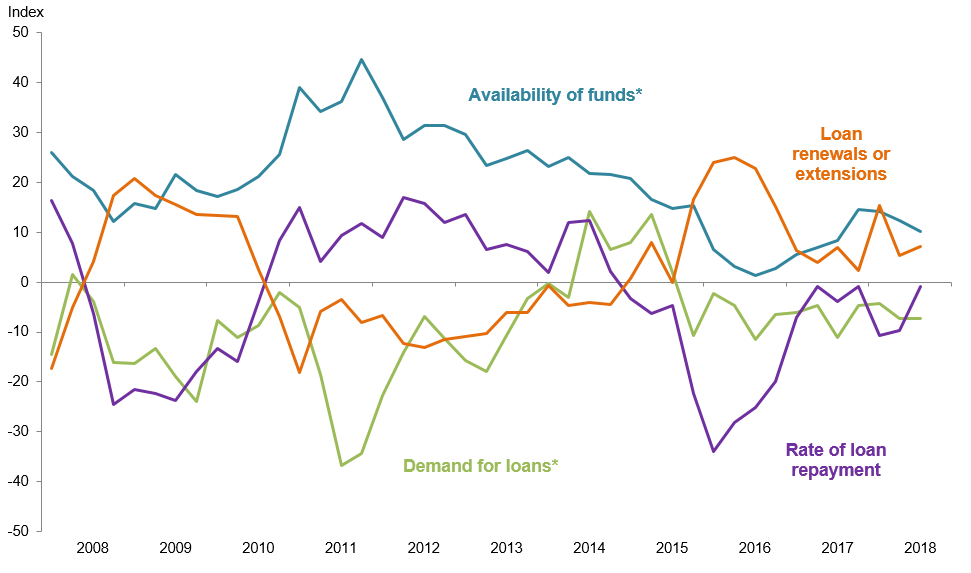
Demand for agricultural loans overall decreased for a 12th consecutive quarter. Loan renewals and extensions rose slightly, while the rate of loan repayment largely stabilized after declining in the prior two quarters. The volume of non-real-estate farm loans was slightly lower compared with a year ago, while the volume of farm real estate loans declined more significantly. The volume of operating loans declined modestly, while volumes of all other loans declined sharply in the third quarter (Figure 1).
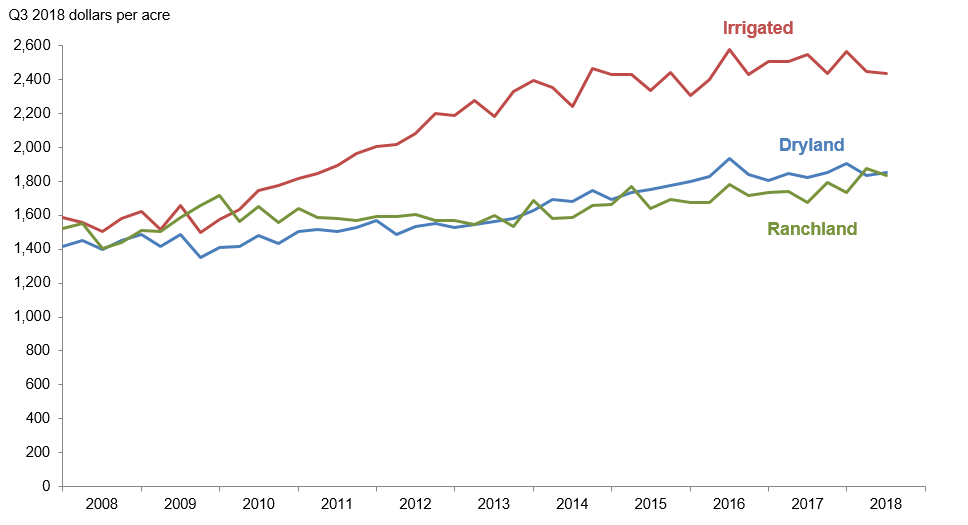
District dryland values ticked up this quarter, while irrigated cropland and ranchland values declined (Figure 2). According to bankers who responded in both this quarter and third quarter 2017, Texas nominal dryland and ranchland values increased year over year (Table 1). Southern New Mexico respondents indicated an increase in cropland and ranchland values, and northern Louisiana respondents reported an increase in dryland and ranchland values but a slight decline in irrigated cropland values.
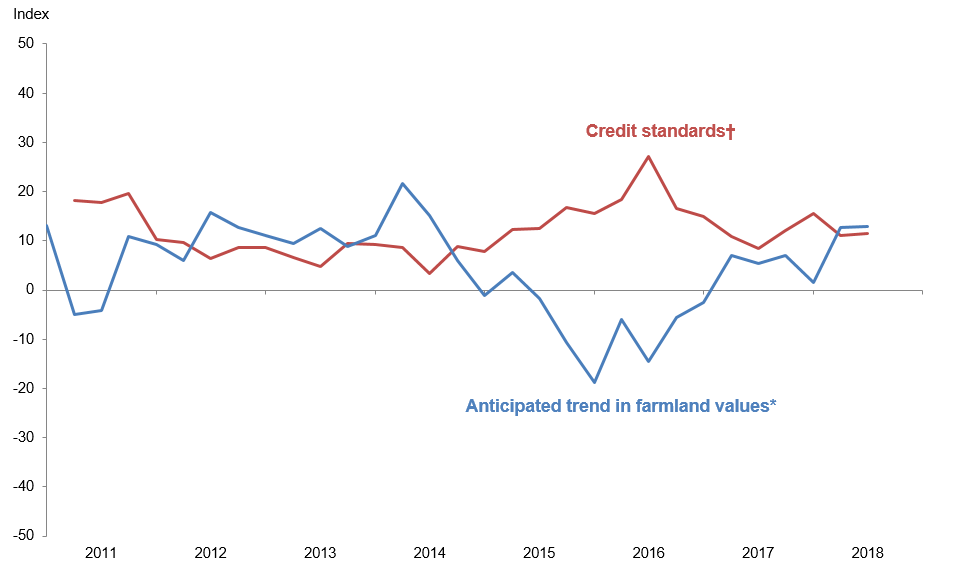
The anticipated trend in the farmland values index was positive for a sixth consecutive quarter, inching up to its highest value since 2014 and suggesting continued expectations for farmland values to trend up in the upcoming months. The credit standards index indicated continued tightening of standards on net (Figure 4).
Quarterly Comments

District bankers were asked for additional comments concerning agricultural land values and credit conditions. These comments have been edited for publication.
Region 1—Northern High Plains
- Recent rains have improved moisture conditions, but it has been too late for dryland crops, which are nonexistent from drought. Low commodity prices are making it a challenging year to reach profitability. Late rains have resulted in abundant late grass, but most stocking of livestock has been extremely light throughout the summer months. Overall dry conditions over the past quarter have resulted in decreased agricultural loan volume.
- Tariffs have created some volatility in the markets, especially cotton and cattle. Late-summer moisture should provide a good start to winter wheat. Corn looks good and will start harvesting by mid-September.
- Farmers are expecting corn yields to be near record levels across much of the High Plains. We still have areas that have received very little rain, but most are back to near normal.
Region 2—Southern High Plains
- Spotty rains have helped the cotton crop fill out the top portion of the plant, but only if you were under the cloud. There are still pockets that didn’t receive much rain. Prices still appear bullish.
- Sales of farm and ranch land during the past three months have been virtually nil. Drought in our trade area has almost precluded any trades.
- There are no dryland crops in the area. There were a few isolated drip-irrigated and pivot-irrigated cotton crops hailed out in mid-August. We have received timely rains over the last three weeks, and the temperature needs to stay warm to allow our cotton to continue to mature. Irrigated corn in the area looks good as well and should be in the 175-bushel range. Cotton is expected to make in the 2.5-to-3.5-bale range. Irrigated crops are satisfactory at this time.
Region 3—Northern Low Plains
- Our area is currently still in a drought. Dryland crops are in poor condition. Irrigated cotton and peanuts are finishing up. Peanut and cotton harvests are about to begin. Pasture conditions are fair where there have been showers, but the majority are in poor condition. Many calves have been sold earlier than normal.
- We have had good rainfall recently. We are going into fall in good shape. We should have wheat pasture this year. For the most part, things are looking up.
Region 4—Southern Low Plains
- Ninety percent of dryland cotton has failed due to drought. MPCI (multi-peril crop insurance) loss payments will be large. We are seeing continued cattle liquidation due to drought. Tank water is getting very low or is gone. Hay prices are high with tight supplies. Wheat planting has started in areas where some rain has fallen. Operators are being very cautious until good general rain comes. Pastures are in very poor shape going into the winter.
Region 5—Cross Timbers
- We recently received good rain in the area. Ranchers had been selling cattle. Hay prices are up due to dry weather and short supply.
- Rain has finally come in the last few days to much of our area after a dry and hot summer. Hopefully, this will help with the hay shortage we are experiencing, and pastures can recover and provide some good fall grazing. Also, conditions for planting wheat and oats improved tremendously.
- We have had a very dry and hot spring and summer. Stock water is a problem for many.
Region 6—North Central Texas
- A dry July and August hurt hay production.
- We are trying to move somewhat away from agriculture due to weather and risk. We are seeing a higher demand for real estate loans. We have had some beneficial rainfall in the last 10 days. We are hoping for one to two more cuttings of hay.
- A small tract of unimproved land, 15 acres, sold for $6,500 per acre recently.
Region 7—East Texas
- Last quarter was one of the driest ever recorded. Hay production was almost nil and was in high demand. Some calves were shipped early to give cows and pastures some relief. Corn harvest was average to good as was milo. Cotton continues to look like a good to average crop with very good prices. Rains as of this date may hurt cotton production, but it is too early to know. Good overall rains across this area should help hay producers with late cuttings.
Region 8—Central Texas
- The big thing right now is finding hay and getting rain. Ranchers have already started feeding old hay left over from last year, with everyone hoping for rain to make a fall crop. Hay will be in short supply. Rain is happening every day around places, but no big general rain has come yet, and the small showers are not helping at this time. If we don’t get a wet fall, it could be hard times for a lot of ranchers going into the winter months. Calf prices are still holding up well at local sale barns despite the large amount of cattle coming into the barns every week. Oil and gas fracking continues in the area, with several rigs still active in drilling as well. We are praying for rain.
- After a protracted dry spell put our area in a drought zone, we have received some beneficial rains with the promise of more. Hay and cattle producers are now worried by the onset of the armyworm. Cattle and oil prices seem to be holding steady.
Region 9—Coastal Texas
- There still is some lingering impact caused by Hurricane Harvey and the cold, wet winter on the cattle and pastures, but conditions appear to be getting better. The rice crop appears to be good but with less-than-desirable prices.
Region 11—Trans-Pecos and Edwards Plateau
- Some areas of the Edwards Plateau received welcome rainfall in the last quarter, but most areas remain behind the average for the year. As always, rain and prices dictate what kind of year agriculture will enjoy. Thus far, prices for cattle, sheep and goats have remained fairly strong despite a few recent slumps in the calf market. Mohair prices are good, wool sales have been from good to strong, and lambs and kids have sold very well through the summer. Things could be worse than they are at this time. All we need is more rain!
- Recent rains have really turned the pastures (and producers’ attitudes) around. Pastures are recovering nicely, and with the mostly general rains the first week of September, should be good going into fall and winter. There is even some talk about increasing livestock numbers, with prices now lower than earlier in the year. With continually increasing expenses, the challenge is to increase margins and profitability. Predators remain a problem, particularly in sheep and goat operations.
Region 12—Southern New Mexico
- Precipitation has been extremely spotty this year; thus, many producers are experiencing differing challenges even though they are close to each other geographically. It appears that most ranchers in our area made it through the summer without having to decrease their herds. Likewise, some dryland farmers are reporting potential bumper crops of milo, while others are not sure theirs will make it to harvest. All in all, though, the farm economy has been pretty stable.
- Corn silage harvest is currently underway, with yields on irrigated production good considering the dry weather. Livestock prices are highly variable, but there is supportive pricing for cow–calf producers with livestock feedlot performance in the red. Recent general rains will let most farmers sow their winter wheat. Dairy margins are tight, with no immediate relief in sight as production levels remain high.
Eleventh District Agricultural Data
Figures
|
Figure 1 Farm Lending Trends |
|||||
|---|---|---|---|---|---|
| What changes occurred in non-real-estate farm loans at your bank in the past three months compared with a year earlier? | |||||
| Index | Percent reporting, Q3 | ||||
| 2018:Q2 | 2018:Q3 | Greater | Same | Less | |
| Demand for loans* | -7.3 | -7.2 | 11.7 | 69.4 | 18.9 |
| Availability of funds* | 12.3 | 10.1 | 12.4 | 85.3 | 2.3 |
| Rate of loan repayment | -9.7 | -0.8 | 9.4 | 80.5 | 10.2 |
| Loan renewals or extensions | 5.3 | 7.1 | 11.0 | 85.0 | 3.9 |
| What changes occurred in the volume of farm loans made by your bank in the past three months compared with a year earlier? | |||||
| Index | Percent reporting, Q3 | ||||
| 2018:Q2 | 2018:Q3 | Greater | Same | Less | |
| Non-real-estate farm loans | -6.0 | -1.6 | 15.5 | 67.4 | 17.1 |
| Feeder cattle loans* | -0.6 | -13.1 | 8.2 | 70.4 | 21.3 |
| Dairy loans* | -15.3 | -17.8 | 0.0 | 82.2 | 17.8 |
| Crop storage loans* | -8.5 | -15.1 | 2.7 | 79.5 | 17.8 |
| Operating loans | 0.9 | -1.5 | 13.7 | 71.0 | 15.3 |
| Farm machinery loans* | -20.9 | -16.5 | 7.9 | 67.7 | 24.4 |
| Farm real estate loans* | -6.9 | -9.1 | 12.5 | 65.9 | 21.6 |
| *Seasonally adjusted. NOTES: Survey responses are used to calculate an index for each item by subtracting the percentage of bankers reporting less from the percentage reporting greater. Positive index readings generally indicate an increase, while negative index readings generally indicate a decrease. |
|||||
| Figure 2 Real Land Values |
|---|
| Figure 3 Real Cash Rents |
|---|
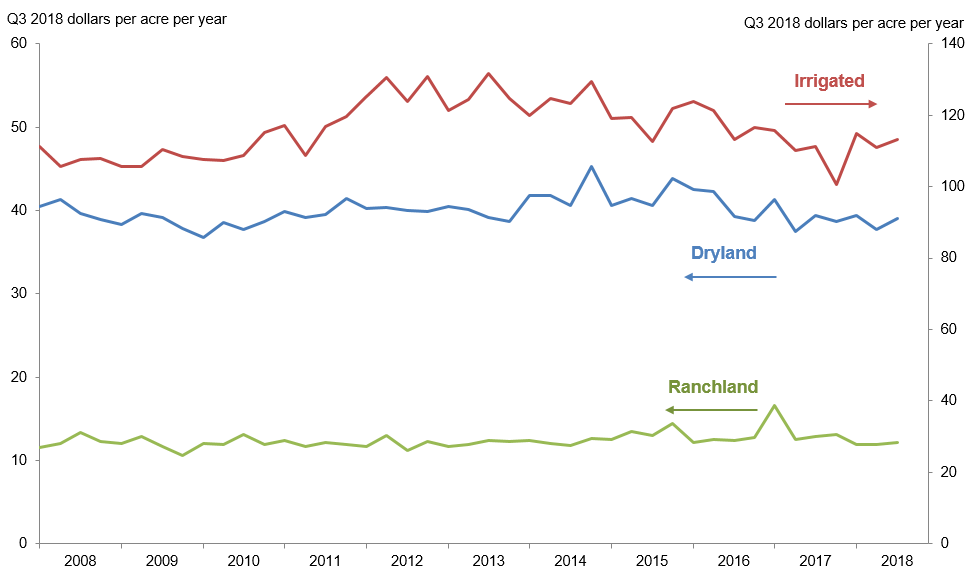
NOTES: All values have been seasonally adjusted. Real values are created by deflating the nominal values using the implicit price deflator for U.S. gross domestic product.
|
Figure 4 Anticipated Farmland Values and Credit Standards |
|||||
|---|---|---|---|---|---|
| What trend in farmland values do you expect in your area in the next three months? | |||||
| Index | Percent reporting, Q3 | ||||
| Anticipated trend in farmland values* | 2018:Q2 | 2018:Q3 | Up | Stable | Down |
| 12.6 | 13.0 | 15.1 | 82.8 | 2.1 | |
| What change occurred in credit standards for agricultural loans at your bank in the past three months compared with a year earlier?† | |||||
| Credit standards | 2018:Q2 | 2018:Q3 | Tightened | Same | Loosened |
| 11.1 | 11.5 | 12.3 | 86.9 | 0.8 | |
†Added to survey in second quarter 2011.
NOTES: Survey responses are used to calculate an index for each item by subtracting the percentage of bankers reporting less from the percentage reporting greater. Positive index readings generally indicate an increase, while negative index readings generally indicate a decrease.
Tables
Tables |
||||
| Table 1 Rural Real Estate Values—Third Quarter 2018 |
||||
|---|---|---|---|---|
| Banks1 | Average value2 | Percent change in value from previous year3 | ||
| Cropland—Dryland | ||||
| District* | 105 | 1,901 | 5.7 | |
| Texas* | 91 | 1,921 | 5.8 | |
| 1 | Northern High Plains | 10 | 940 | -0.3 |
| 2 | Southern High Plains | 12 | 735 | -2.9 |
| 3 | Northern Low Plains* | 7 | 845 | -4.6 |
| 4 | Southern Low Plains* | 7 | 1,040 | 8.1 |
| 5 | Cross Timbers | 8 | 1,744 | 4.5 |
| 6 | North Central Texas | 15 | 2,963 | 9.7 |
| 7 | East Texas* | 7 | 2,749 | 0.0 |
| 8 | Central Texas | 9 | 3,552 | 9.8 |
| 9 | Coastal Texas | 4 | 2,500 | 15.6 |
| 10 | South Texas | 4 | 2,300 | 4.5 |
| 11 | Trans-Pecos and Edwards Plateau | 8 | 2,313 | 5.7 |
| 12 | Southern New Mexico | 6 | 417 | 3.3 |
| 13 | Northern Louisiana | 8 | 2,731 | 4.0 |
| Cropland—Irrigated | ||||
| District* | 82 | 2,495 | 0.7 | |
| Texas* | 66 | 2,205 | -0.4 | |
| 1 | Northern High Plains | 10 | 2,035 | -4.4 |
| 2 | Southern High Plains | 12 | 1,650 | -4.8 |
| 3 | Northern Low Plains* | 4 | 2,413 | 2.7 |
| 4 | Southern Low Plains | 4 | 1,300 | -3.9 |
| 5 | Cross Timbers | 5 | 2,670 | 0.0 |
| 6 | North Central Texas | 6 | 3,175 | 10.9 |
| 7 | East Texas | 4 | 2,913 | 0.0 |
| 8 | Central Texas | 6 | 3,919 | 6.3 |
| 9 | Coastal Texas | 3 | 2,500 | 33.3 |
| 10 | South Texas | 4 | 2,950 | 3.2 |
| 11 | Trans-Pecos and Edwards Plateau | 8 | 3,165 | 7.6 |
| 12 | Southern New Mexico | 8 | 3,756 | 7.6 |
| 13 | Northern Louisiana | 8 | 4,094 | -1.4 |
| Ranchland | ||||
| District* | 116 | 1,880 | 5.6 | |
| Texas* | 100 | 2,250 | 5.5 | |
| 1 | Northern High Plains | 10 | 685 | -4.3 |
| 2 | Southern High Plains | 7 | 707 | 7.4 |
| 3 | Northern Low Plains | 7 | 836 | -8.7 |
| 4 | Southern Low Plains* | 7 | 1,110 | 1.0 |
| 5 | Cross Timbers | 9 | 1,928 | 5.7 |
| 6 | North Central Texas | 16 | 2,963 | 4.9 |
| 7 | East Texas | 11 | 2,736 | -4.9 |
| 8 | Central Texas | 9 | 6,000 | 15.1 |
| 9 | Coastal Texas | 5 | 2,620 | 12.8 |
| 10 | South Texas | 5 | 2,400 | 4.2 |
| 11 | Trans-Pecos and Edwards Plateau | 14 | 2,121 | 5.4 |
| 12 | Southern New Mexico | 8 | 278 | 10.7 |
| 13 | Northern Louisiana | 8 | 2,294 | 2.9 |
| *Seasonally adjusted. 1 Number of banks reporting land values. 2 Prices are dollars per acre, not adjusted for inflation. 3 Not adjusted for inflation and calculated using responses only from those banks reporting in both the past and current quarter. |
||||
| Table 2 Interest Rates by Loan Type |
|||||
|---|---|---|---|---|---|
| Feeder cattle | Other farm operating | Intermediate term | Long-term farm real estate | ||
| Fixed (average rate, percent) | |||||
| 2017:Q3 | 6.17 | 6.30 | 6.24 | 5.93 | |
| Q4 | 6.24 | 6.29 | 6.25 | 5.99 | |
| 2018:Q1 | 6.41 | 6.51 | 6.28 | 6.10 | |
| Q2 | 6.55 | 6.57 | 6.50 | 6.24 | |
| Q3 | 6.74 | 6.84 | 6.64 | 6.36 | |
| Variable (average rate, percent) | |||||
| 2017:Q3 | 5.92 | 5.96 | 5.95 | 5.64 | |
| Q4 | 5.91 | 5.93 | 5.97 | 5.65 | |
| 2018:Q1 | 6.18 | 6.17 | 6.04 | 5.75 | |
| Q2 | 6.25 | 6.28 | 6.23 | 5.90 | |
| Q3 | 6.48 | 6.48 | 6.43 | 6.02 | |
Back issues of Agricultural Survey »
For More Information
Questions regarding the Agricultural Survey can be addressed to Christopher Slijk at christopher.slijk@dal.frb.org.