Agricultural Survey

Second Quarter 2019
Survey Highlights
Bankers responding to the second-quarter survey reported overall weaker conditions across most regions of the Eleventh District. They noted that heavy rainfall in the quarter had mixed effects, with some corn crops benefiting but other crops, particularly cotton, negatively impacted. Prices continued to be seen as weak.
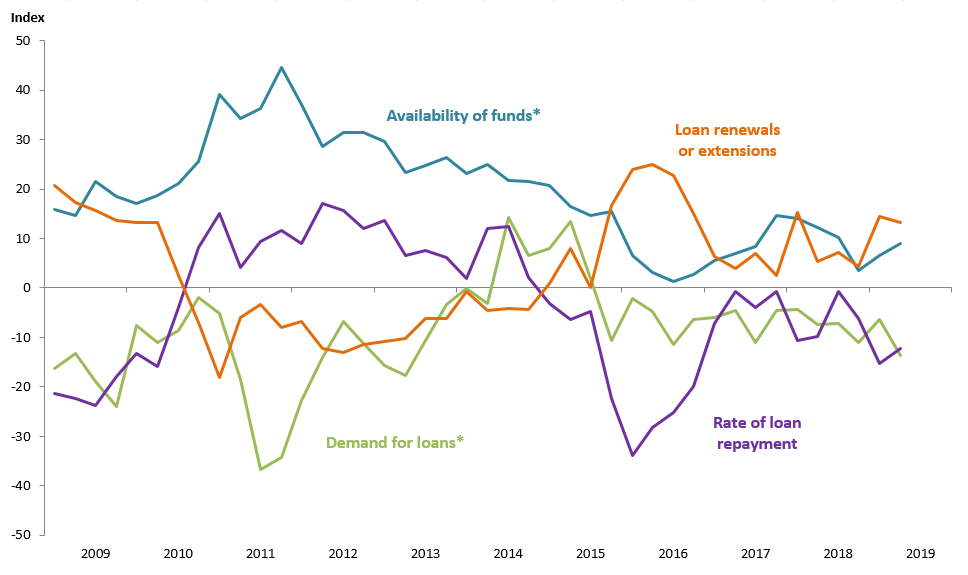
Demand for agricultural loans plummeted, with the loan demand index falling to its lowest reading in six years. Loan renewals and extensions increased, and the rate of loan repayment continued to decline. With the exception of operating loans, loan volume fell across all major categories compared with a year ago (Figure 1).
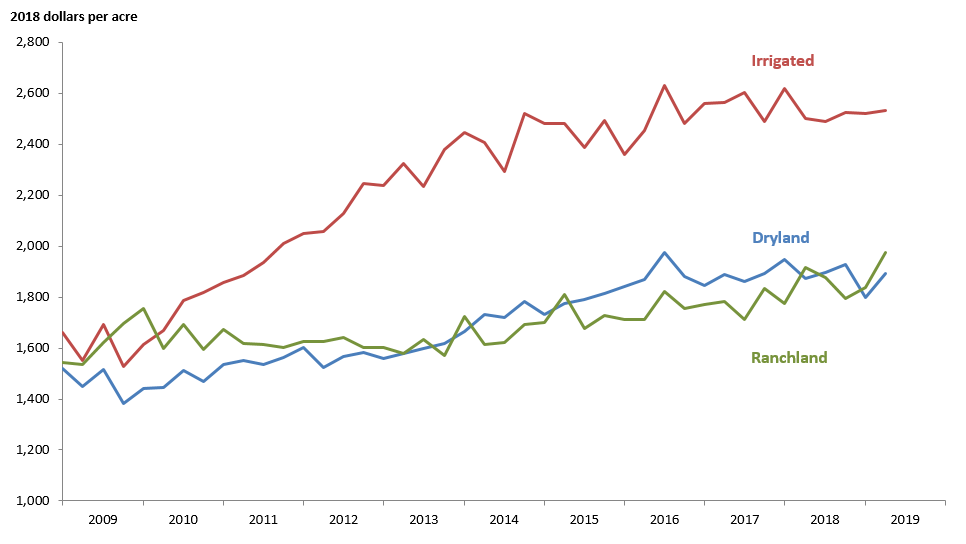
District ranchland and dryland values increased notably this quarter, while irrigated cropland values held steady (Figure 2). According to bankers who responded in both this quarter and second quarter 2018, nominal cropland and ranchland values increased year over year in Texas and northern Louisiana (Table 1). Southern New Mexico respondents indicated an increase in irrigated cropland values but a decline in dryland values.
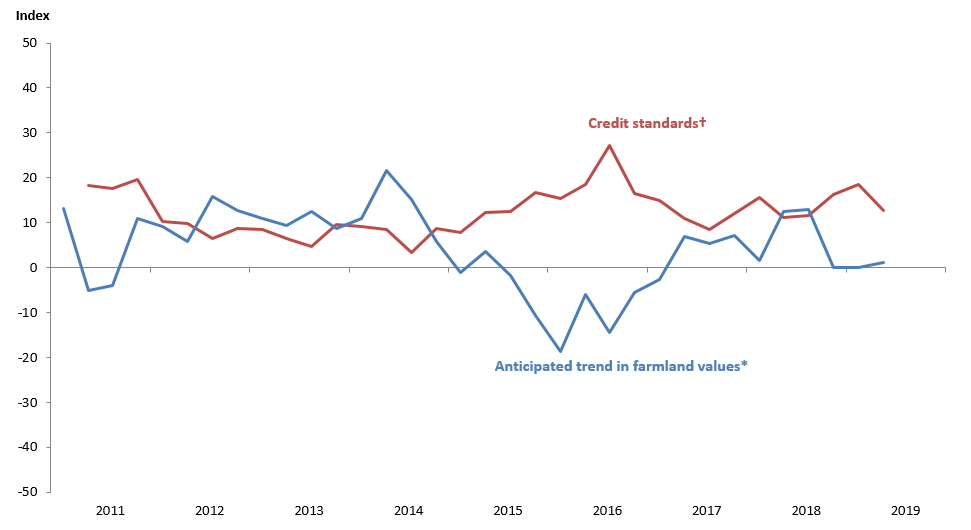
The anticipated trend in farmland values index was mostly flat for a third consecutive quarter, suggesting respondents expect farmland values to hold steady. The credit standards index fell slightly but remained elevated, indicating further tightening of standards on net (Figure 4).
A special set of questions on extreme weather events during the first half of 2019 reveals that a majority of agricultural banks saw modest or significant impacts to their lending areas (Table 3).
Quarterly Comments

District bankers were asked for additional comments concerning agricultural land values and credit conditions. These comments have been edited for publication.
Region 1—Northern High Plains
- Abundant rainfall has resulted in a good start for the corn crop, but the wet and cooler weather is hampering the cotton crop. The increase in corn prices is providing profit opportunity above what was initially anticipated for the year.
- Early summer rains have been a blessing to our community. We have seen a substantial drop in cattle prices in the last 45 days and hope that will correct before fall.
Region 2—Southern High Plains
- We are thankful for recent rains we have received as they will definitely help with our row crops and grass for livestock. Better prices for all agriculture products would be a positive.
- We’ve seen delays in planting due to unstable weather conditions and excessive rainfall. All crops are marginal stands or very young replant crops due to hail, wind and static electricity damage during normal planting dates. Crops will need warmer weather to generate needed heat units.
Region 3—Northern Low Plains
- Agriculture takes the brunt of the economic damage in the tariff war, with not much more than political jargon for compensation. If other industries/wage earners lost revenues at the same pace, there would be a different narrative.
- Cotton has a good start in some of the areas and is not up in others. We have between adequate moisture and too much moisture to plant. Pastures are in excellent condition. Cattle and cotton prices are depressed and a cause of concern.
Region 4—Southern Low Plains
- Wheat harvest, wheat hay bailing and cotton planting have been delayed due to excessive rains and cool, cloudy weather. Pasture conditions and tank water are the best in several years. Destruction of farmers’ liquidity and net worth continues at a strong pace. Seed prices did come down this year. Seed companies have fewer jackets and caps to give away.
Region 6—North Central Texas
- Low, low, low commodity prices and wet weather recently, and a combination of drought and wet weather in the past, have really hurt our farmers. Many are barely hanging on. The 2019 crop will either make or break many of our local farmers. These same conditions are also causing potential land buyers to take a “wait and see” attitude, as they are afraid the weather in this northeast Texas area is too unpredictable, particularly when combined with low crop prices.
- Excessive rainfall has hurt both ranchers and farmers.
- It is still raining; this is the second year in a row that the hay crop could be ruined. We have some customers taking preventive planting from the government. We have some farmers not planting crops and moving more into stocker cattle loans.
- Weather thus far in the growing season in West Texas has been detrimental, with torrential rains and hail. Moisture conditions are excellent but with the moisture coming from extreme weather—flooding, hail and wind— during a time that crops were very small. It has not been a good start to the growing season.
- The overall agricultural environment in Hunt County remains stressed due to continued wet conditions and overall weak agriculture market issues.
Region 7—East Texas
- Persistent wet field conditions continue to cause problems for row crop farmers in the Brazos Bottom area. There are reports of being unable to plant a cotton crop due to wet conditions. Corn and milo are satisfactory, with prospects for an average crop. The first hay cuttings are generally finished, and recent rains have helped boost prospects for an ideal second cutting. Yearling cattle being shipped are weighing considerably more than the contracted weight.
- Poultry seems to be doing better, while cattle prices are still a bit depressed. Extremely wet conditions are continuing to wreak havoc on farmers being able to get in hay meadows.
Region 8—Central Texas
- Summer is coming as weather starts to heat up in June. However, we still have moisture, and this has been the best May/June period we have had in a few years. First cuttings of hay are almost complete; corn is finally coming on better, but heat will slow it down going forward. Cattle appear to be in good condition, with lots of baby calves being born. Feeder cattle and slaughter cattle prices are continuing to decline since their April highs, with no bottom in sight yet. A lot will depend upon corn prices in the fall, as lots of speculators are now worried that corn prices could be above initial projections due to flooding in the Midwest and hurt fat cattle prices even more. Oil and gas exploration is still present but at a slower pace than this time last year.
Region 11—Trans-Pecos and Edwards Plateau
- After a dry first quarter, the skies opened and the Edwards Plateau (at least a large portion of it) has experienced excellent rainfall in a number of weather systems which seem to bring rain on an almost weekly basis. As a result, range conditions are, as some old-timers are saying, “As good as we’ve ever seen!” Prices for all classes of livestock are still good, although the sheep and goat market and the cattle market have come off a bit in the last month. All in all, this year is shaping up to be a possible “bell ringer” for the ranch business in southwest Texas.
- Pasture conditions are excellent after very good rainfall in the past few months. Sheep, goat and cattle numbers remain relatively low, with some producers increasing stocking levels. Moving toward hair sheep from wool sheep remains one of the biggest changes. Losses from predators, particularly coyotes, remains a factor, with continuing land, water facilities and fence destruction problems from hogs. Economical ag labor availability is also an issue.
- Recent rains have made grazing conditions going into the summer months the best in many years.
Region 12—Southern New Mexico
- Volatility in cattle futures is frustrating some producers. The coolness of the spring is a little unusual and, thus, crops aren’t growing/sprouting in typical fashion. However, neither of these items should materially affect the farm economy for this quarter.
- Recent rains have been good for the ranching community, and crops are planted, emerged and looking good on most area farms. Wheat harvested for grain is still a few weeks away; most of the wheat has been chopped for haylage. The livestock market has experienced a significant drop in prices. Dairy operations have seen favorable pricing trends on milk and cheese.
Region 13—Northern Louisiana
- Due to the excessive rains during the soybean planting season, the intended planted acres of soybeans are much less than planned. Corn acres are as expected, and the crops look very good in some lighter soils. The crops on the heavier soils are not in as good condition. Cotton acres are up this year, and so far, the plants look very good in most locations.
Eleventh District Agricultural Data
Figures
|
Figure 1 Farm Lending Trends |
|||||
|---|---|---|---|---|---|
| What changes occurred in non-real-estate farm loans at your bank in the past three months compared with a year earlier? | |||||
| Index | Percent reporting, Q2 | ||||
| 2019:Q1 | 2019:Q2 | Greater | Same | Less | |
| Demand for loans* | -6.3 | -13.6 | 8.9 | 68.6 | 22.5 |
| Availability of funds* | 6.5 | 9.0 | 14.1 | 80.8 | 5.1 |
| Rate of loan repayment | -15.2 | -12.3 | 5.3 | 77.2 | 17.5 |
| Loan renewals or extensions | 14.4 | 13.2 | 15.8 | 81.6 | 2.6 |
| What changes occurred in the volume of farm loans made by your bank in the past three months compared with a year earlier? | |||||
| Index | Percent reporting, Q2 | ||||
| 2019:Q1 | 2019:Q2 | Greater | Same | Less | |
| Non-real-estate farm loans | -9.1 | -8.9 | 12.5 | 66.1 | 21.4 |
| Feeder cattle loans* | -4.0 | -11.0 | 8.1 | 72.8 | 19.1 |
| Dairy loans* | -22.4 | -5.9 | 6.7 | 80.7 | 12.6 |
| Crop storage loans* | -9.9 | -5.7 | 2.3 | 89.7 | 8.0 |
| Operating loans | -1.8 | 2.7 | 16.2 | 70.3 | 13.5 |
| Farm machinery loans* | -21.5 | -10.8 | 11.0 | 67.2 | 21.8 |
| Farm real estate loans* | -12.5 | -5.1 | 9.2 | 76.5 | 14.3 |
| *Seasonally adjusted. NOTES: Survey responses are used to calculate an index for each item by subtracting the percentage of bankers reporting less from the percentage reporting greater. Positive index readings generally indicate an increase, while negative index readings generally indicate a decrease. |
|||||
| Figure 2 Real Land Values |
|---|
| Figure 3 Real Cash Rents |
|---|
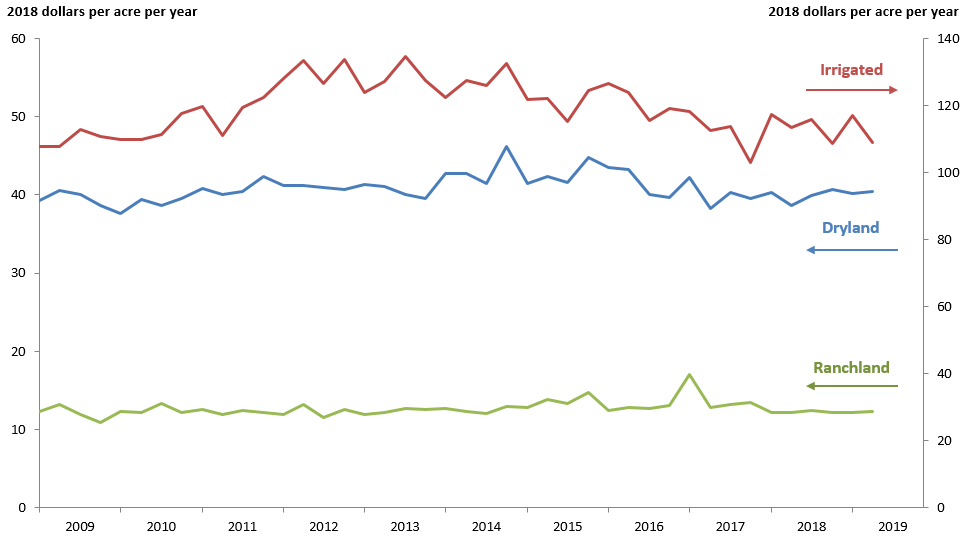
NOTES: All values have been seasonally adjusted. Real values are created by deflating the nominal values using the implicit price deflator for U.S. gross domestic product.
|
Figure 4 Anticipated Farmland Values and Credit Standards |
|||||
|---|---|---|---|---|---|
| What trend in farmland values do you expect in your area in the next three months? | |||||
| Index | Percent reporting, Q2 | ||||
| Anticipated trend in farmland values* | 2019:Q1 | 2019:Q2 | Up | Stable | Down |
| 0.1 | 1.1 | 8.3 | 84.5 | 7.2 | |
| What change occurred in credit standards for agricultural loans at your bank in the past three months compared with a year earlier?† | |||||
| Credit standards | 2019:Q1 | 2019:Q2 | Tightened | Same | Loosened |
| 18.6 | 12.7 | 12.7 | 87.3 | 0.0 | |
†Added to survey in second quarter 2011.
NOTES: Survey responses are used to calculate an index for each item by subtracting the percentage of bankers reporting less from the percentage reporting greater. Positive index readings generally indicate an increase, while negative index readings generally indicate a decrease.
Tables
Tables | ||||
| Table 1 Rural Real Estate Values—Second Quarter 2019 |
||||
|---|---|---|---|---|
| Banks1 | Average value2 | Percent change in value from previous year3 | ||
| Cropland—Dryland | ||||
| District* | 89 | 1,919 | 4.9 | |
| Texas* | 80 | 1,926 | 4.5 | |
| 1 | Northern High Plains | 10 | 919 | 1.9 |
| 2 | Southern High Plains | 10 | 875 | 13.6 |
| 3 | Northern Low Plains* | 5 | 883 | 6.0 |
| 4 | Southern Low Plains* | 7 | 939 | -3.4 |
| 5 | Cross Timbers | 4 | 1,613 | 11.7 |
| 6 | North Central Texas | 13 | 2,923 | 5.0 |
| 7 | East Texas* | 8 | 2,788 | 10.7 |
| 8 | Central Texas | 9 | 3,972 | 6.2 |
| 9 | Coastal Texas | 3 | 2,300 | 2.6 |
| 10 | South Texas | 4 | 2,225 | -4.6 |
| 11 | Trans-Pecos and Edwards Plateau | 7 | 2,357 | -2.0 |
| 12 | Southern New Mexico | 3 | 408 | -2.5 |
| 13 | Northern Louisiana | 6 | 3,108 | 13.4 |
| Cropland—Irrigated | ||||
| District* | 70 | 2,568 | 5.2 | |
| Texas* | 60 | 2,257 | 3.4 | |
| 1 | Northern High Plains | 10 | 2,145 | 2.4 |
| 2 | Southern High Plains | 9 | 1,622 | 5.7 |
| 3 | Northern Low Plains* | 4 | 2,278 | 0.0 |
| 4 | Southern Low Plains | 6 | 1,233 | 0.0 |
| 5 | Cross Timbers | n.a. | n.a. | n.a. |
| 6 | North Central Texas | 7 | 3,136 | 3.4 |
| 7 | East Texas | 5 | 2,970 | 10.2 |
| 8 | Central Texas | 5 | 4,280 | 8.5 |
| 9 | Coastal Texas | 3 | 2,817 | 13.3 |
| 10 | South Texas | 3 | 3,200 | 0.0 |
| 11 | Trans-Pecos and Edwards Plateau | 6 | 2,975 | -0.9 |
| 12 | Southern New Mexico | 4 | 3,813 | 8.0 |
| 13 | Northern Louisiana | 6 | 4,408 | 13.6 |
| Ranchland | ||||
| District* | 95 | 2,005 | 3.2 | |
| Texas* | 86 | 2,383 | 3.2 | |
| 1 | Northern High Plains | 10 | 715 | 10.8 |
| 2 | Southern High Plains | 6 | 850 | -16.5 |
| 3 | Northern Low Plains | 5 | 840 | 0.0 |
| 4 | Southern Low Plains* | 6 | 1,146 | 0.0 |
| 5 | Cross Timbers | 5 | 1,820 | 10.8 |
| 6 | North Central Texas | 14 | 3,007 | 5.0 |
| 7 | East Texas | 13 | 2,835 | 8.3 |
| 8 | Central Texas | 10 | 6,310 | 1.9 |
| 9 | Coastal Texas | 3 | 3,000 | 9.4 |
| 10 | South Texas | 3 | 2,567 | -2.3 |
| 11 | Trans-Pecos and Edwards Plateau | 11 | 2,318 | 2.4 |
| 12 | Southern New Mexico | 3 | 358 | 0.0 |
| 13 | Northern Louisiana | 6 | 2,592 | 21.0 |
| *Seasonally adjusted. 1 Number of banks reporting land values. 2 Prices are dollars per acre, not adjusted for inflation. 3 Not adjusted for inflation and calculated using responses only from those banks reporting in both the past and current quarter. |
||||
| Table 2 Interest Rates by Loan Type |
|||||
|---|---|---|---|---|---|
| Feeder cattle | Other farm operating | Intermediate term | Long-term farm real estate | ||
| Fixed (average rate, percent) | |||||
| 2018:Q2 | 6.55 | 6.57 | 6.50 | 6.24 | |
| Q3 | 6.74 | 6.84 | 6.64 | 6.36 | |
| Q4 | 6.88 | 6.95 | 6.78 | 6.58 | |
| 2019:Q1 | 7.01 | 7.11 | 6.88 | 6.58 | |
| Q2 | 7.02 | 7.11 | 6.83 | 6.40 | |
| Variable (average rate, percent) | |||||
| 2018:Q2 | 6.25 | 6.28 | 6.23 | 5.90 | |
| Q3 | 6.48 | 6.48 | 6.43 | 6.02 | |
| Q4 | 6.70 | 6.69 | 6.66 | 6.26 | |
| 2019:Q1 | 6.81 | 6.83 | 6.75 | 6.44 | |
| Q2 | 6.84 | 6.85 | 6.80 | 6.42 | |
Special Questions
| Table 3 Special Questions |
|||
|---|---|---|---|
| To what degree was your lending area (including local infrastructure, housing, etc.) impacted by flooding or other extreme weather events during the first half of the year? | |||
| Significantly Impacted | Modestly Impacted | Not Impacted | |
| Percent | 11.3 | 44.3 | 44.3 |
| What percentage of your agricultural borrowers were, or likely will be, impacted by flooding or other extreme weather events during the first half of the year? | |||
| Significantly Impacted | Modestly Impacted | Not Impacted | |
| Percent* | 16.1 | 28.2 | 55.8 |
| *Average across respondents. | |||
Special Questions Comments
Region 1—Northern High Plains
- Extreme weather impacting our region has included high winds, excessive rainfall, hail and cooler-than-normal temperatures. These events have impacted crops and structures.
- The extended wet period limited all spring planting. The cotton window closed, with what little was planted struggling. Corn is slow and late. Grain sorghum will be a fallback. Hay supplies were also cut due to wetness.
Region 2—Southern High Plains
- Our cotton farmers have not been able to get in and plant due to the heavy and frequent rains. They are starting to push up to their insurance plant date but can't get into the fields to plant.
- Very few land sales have occurred during the first half, making quoted prices not exactly realistic. This area has been relatively free of destructive storms. Conditions are on the better side.
Region 4—Southern Low Plains
- In our area, standing water in fields has been the main problem. We should have most of the cotton planted by the June 20 planting date. There will be a small amount that will not be planted.
Region 6—North Central Texas
- This area has had 10 months of continuous crop-killing rains, but our bridges and infrastructure have been unaffected.
- We have been extremely wet since September of last year, which has impacted all of our construction-related borrowers and our ag producers. Some corn will have lower yields, and a lot of cotton was planted late.
- It’s got to stop raining. It has gotten very serious and costly.
Region 8—Central Texas
- The main issue was delayed plantings.
Region 9—Coastal Texas
- Some wind damage to crops has resulted in replanting.
Region 13—Northern Louisiana
- The extremely wet weather had the greatest impact, with delayed plantings, prevented plantings and replants. Also, the wet weather stunted most of what was planted.
Back issues of Agricultural Survey »
For More Information
Questions regarding the Agricultural Survey can be addressed to Christopher Slijk at christopher.slijk@dal.frb.org.