Agricultural Survey

Fourth Quarter 2019
Survey Highlights
Bankers responding to the fourth-quarter survey reported overall weaker conditions across most regions of the Eleventh District. They noted that poor rainfall throughout the year contributed to dry conditions, affecting crop yields. The cattle market is one of the few bright spots in Texas agriculture. Market Facilitation Program and Price Loss Coverage payments from the U.S. Department of Agriculture have helped, but it may be too little, too late for some, according to respondents.
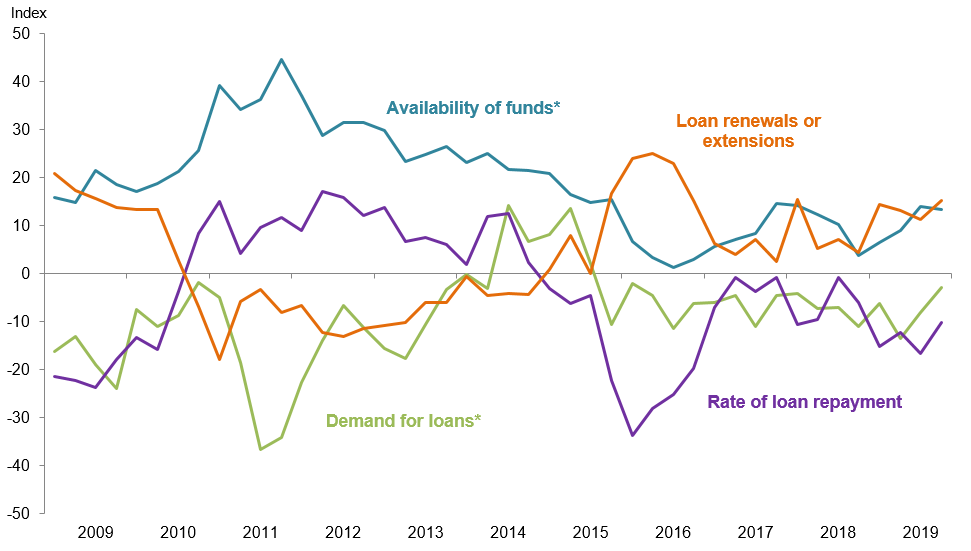
Demand for agricultural loans continued to decline, with the loan demand index registering its 17th quarter in negative territory. Loan renewals and extensions increased, and the rate of loan repayment continued to decline. Loan volume fell across all major categories compared with a year ago (Figure 1).
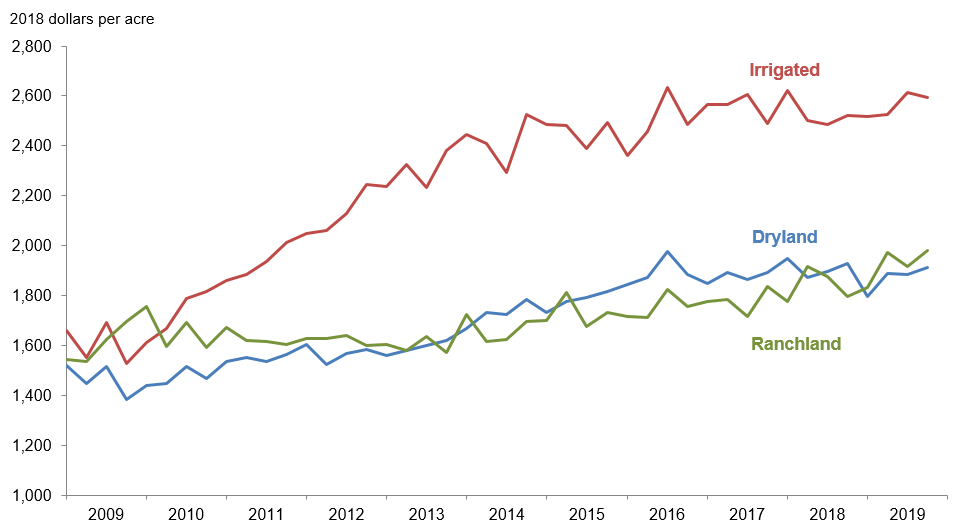
District irrigated cropland values stabilized this quarter, while dryland values held steady and ranchland values increased moderately (Figure 2). According to bankers who responded in both this quarter and fourth quarter 2018, nominal cropland and ranchland values increased year over year in Texas, northern Louisiana and southern New Mexico (Table 1).
The anticipated trend in farmland values index increased slightly after being flat for a year, suggesting respondents expect farmland values to pick up moderately. The credit standards index went up, indicating further tightening of standards on net (Figure 4).
Quarterly Comments

District bankers were asked for additional comments concerning agricultural land values and credit conditions. These comments have been edited for publication.
Region 1—Northern High Plains
- Late rains and cool temperatures slowed harvest, and yields have been disappointing—ranging from 10 to 20 percent below expectations—resulting in low profits. Expenditures on equipment remain down. The cattle market is one of the few bright spots in Texas Panhandle agriculture.
- Tariffs have hurt producers, but Market Facilitation Program (MFP) payments are lessening the blow. Crop yields are going to end up about average for 2019, but prices are lower. Wheat pasture looked exceptional 60 days ago but may not end up being as good as expected.
- I once read that all a farmer has control over is the depth he plants the seed. For everything after that, he is reacting to a variable. It is very true, and 2019 might have set a record for one of the most volatile years ever.
- MFP payments have brought most farm loans to breakeven.
Region 2—Southern High Plains
- The agriculture industry needs help—lower input costs and a fair price for their products.
- Prices are still the major factor with marketing cotton despite some relief from MFP payments. Crop production is off about 30 percent due to excessive heat in July.
- Crop production is not what was expected—prices are low and cost is high. Producers have been losing equity in their financial statement for many years now and will do so again. MFP and Price Loss Coverage (PLC) payments helped, but it may be too little, too late for some.
- Results have been very disappointing. We started the year with abundant subsoil moisture, followed by generally good planting rains. The spigot turned off in July and August, and the thermometer rose. Crops “gave up the ghost.” Although our region usually has concentrated areas of short crops from isolated weather events, this year is different. All crops across the entire region were short—dryland off about 50 percent and irrigated about 30 percent. MFP payments will help, but this will be a very challenging season.
Region 3—Northern Low Plains
- Cotton harvest is winding down; yields on irrigated acres have been slightly down from yearly averages, and harvested dryland acres are yielding less than average. Wheat is doing poorly. Pasture conditions are below average due to drought and grasshopper pressure during the growing season. This area is needing rain.
Region 4—Southern Low Plains
- MFP payments will help low prices for cotton, which has an average yield at best. Prices for stocker and unweaned calves are low and below breakeven prices for the first time in several years. More rain and a new year bring hope.
- It’s an extremely difficult year for all production agriculture enterprises. Markets and weather have reduced the equity positions of most farmers/ranchers. It’s not a promising outlook. MFP payments helped, but [farmers/ranchers] will most likely need more to survive this crisis.
Region 6—North Central Texas
- Same old story: Regulatory requirements are hurting the consumer.
- We’re still hoping grain prices go up. We need rain!
- Most of our cattle ranchers have ample hay put up for the winter, and we are expecting a mild winter. We still have some of our farmers planting less crops due to the unpredictable weather conditions of recent years and buying more feeder cattle. Cow and calf prices have been low the last 60–90 days. We are hopeful prices will rebound in January.
- Expense structures are not leaving much room for profit even where yields are good. This has drastically increased the risk to the producer and their bankers.
Region 7—East Texas
- Extreme wet conditions in late 2017 into 2018 are reflected in late calf crops into this year. In addition, extended drought conditions in this quarter have affected calf sales as calves are lighter, and with depressed market conditions, more producers are holding calves longer, causing extension or loan modifications. Cropland field work is on schedule or close to it for the first time in two years.
- Land prices have been increasing; we feel this is partly due to the increase in people moving here from out of state (California). Large agriculture properties are being broken up for development. We are also seeing land that was in agriculture production being mined for rock to satisfy the need caused by new-home construction.
Region 8—Central Texas
- We’re still in need of rain—it has been spotty. Early winter grass plantings are looking good, and it looks like we might get by with no armyworms this fall. Hay supplies will be used up this year if cold weather continues throughout the winter months. There’s no pecan crop at all this year. Oil and gas exploration is continuing at a steady pace, albeit below previous levels. Land sales seem to have leveled off at this time.
- The cattle market has been off, especially on “plain” cattle. The area has dried out considerably, making winter pastures grow at a much slower rate. Stock ponds are in need of a fill-up. The general economy is very good.
Region 11—Trans-Pecos and Edwards Plateau
- Livestock prices have remained fairly stable, even though cattle have come off some in the last three or four months. Calf prices are still workable if the weather will cooperate. A very cold, dry winter with increased feeding requirements will not bode well for operators. Meat goat, lamb and wool markets remain pretty strong. Indications are that this winter may be a bit drier and milder than most.
- Dry pasture conditions in recent months are creating some challenges for the future in the ranching business. Livestock is in good condition at present, but feeding is increasing. We are in need of rainfall to bring on the weeds relied on in winter. Sheep, goat and cattle prices remain fairly good, with a number of producers having taken advantage of lower replacement cattle prices in the past few months to increase numbers. Predators remain a cause for continued decreases in numbers, particularly in sheep. We’re likely going to see continued challenging times ahead.
Region 12—Southern New Mexico
- Farmland values are increasing due to the oil and gas industry. The industry is buying up land for offices and shop buildings.
- Cool weather during spring planting appears to have impaired cotton yields a little, but producers are still reporting good yields. Corn yields are down some. As always, more moisture would be welcomed.
Eleventh District Agricultural Data
Figures
|
Figure 1 Farm Lending Trends |
|||||
|---|---|---|---|---|---|
| What changes occurred in non-real-estate farm loans at your bank in the past three months compared with a year earlier? | |||||
| Index | Percent reporting, Q4 | ||||
| 2019:Q3 | 2019:Q4 | Greater | Same | Less | |
| Demand for loans* | -8.1 | -2.9 | 15.4 | 66.3 | 18.3 |
| Availability of funds* | 13.9 | 13.3 | 18.1 | 77.1 | 4.8 |
| Rate of loan repayment | -16.7 | -10.3 | 4.7 | 80.4 | 15.0 |
| Loan renewals or extensions | 11.1 | 15.2 | 17.1 | 81.0 | 1.9 |
| What changes occurred in the volume of farm loans made by your bank in the past three months compared with a year earlier? | |||||
| Index | Percent reporting, Q4 | ||||
| 2019:Q3 | 2019:Q4 | Greater | Same | Less | |
| Non-real-estate farm loans | -10.4 | -11.1 | 8.3 | 72.2 | 19.4 |
| Feeder cattle loans* | -23.7 | -25.8 | 4.3 | 65.6 | 30.1 |
| Dairy loans* | -21.0 | -24.2 | 0.0 | 75.8 | 24.2 |
| Crop storage loans* | -15.9 | -14.9 | 5.2 | 74.7 | 20.1 |
| Operating loans | 1.0 | -3.8 | 14.3 | 67.6 | 18.1 |
| Farm machinery loans* | -22.4 | -19.6 | 3.6 | 73.2 | 23.2 |
| Farm real estate loans* | -10.5 | -14.0 | 8.2 | 69.6 | 22.2 |
| *Seasonally adjusted. NOTES: Survey responses are used to calculate an index for each item by subtracting the percentage of bankers reporting less from the percentage reporting greater. Positive index readings generally indicate an increase, while negative index readings generally indicate a decrease. |
|||||
| Figure 2 Real Land Values |
|---|
| Figure 3 Real Cash Rents |
|---|
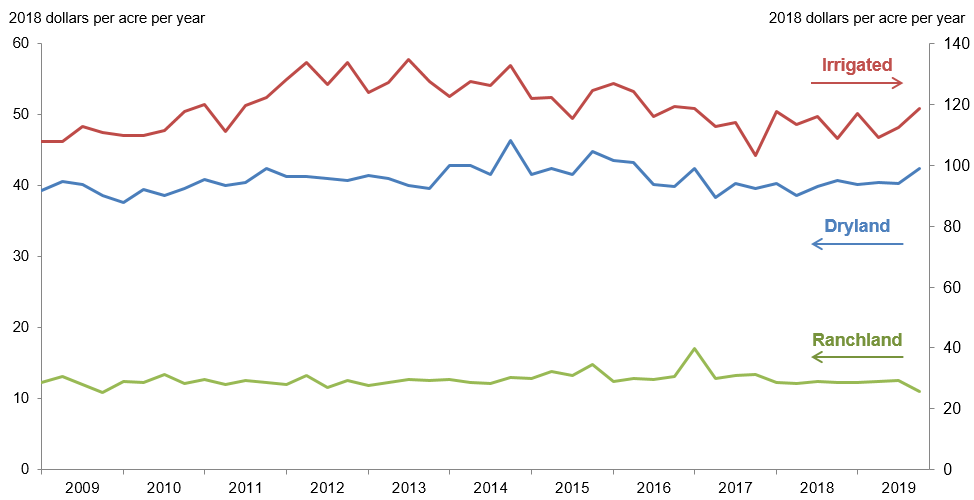
NOTES: All values have been seasonally adjusted. Real values are created by deflating the nominal values using the implicit price deflator for U.S. gross domestic product.
|
Figure 4 Anticipated Farmland Values and Credit Standards |
|||||
|---|---|---|---|---|---|
| What trend in farmland values do you expect in your area in the next three months? | |||||
| Index | Percent reporting, Q4 | ||||
| Anticipated trend in farmland values* | 2019:Q3 | 2019:Q4 | Up | Stable | Down |
| 1.0 | 3.4 | 9.0 | 85.4 | 5.6 | |
| What change occurred in credit standards for agricultural loans at your bank in the past three months compared with a year earlier?† | |||||
| Credit standards | 2019:Q3 | 2019:Q4 | Tightened | Same | Loosened |
| 13.1 | 18.7 | 18.7 | 81.3 | 0.0 | |
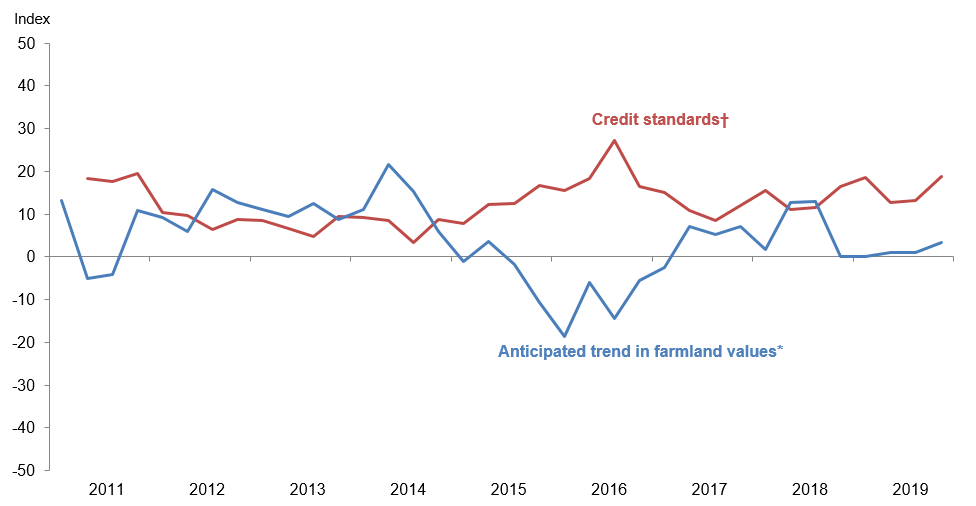
†Added to survey in second quarter 2011.
NOTES: Survey responses are used to calculate an index for each item by subtracting the percentage of bankers reporting less from the percentage reporting greater. Positive index readings generally indicate an increase, while negative index readings generally indicate a decrease.
Tables
Tables | ||||
| Table 1 Rural Real Estate Values—Fourth Quarter 2019 |
||||
|---|---|---|---|---|
| Banks1 | Average value2 | Percent change in value from previous year3 | ||
| Cropland—Dryland | ||||
| District* | 84 | 1,958 | 2.8 | |
| Texas* | 74 | 1,974 | 2.0 | |
| 1 | Northern High Plains | 10 | 970 | 3.8 |
| 2 | Southern High Plains | 9 | 867 | 1.4 |
| 3 | Northern Low Plains* | 4 | 848 | 3.0 |
| 4 | Southern Low Plains* | 6 | 1,200 | -1.7 |
| 5 | Cross Timbers | 4 | 1,738 | 15.9 |
| 6 | North Central Texas | 15 | 3,230 | 9.8 |
| 7 | East Texas* | 7 | 3,232 | 0.0 |
| 8 | Central Texas | 7 | 3,493 | 3.4 |
| 9 | Coastal Texas | 3 | 1,933 | -3.4 |
| 10 | South Texas | 3 | 2,050 | -18.0 |
| 11 | Trans-Pecos and Edwards Plateau | 6 | 2,500 | 1.2 |
| 12 | Southern New Mexico | 4 | 613 | 63.5 |
| 13 | Northern Louisiana | 6 | 2,725 | 7.8 |
| Cropland—Irrigated | ||||
| District* | 63 | 2,656 | 2.4 | |
| Texas* | 51 | 2,352 | 3.8 | |
| 1 | Northern High Plains | 10 | 2,263 | 12.8 |
| 2 | Southern High Plains | 9 | 1,761 | -2.4 |
| 3 | Northern Low Plains* | 3 | 1,751 | -13.4 |
| 4 | Southern Low Plains | 4 | 2,075 | 11.1 |
| 5 | Cross Timbers | n.a. | n.a. | n.a. |
| 6 | North Central Texas | 5 | 3,640 | 18.3 |
| 7 | East Texas | 4 | 3,700 | 4.8 |
| 8 | Central Texas | 6 | 4,117 | 2.0 |
| 9 | Coastal Texas | n.a. | n.a. | n.a. |
| 10 | South Texas | 3 | 3,400 | -8.9 |
| 11 | Trans-Pecos and Edwards Plateau | 4 | 3,588 | 0.0 |
| 12 | Southern New Mexico | 6 | 4,125 | -9.2 |
| 13 | Northern Louisiana | 6 | 4,175 | 9.8 |
| Ranchland | ||||
| District* | 92 | 2,029 | 5.0 | |
| Texas* | 81 | 2,414 | 4.4 | |
| 1 | Northern High Plains | 10 | 730 | 12.5 |
| 2 | Southern High Plains | 6 | 825 | -1.5 |
| 3 | Northern Low Plains | 4 | 825 | 3.1 |
| 4 | Southern Low Plains* | 5 | 1,153 | -4.1 |
| 5 | Cross Timbers | 6 | 1,888 | 14.1 |
| 6 | North Central Texas | 14 | 3,493 | 10.2 |
| 7 | East Texas | 12 | 3,079 | -1.4 |
| 8 | Central Texas | 7 | 6,086 | -0.6 |
| 9 | Coastal Texas | n.a. | n.a. | n.a. |
| 10 | South Texas | 3 | 2,967 | 11.2 |
| 11 | Trans-Pecos and Edwards Plateau | 12 | 2,283 | 3.2 |
| 12 | Southern New Mexico | 5 | 360 | 26.3 |
| 13 | Northern Louisiana | 6 | 2,392 | 6.1 |
| *Seasonally adjusted. 1 Number of banks reporting land values. 2 Prices are dollars per acre, not adjusted for inflation. 3 Not adjusted for inflation and calculated using responses only from those banks reporting in both the past and current quarter. |
||||
| Table 2 Interest Rates by Loan Type |
|||||
|---|---|---|---|---|---|
| Feeder cattle | Other farm operating | Intermediate term | Long-term farm real estate | ||
| Fixed (average rate, percent) | |||||
| 2018:Q4 | 6.88 | 6.95 | 6.78 | 6.58 | |
| 2019:Q1 | 7.01 | 7.11 | 6.88 | 6.58 | |
| Q2 | 7.02 | 7.11 | 6.83 | 6.40 | |
| Q3 | 6.90 | 6.89 | 6.71 | 6.42 | |
| Q4 | 6.58 | 6.61 | 6.45 | 6.11 | |
| Variable (average rate, percent) | |||||
| 2018:Q4 | 6.70 | 6.69 | 6.66 | 6.26 | |
| 2019:Q1 | 6.81 | 6.83 | 6.75 | 6.44 | |
| Q2 | 6.84 | 6.85 | 6.80 | 6.42 | |
| Q3 | 6.58 | 6.59 | 6.50 | 6.21 | |
| Q4 | 6.39 | 6.29 | 6.23 | 5.88 | |
Back issues of Agricultural Survey »
For More Information
Questions regarding the Agricultural Survey can be addressed to Jesus Cañas at Jesus.Canas@dal.frb.org.