Agricultural Survey

Survey highlights
Bankers responding to the second-quarter agriculture survey reported mildly improved conditions across most regions of the Eleventh District, encompassing Texas, northern Louisiana and southern New Mexico. Recent rains provided a much-needed reprieve to the ag sector. Since last year, the lack of rain has led to poor growing conditions and combined with low commodity prices meant many farmers have carryover debt from 2024. The rain has salvaged some of the harvests but not all. Cattle prices remained high and helped some farmers increase their farm income.
“The area has received significant rainfall which will help the grass pastures green up,” noted one survey participant. However, some respondents said it was not sufficient to significantly improve prospects for farmers. Another respondent said, “Recent rains revived struggling wheat crops, but yields remain below average. With both production and market prices lower, wheat farmers face a tough year financially with little to no profit expected.” Another commented, “Recent rains have been a blessing and a curse. It’s a blessing for our livestock producers who needed the rain and a mixed bag for our row crops.”
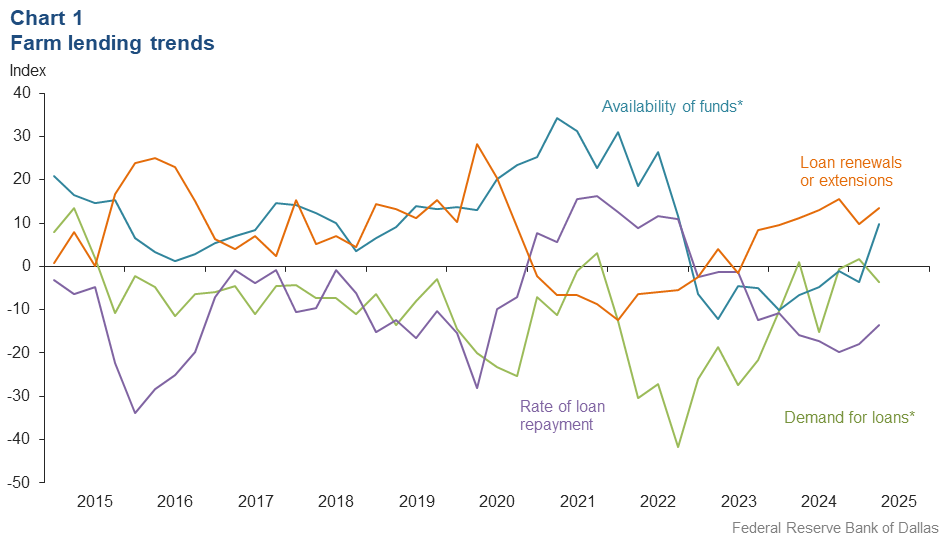
Demand for agricultural loans declined in the second quarter. Availability of funds increased for the first time since 2022. Loan renewals or extensions continued to increase, and the pace ticked up compared to last quarter. The rate of loan repayment continued to decline, but the pace of the declines slowed. Except for operating loans and feeder cattle loans, loan volume was down for all remaining categories compared with a year ago (Chart 1).
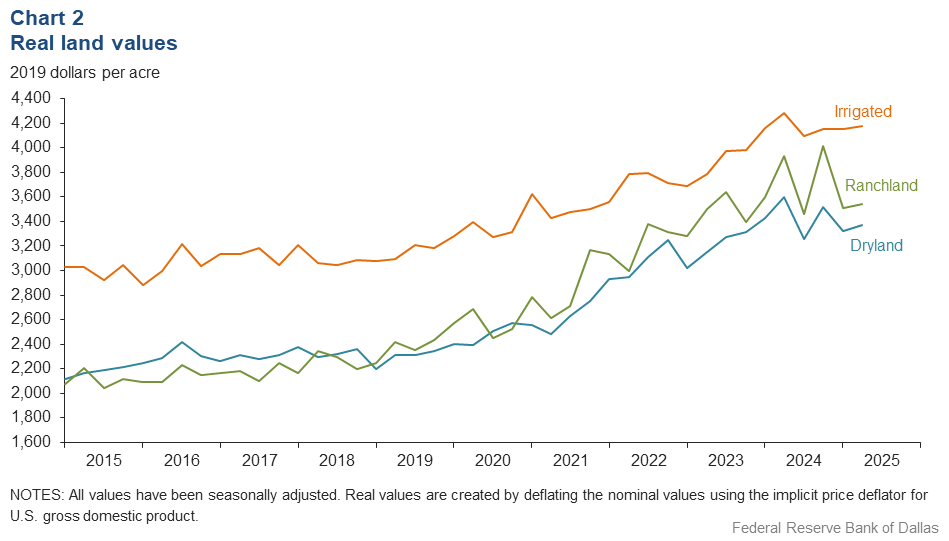
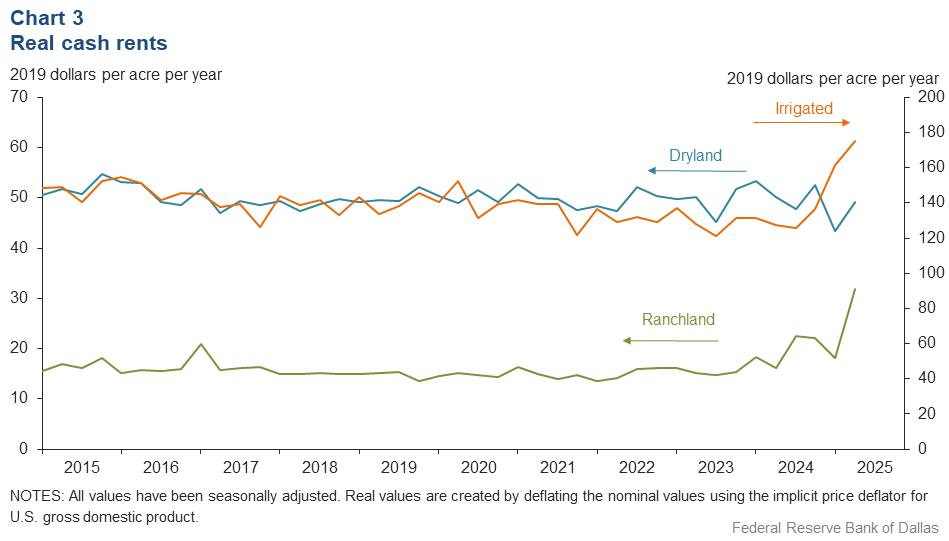
Real land values for irrigated, dryland and ranchland increased slightly this quarter (Chart 2). In the district, dryland values were slightly up year over year, but irrigated and ranchland values declined compared to last year (Table 1). In the second quarter 2025, real cash rents rose across the board (Chart 3).
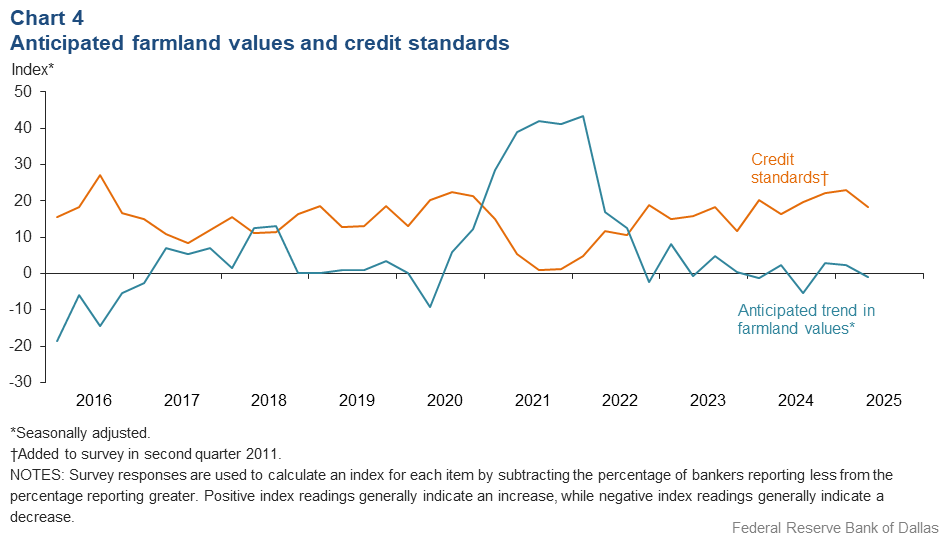
The anticipated trend in the farmland values index remained flat in the second quarter after two quarters of slight growth in the trend. This implies respondents expect farmland values to continue to be stable. The credit standards index showed an increase in credit tightening at a slower pace than first quarter 2025 (Chart 4). Respondents reported interest rate declines for all types of loans in the current quarter, with interest rates for real estate loans, both fixed and variable rate, ticking down below 8 percent, a first since 2022 (Table 2).Next release: September 22, 2025
Agricultural Survey is compiled from a survey of Eleventh District agricultural bankers, and data have been seasonally adjusted as necessary. Data were collected June 3–11, and 65 bankers responded to the survey.
Quarterly comments

District bankers were asked for additional comments concerning agricultural land values and credit conditions. Some comments have been edited for grammar and clarity.
- The area has received significant rainfall which will help the grass pastures green up. Cattle prices still remain high, and commodity prices are still low. Our cattle guys are still making good money, but our farmers are getting by.
- Recent rains revived struggling wheat crops, but yields remain below average. With both production and market prices lower, wheat farmers face a tough year financially with little to no profit expected. On the other hand, cow-calf producers—many of whom also grow wheat—are benefiting from record-high cattle prices, providing a much-needed boost to their overall earnings.
- The area has had adequate moisture to plant. Low commodity prices have strained cash flow projections. Area producers are carrying debt over from the 2024 production year because of the combination of low commodity prices and drought. High cattle prices have dampened purchases for summer pasture.
- Wheat harvest is 60 percent complete. Yields and prices are better than initially expected. Cotton planting has started. Recent rains have improved conditions. The cattle market continues to be very strong.
- Ag real estate values have escalated in the past three to four years.
- We need water, rain.
- Weaker row crop commodity prices are a point of concern. Recent rains provide hope for increased yields to offset elevated input costs and weaker prices. We are monitoring farm operators more closely this season. Prices for cattle still remain strong, and demand for loans in this category has increased.
- Cow-calf operators are enjoying good prices for their livestock, but the stocker-feeder borrowers are having trouble making purchases work. The threat of a screwworm outbreak is on everyone's mind, as it would be disastrous to the cattle and wildlife operators. Recent rains have improved pastures and attitudes.
- Recent rains have been a blessing and a curse. It’s a blessing for our livestock producers who needed the rain and a mixed bag for our row crops. Where the fields got drained, timely crops are looking good. Overall, crops that will be taken to harvest look good. The crops that were lost to heavy rains were either replanted or left fallow; the crops will be late. Not much cotton was planted, and about half of what was planted was lost. Commodity prices are a concern with the exception of livestock. High input costs are squeezing producers’ margins.
- The current alfalfa crop season is underway with the first cutting in the barn and the second beginning. Hay prices are 20 percent to 30 percent less than this time last year. Cattle markets continue to be very good. Range conditions are poor, with spotty areas of improvement where they received some spring rain. With the higher prices received on cattle, ranchers are able to buy supplemental feed for longer periods than typical, which is positive in terms of herd stability.
Historical data
Historical data can be downloaded dating back to first quarter 2000.
Charts
Farm lending trends
What changes occurred in non-real-estate farm loans at your bank in the past three months compared with a year earlier?
| Index | Percent reporting, Q2 | ||||
| 2025:Q1 | 2025:Q2 | Greater | Same | Less | |
Demand for loans* | 1.7 | –3.6 | 15.4 | 65.6 | 19.0 |
Availability of funds* | –3.7 | 9.7 | 12.5 | 84.7 | 2.8 |
Rate of loan repayment | –18.0 | –13.6 | 6.8 | 72.9 | 20.3 |
Loan renewals or extensions | 9.8 | 13.6 | 18.6 | 76.3 | 5.1 |
| *Seasonally adjusted. | |||||

What changes occurred in the volume of farm loans made by your bank in the past three months compared with a year earlier?
| Index | Percent reporting, Q2 | ||||
| 2025:Q1 | 2025:Q2 | Greater | Same | Less | |
Non–real–estate farm loans | –6.6 | –13.3 | 8.3 | 70.0 | 21.7 |
Feeder cattle loans* | 4.4 | 12.6 | 20.6 | 71.4 | 8.0 |
Dairy loans* | –15.6 | –6.8 | 0.0 | 93.2 | 6.8 |
Crop storage loans* | –9.2 | –10.9 | 2.8 | 83.5 | 13.7 |
Operating loans | 6.7 | 3.4 | 17.0 | 69.5 | 13.6 |
Farm machinery loans* | –29.5 | –25.6 | 2.6 | 69.2 | 28.2 |
Farm real estate loans* | –16.3 | –17.6 | 6.0 | 70.4 | 23.6 |
| *Seasonally adjusted. NOTES: Survey responses are used to calculate an index for each item by subtracting the percentage of bankers reporting less from the percentage reporting greater. Positive index readings generally indicate an increase, while negative index readings generally indicate a decrease. |
|||||
Real land values

Real cash rents

Anticipated farmland values and credit standards
What trend in farmland values do you expect in your area in the next three months?
| Index | Percent reporting, Q2 | ||||
| 2025:Q1 | 2025:Q2 | Up | Same | Down | |
| Anticipated trend in farmland values* | 2.3 | –0.9 | 5.5 | 88.1 | 6.4 |
| *Seasonally adjusted. | |||||
What change occurred in credit standards for agricultural loans at your bank in the past three months compared with a year earlier?
| 2025:Q1 | 2025:Q2 | Up | Same | Down | |
| Credit standards | 23.0 | 18.3 | 18.3 | 81.7 | 0.0 |

Tables
Rural real estate values—second quarter 2025
| Banks1 | Average value2 | Percent change in value from previous year3 | ||
Cropland–Dryland | ||||
| District* | 53 | 3,459 | 1.4 |
| Texas* | 46 | 3,557 | 1.4 |
1 | Northern High Plains | 6 | 1,242 | –2.3 |
2 | Southern High Plains | 6 | 1,142 | –12.5 |
3 | Northern Low Plains* | 3 | 1,104 | 0.0 |
4 | Southern Low Plains* | 3 | 2,055 | –7.7 |
5 | Cross Timbers | n.a. | n.a. | n.a. |
6 | North Central Texas | 4 | 7,313 | 33.0 |
7 | East Texas* | 3 | 4,629 | –17.9 |
8 | Central Texas | 8 | 8,631 | –16.5 |
9 | Coastal Texas | 4 | 3,250 | 4.8 |
10 | South Texas | 3 | 3,400 | 33.3 |
11 | Trans–Pecos and Edwards Plateau | 4 | 4,563 | –13.1 |
12 | Southern New Mexico | 3 | 567 | –5.5 |
13 | Northern Louisiana | 4 | 3,750 | 1.4 |
Cropland–Irrigated | ||||
| District* | 44 | 4,283 | –1.6 |
| Texas* | 37 | 3,460 | –5.3 |
1 | Northern High Plains | 6 | 3,092 | –3.8 |
2 | Southern High Plains | 6 | 2,392 | –11.7 |
3 | Northern Low Plains* | n.a. | n.a. | n.a. |
4 | Southern Low Plains | n.a. | n.a. | n.a. |
5 | Cross Timbers | n.a. | n.a. | n.a. |
6 | North Central Texas | 3 | 8,333 | 11.1 |
7 | East Texas | 3 | 6,667 | –2.4 |
8 | Central Texas | 5 | 10,600 | –18.5 |
9 | Coastal Texas | n.a. | n.a. | n.a. |
10 | South Texas | 3 | 4,533 | 10.0 |
11 | Trans–Pecos and Edwards Plateau | 3 | 3,867 | 0.9 |
12 | Southern New Mexico | 3 | 11,167 | 8.9 |
13 | Northern Louisiana | 4 | 5,250 | 1.2 |
Ranchland | ||||
| District* | 55 | 3,633 | –3.1 |
| Texas* | 47 | 4,319 | –3.1 |
1 | Northern High Plains | 6 | 1,358 | 8.9 |
2 | Southern High Plains | 4 | 1,125 | –1.1 |
3 | Northern Low Plains | n.a. | n.a. | n.a. |
4 | Southern Low Plains* | 3 | 2,074 | 0.0 |
5 | Cross Timbers | n.a. | n.a. | n.a. |
6 | North Central Texas | 4 | 7,688 | 28.1 |
7 | East Texas | 6 | 4,833 | –9.8 |
8 | Central Texas | 9 | 11,472 | –11.2 |
9 | Coastal Texas | 3 | 4,600 | –1.4 |
10 | South Texas | 3 | 3,400 | 20.7 |
11 | Trans–Pecos and Edwards Plateau | 5 | 4,400 | –11.3 |
12 | Southern New Mexico | 4 | 663 | –4.5 |
13 | Northern Louisiana | 4 | 3,188 | 9.9 |
| *Seasonally adjusted. 1 Number of banks reporting land values. 2 Prices are dollars per acre, not adjusted for inflation. 3 Not adjusted for inflation and calculated using responses only from those banks reporting in both the past and current quarter. n.a.—Not published due to insufficient responses but included in totals for Texas and district. |
||||
Interest rates by loan type—second quarter 2025
| Feeder cattle | Other farm operating | Intermediate term | Long-term farm real estate | Fixed (average rate, percent) |
2024:Q2 | 9.19 | 9.23 | 8.93 | 8.58 |
2024:Q3 | 9.19 | 9.19 | 8.92 | 8.63 |
2024:Q4 | 8.72 | 8.77 | 8.54 | 8.18 |
2025:Q1 | 8.63 | 8.59 | 8.26 | 7.94 |
2025:Q2 | 8.51 | 8.53 | 8.20 | 7.88 | Variable (average rate, percent) |
2024:Q2 | 9.30 | 9.31 | 9.06 | 8.71 |
2024:Q3 | 9.40 | 9.37 | 9.07 | 8.71 |
2024:Q4 | 8.82 | 8.82 | 8.59 | 8.20 |
2025:Q1 | 8.67 | 8.58 | 8.39 | 8.02 |
2025:Q2 | 8.48 | 8.49 | 8.12 | 7.96 |
Special Questions
For this survey, respondents were asked supplemental questions about the impact of tariffs and trade policy. Data were collected June 3–8, and 48 agricultural bankers responded to the survey.
| Increased (percent) |
No change (percent) |
Decreased (percent) |
Don’t know (percent) |
|
| Rate of loan repayment | 0.0 | 76.1 | 6.5 | 17.4 |
| Loan demand | 2.1 | 61.7 | 17.0 | 19.1 |
| Net farm income (excluding federal payments) | 4.3 | 47.8 | 23.9 | 23.9 |
NOTE: 47 responses.
- Net farm income will likely to be impacted by pecan, cotton and possibly beef exports. Loan demand is soft for well-managed ag enterprises.
- There hasn't been enough time since higher tariffs were implemented to give an accurate analysis.
- Farms are concerned about this, but it is still unclear how severely the tariffs will affect their bottom line.
- New poultry production is improving our market.
- Cattle prices have increased substantially recently. Loan demand is stable.
- Ag loan demand has been down some; it is hard to say at this time if this is due to the tariffs, but I'd be surprised if they are not playing a role.
- High interest rates have caused a slowdown in loan demand.
- We are discussing with our borrowers, but no change has been seen as of yet. The harvest for corn will begin in the later part of this month, and we'll see if there is an impact to the commodity price.
- Too soon to see an impact.
- Not enough time for tariffs to take effect.
| Increase (percent) |
No change (percent) |
Decrease (percent) |
Don’t know (percent) |
|
| Rate of loan repayment | 0.0 | 58.3 | 14.6 | 27.1 |
| Loan demand | 10.4 | 47.9 | 16.7 | 25.0 |
| Net farm income (excluding federal payments) | 8.3 | 29.2 | 31.3 | 31.3 |
NOTES: 48 responses.
- We anticipate continued pressure on all commodity markets related to exports. On the other hand, import tariffs on commodities may positively impact demand for American ag products.
- There hasn't been enough time since higher tariffs were implemented to give an accurate analysis.
- Drought conditions will keep loan volume about the same, and tariffs will have little effect.
- Poultry production is presently increasing in this market.
- The tariffs will hurt in the short term but will improve everything in this country in the long term.
- Overall, I believe tariffs could weaken the value of local commodities and increase the cost of inputs to further shrink farm net income margins. Increased input costs will increase the dollar amount of operating lines and carryover debt to increase loan demand. Loan repayments will stall as we process through carryover debt.
- It’s too fluid at this point. Long-term tariffs should benefit [the ag industry], but there may be some pain in the short term.
- It will take over a year to see the true impacts of the tariffs.
- Higher input costs could squeeze nonfarm income.
| June '25 (percent) |
|
| Fully | 2.2 |
| Partly | 51.1 |
| Not at all | 8.9 |
| Don’t know | 37.8 |
NOTE: 45 responses.
| June '25 (percent) |
|
| Yes, significantly | 6.7 |
| Yes, somewhat | 20.0 |
| Not really | 53.3 |
| Don’t know | 20.0 |
NOTE: 45 responses.
- A very small number of our farm and ranch customers are directly impacted by tariffs on their products.
- There hasn't been enough time since higher tariffs were implemented to give an accurate analysis.
- Trade policies have little effect on our loan decisions.
- Our trade area is comprised of strong cattle operators and poultry producers with strong contracts in place. Many also have significant oil production as well.
- We always try to consider these matters as best we can.
- We are evaluating credits more thoroughly for secondary sources of repayment and overall farm equity to evaluate the sustainability of the operation if the impacts cause a carryover. Farming unavoidably carries risks outside of our control, with or without trade policy impacts.
| June '25 (percent) |
|
| Yes, significantly | 10.9 |
| Yes, somewhat | 41.3 |
| Not really | 26.1 |
| Don’t know | 21.7 |
NOTE: 46 responses.
- I think all producers are very cognizant of the uncertainty in this regard, which impacts their management decisions whether they are directly impacted by tariffs or not.
- There hasn't been enough time since higher tariffs were implemented to give an accurate analysis.
- Farmers are uncertain about the impact to them of proposed tariffs and how they will be able to market their products and for what price.
- Poultry contracts mitigate fluctuations in the market.
- It is a challenge, and all producers can't afford high-priced consultants, which still don't bat a thousand.
- Although commodity prices globally can weaken, there is still a robust domestic demand especially for grain. The verdict is still out for fiber products.
Special Questions Comments
Survey participants are given the opportunity to submit comments. Some comments have been edited for grammar and clarity.
- Still too early to tell [what the impact of tariffs will be].
For More Information
Questions regarding the Agricultural Survey can be addressed to Mariam Yousuf at Mariam.Yousuf@dal.frb.org.