Agricultural Survey

Survey highlights
Bankers responding to the third-quarter agriculture survey reported somewhat better conditions across most regions of the Eleventh District. Summer rains boosted crop yields in most of the Eleventh District although low commodity prices are weighing down farm incomes. Since this comes on the heels of several years of low yields and low commodity prices, farmers have significant carryover debt and many will struggle without government assistance. Ranchers are doing significantly better than farmers as cattle prices set new records.
“Farmers and ranchers in our area have experienced what may be one of the most favorable summers on record in terms of weather,” said one survey participant. However, many respondents said low commodity prices will prevent farmers from recovering from the weak prior year: “Area farmers are reporting above average yields. However, the price of the commodity is less than anticipated. This will cause less loan repayment and greater carryover of farm debt.” Another commented, “…farmers will struggle to prepare 2026 season budgets with continued increase in costs, weak commodity futures and carrying costs of this year’s crop.”
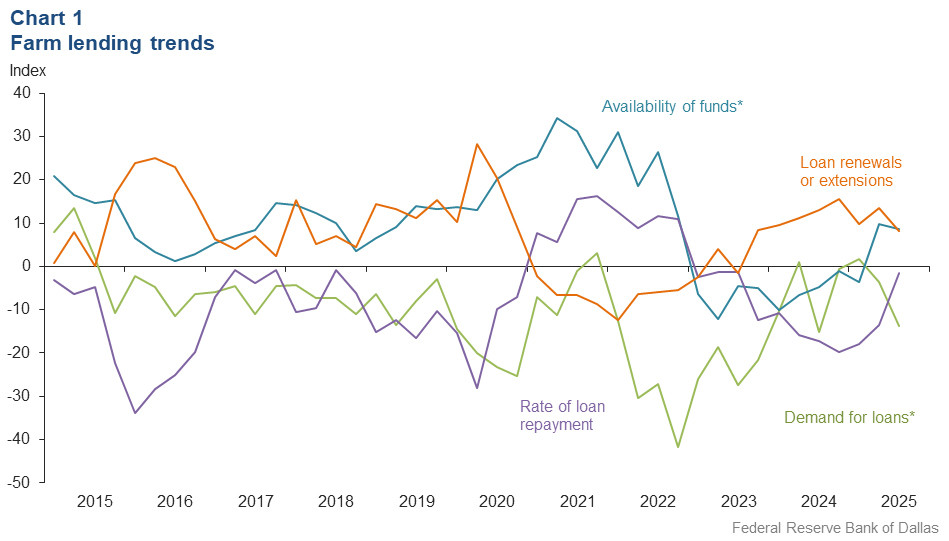
Demand for agricultural loans decreased in the third quarter. Availability of funds increased at the same pace as the second quarter. Loan renewals or extensions continued to rise. The rate of loan repayment declined very slightly and appears to be heading towards stabilization. Except for operating loans, loan volume was down for all remaining categories compared with one year ago (Chart 1).
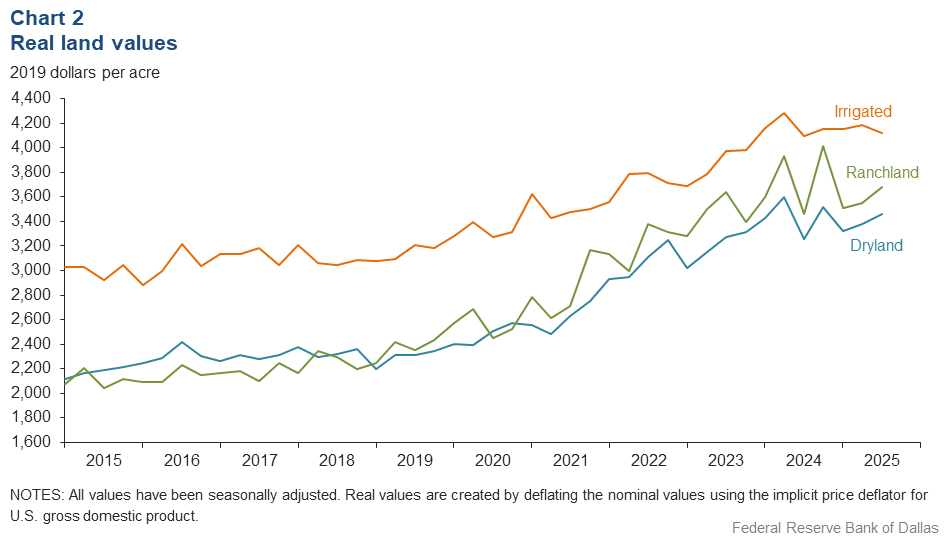
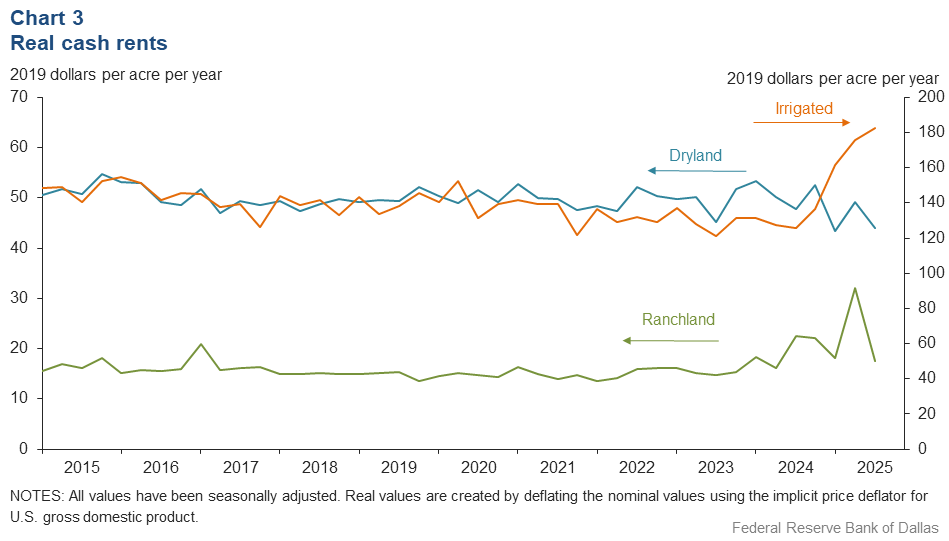
Real land values for dryland and ranchland increased but declined for irrigated land this quarter (Chart 2). In the District, dryland, ranchland, and irrigated land values grew compared to last year with dryland values notching the most growth (Table 1). In the third quarter 2025, real cash rents rose for irrigated land but were down for ranchland and dryland (Chart 3).
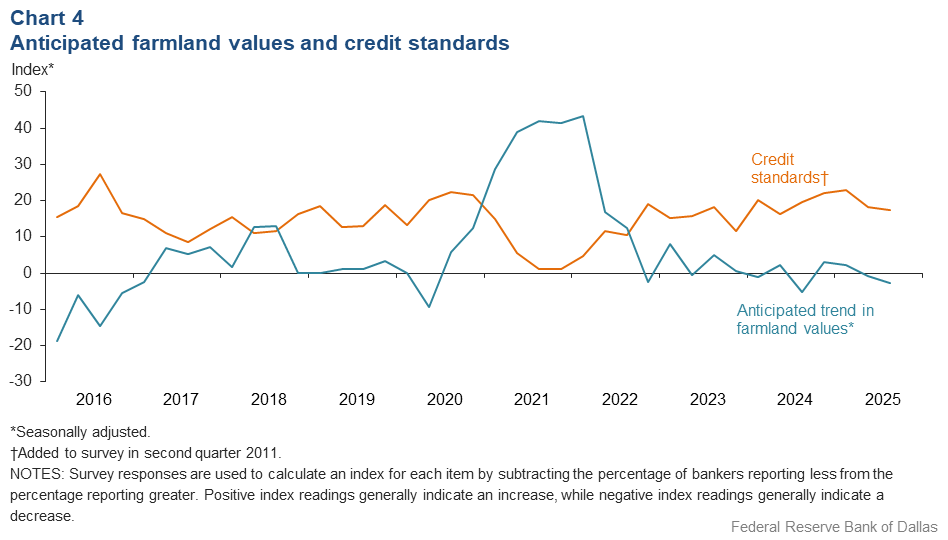
The anticipated trend in farmland values index declined in the third quarter. This implies respondents expect farmland values to decrease. The credit standards index showed an increase in credit tightening at around the same pace as second quarter 2025 (Chart 4). Respondents reported declines in interest rates for all types in the current quarter (Table 2).
Next release: December 22, 2025
Agricultural Survey is compiled from a survey of Eleventh District agricultural bankers, and data have been seasonally adjusted as necessary. Data were collected September 2–10, and 63 bankers responded to the survey.
Quarterly comments

District bankers were asked for additional comments concerning agricultural land values and credit conditions. Some comments have been edited for grammar and clarity.
- [It has been a] very good summer moisture wise. Crop [yields] will be slightly above average, and we will have less irrigation cost due to rainfall. Cattle market continues to drive loan demand due to high cost of replacements.
- Cattle returns have been very good. However, inflated prices may impact stocking rates.
- Irrigated land sales are much higher.
- Farmers and ranchers in our area have experienced what may be one of the most favorable summers on record in terms of weather. Ranchers continue to benefit from exceptionally strong markets, selling calves of all sizes at record prices. Meanwhile, wheat farmers are preparing to plant under excellent conditions. However, many are reconsidering harvesting wheat for grain due to persistently low market prices. For most, penciling out a profit from grain production is proving to be an increasingly difficult task.
- Crops are in fair to good condition for dryland and good for irrigated. It is currently too dry to plant any type of fall grazing, and pastures are in need of rain in our area.
- Dry weather pattern in August and September. Lack of rain will affect cotton yields. Commodity prices on cotton and grains are low but cattle market continues to set a record. I do expect a seasonal price adjustment and maybe more. I am encouraging producers to use some type of price protection at these cattle prices.
- The cotton crop is looking decent as we have seen a fair amount of rainfall and milder summer temperatures than we have seen over the past couple of growing seasons. The milo crop also performed well across the big country, benefiting from the current weather pattern in the area.
- Corn crop has very little left in the fields, average yield reported. Cotton is being poisoned with some cotton harvest taking place in the lower Brazos bottom. Milo harvest complete with average yields. Timely rains have kept pastures in very good condition through early September. Hay production has been above average with several hay fields not being harvested due to the overabundance of hay.
- Although we are getting strong reports on yields of row crop, repayment speeds have been relatively slow as farmers are holding crops longer in hopes that commodity prices will improve. Positive news from the One Big Beautiful Bill Act for increased farm safety nets offers some stability to future farm incomes, but farmers will struggle to prepare 2026 season budgets with continued increase in costs, weak commodity futures and carrying costs of this year’s crop. Farm carryovers are anticipated to increase from the prior year. Diversified operations will still see stable incomes, but borrowers with minimal equity positions or large debt costs may not farm in 2026. Some farmers will need emergency government assistance to continue operating. There is still strong demand for Ag real estate, particularly pastureland, as cattle price trends continue to increase on low cow inventory numbers. Summer heat showers have remained consistent to provide strong summer pasture and demand for replacement females has been strong. There is a mixed bag between farmers and ranchers; farmers are seeing weaker income while ranchers are seeing stronger incomes. Demand for loans on both should remain strong as farmers may need larger operating lines to offset costs, may carry multiyear lines, or may have carryovers while ranchers may utilize financing to increase herd size.
- Financing of feedlot cattle is slowing down in this area.
- Sunflower, sorghum, corn, cotton and sesame harvest are all wrapped up. We’ve had some recent rains that have helped citrus, vegetable and livestock producers, but rains have been spotty. It looks like our irrigated producers are going to be okay this year, mainly because of the Texas Water Treaty Assistance Grant money they received. Our dryland producers look like they may be struggling in some areas. Livestock is still the bright spot in our Ag economy.
- Current prices for alfalfa hay are lower than the previous year, and with the monsoon season, demand is down as well. Cattle markets remain very strong. Other commodity markets such as cotton, wheat and corn remain fairly stable quarter over quarter.
- Area farmers are reporting above average yields. However, the price of the commodity is less than anticipated. This will cause less loan repayment and greater carryover of farm debt. This being the case there will be some farmers put out of business with another year of low revenue. If this turns out to be a below average year following two rough years, it will be devastating for some in the ag-production sector.
Historical data
Historical data can be downloaded dating back to first quarter 2000.
Charts
Farm lending trends
What changes occurred in non-real-estate farm loans at your bank in the past three months compared with a year earlier?
| Index | Percent reporting, Q3 | ||||
| 2025:Q2 | 2025:Q3 | Greater | Same | Less | |
Demand for loans* | –3.6 | –13.8 | 8.3 | 69.6 | 22.1 |
Availability of funds* | 9.7 | 8.7 | 12.0 | 84.7 | 3.3 |
Rate of loan repayment | –13.6 | –1.6 | 8.1 | 82.3 | 9.7 |
Loan renewals or extensions | 13.6 | 8.1 | 9.7 | 88.7 | 1.6 |
| *Seasonally adjusted. | |||||

What changes occurred in the volume of farm loans made by your bank in the past three months compared with a year earlier?
| Index | Percent reporting, Q3 | ||||
| 2025:Q2 | 2025:Q3 | Greater | Same | Less | |
Non–real–estate farm loans | –13.3 | –10.2 | 6.8 | 76.3 | 17.0 |
Feeder cattle loans* | 12.6 | –4.1 | 15.9 | 64.1 | 20.0 |
Dairy loans* | –6.8 | –13.7 | 0.1 | 86.1 | 13.8 |
Crop storage loans* | –10.9 | –5.3 | 7.5 | 79.7 | 12.8 |
Operating loans | 3.4 | 11.3 | 19.4 | 72.6 | 8.1 |
Farm machinery loans* | –25.6 | –21.5 | 3.0 | 72.5 | 24.5 |
Farm real estate loans* | –17.6 | –9.0 | 8.3 | 74.4 | 17.3 |
| *Seasonally adjusted. NOTES: Survey responses are used to calculate an index for each item by subtracting the percentage of bankers reporting less from the percentage reporting greater. Positive index readings generally indicate an increase, while negative index readings generally indicate a decrease. |
|||||
Real land values

Real cash rents

Anticipated farmland values and credit standards
What trend in farmland values do you expect in your area in the next three months?
| Index | Percent reporting, Q3 | ||||
| 2025:Q2 | 2025:Q3 | Up | Same | Down | |
| Anticipated trend in farmland values* | –0.9 | –2.8 | 5.9 | 85.4 | 8.7 |
| *Seasonally adjusted. | |||||
What change occurred in credit standards for agricultural loans at your bank in the past three months compared with a year earlier?
| 2025:Q2 | 2025:Q3 | Up | Same | Down | |
| Credit standards | 18.3 | 17.5 | 17.5 | 82.5 | 0.0 |

Tables
Rural real estate values—third quarter 2025
| Banks1 | Average value2 | Percent change in value from previous year3 | ||
Cropland–Dryland | ||||
| District* | 48 | 3,564 | 6.5 |
| Texas* | 40 | 3,665 | 6.9 |
1 | Northern High Plains | 6 | 1,258 | 7.8 |
2 | Southern High Plains | 6 | 1,192 | 6.4 |
3 | Northern Low Plains* | 3 | 1,304 | 10.2 |
4 | Southern Low Plains* | 4 | 2,197 | –0.6 |
5 | Cross Timbers | n.a. | n.a. | n.a. |
6 | North Central Texas | 4 | 6,813 | 21.1 |
7 | East Texas* | 4 | 5,530 | 20.8 |
8 | Central Texas | 4 | 6,500 | –14.8 |
9 | Coastal Texas | 3 | 3,250 | 5.4 |
10 | South Texas | n.a. | n.a. | n.a. |
11 | Trans–Pecos and Edwards Plateau | n.a. | n.a. | n.a. |
12 | Southern New Mexico | 4 | 663 | 16.7 |
13 | Northern Louisiana | 4 | 3,813 | –5.0 |
Cropland–Irrigated | ||||
| District* | 41 | 4,246 | 4.2 |
| Texas* | 33 | 3,604 | 0.6 |
1 | Northern High Plains | 6 | 3,317 | 2.3 |
2 | Southern High Plains | 4 | 2,750 | 6.7 |
3 | Northern Low Plains* | n.a. | n.a. | n.a. |
4 | Southern Low Plains | 4 | 3,425 | –9.4 |
5 | Cross Timbers | n.a. | n.a. | n.a. |
6 | North Central Texas | 3 | 7,667 | 0.0 |
7 | East Texas | 3 | 7,167 | 26.2 |
8 | Central Texas | 3 | 7,000 | –22.9 |
9 | Coastal Texas | n.a. | n.a. | n.a. |
10 | South Texas | n.a. | n.a. | n.a. |
11 | Trans–Pecos and Edwards Plateau | n.a. | n.a. | n.a. |
12 | Southern New Mexico | 4 | 9,375 | 19.3 |
13 | Northern Louisiana | 4 | 5,250 | –2.3 |
Ranchland | ||||
| District* | 52 | 3,793 | 1.3 |
| Texas* | 43 | 4,511 | 1.3 |
1 | Northern High Plains | 6 | 1,308 | –0.7 |
2 | Southern High Plains | 4 | 1,113 | –1.5 |
3 | Northern Low Plains | n.a. | n.a. | n.a. |
4 | Southern Low Plains* | 4 | 2,758 | 13.8 |
5 | Cross Timbers | n.a. | n.a. | n.a. |
6 | North Central Texas | 4 | 7,438 | 26.6 |
7 | East Texas | 7 | 4,786 | 3.9 |
8 | Central Texas | 4 | 11,500 | –1.1 |
9 | Coastal Texas | 3 | 3,517 | 6.3 |
10 | South Texas | n.a. | n.a. | n.a. |
11 | Trans–Pecos and Edwards Plateau | 5 | 4,950 | –7.3 |
12 | Southern New Mexico | 5 | 690 | 3.9 |
13 | Northern Louisiana | 4 | 3,125 | 1.6 |
| *Seasonally adjusted. 1 Number of banks reporting land values. 2 Prices are dollars per acre, not adjusted for inflation. 3 Not adjusted for inflation and calculated using responses only from those banks reporting in both the past and current quarter. n.a.—Not published due to insufficient responses but included in totals for Texas and district. |
||||
Interest rates by loan type—third quarter 2025
| Feeder cattle | Other farm operating | Intermediate term | Long-term farm real estate | Fixed (average rate, percent) |
2024:Q3 | 9.19 | 9.19 | 8.92 | 8.63 |
2024:Q4 | 8.72 | 8.77 | 8.54 | 8.18 |
2025:Q1 | 8.63 | 8.59 | 8.26 | 7.94 |
2025:Q2 | 8.51 | 8.53 | 8.20 | 7.88 |
2025:Q3 | 8.35 | 8.30 | 8.11 | 7.84 | Variable (average rate, percent) |
2024:Q3 | 9.40 | 9.37 | 9.07 | 8.71 |
2024:Q4 | 8.82 | 8.82 | 8.59 | 8.20 |
2025:Q1 | 8.67 | 8.58 | 8.39 | 8.02 |
2025:Q2 | 8.48 | 8.49 | 8.12 | 7.96 |
2025:Q3 | 8.45 | 8.38 | 8.09 | 7.76 |
For More Information
Questions regarding the Agricultural Survey can be addressed to Mariam Yousuf at Mariam.Yousuf@dal.frb.org.