Dallas Fed Energy Survey

Second Quarter | June 28, 2017
Oil and Gas Expansion Continues but Uncertainty Rises
What's New This Quarter
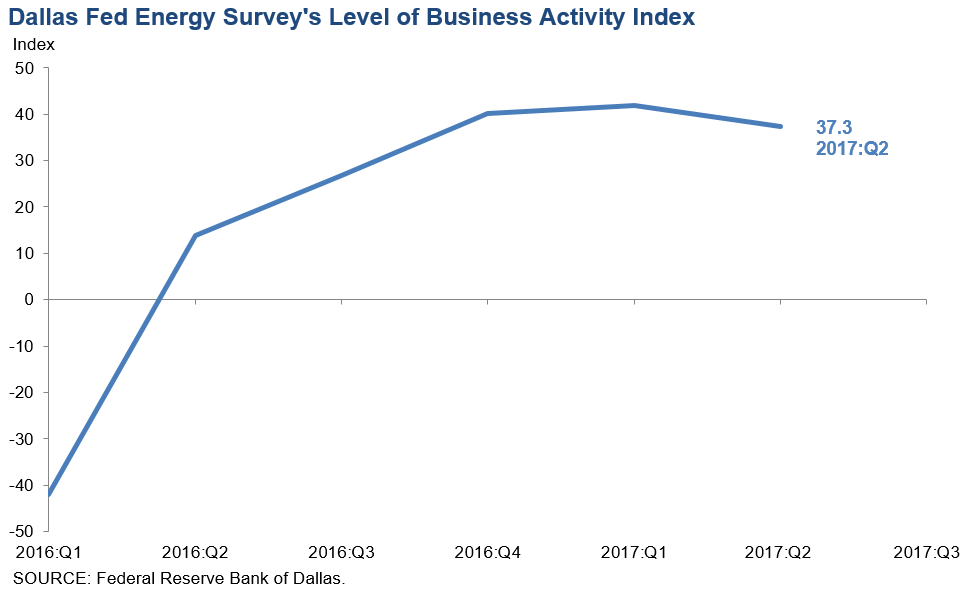
Starting with this quarter’s survey, we have added a chart of the Energy Survey business activity index. This quarter’s special questions include forecasts for OPEC production, expectations on when the global oil market will rebalance and insights on how firms are looking to finance new activity.
Business activity increased in the second quarter, albeit at a slightly slower pace, according to oil and gas executives responding to the Dallas Fed Energy Survey. The business activity index—the survey’s broadest measure of conditions facing Eleventh District energy firms—remained robust at 37.3, slightly below the 41.8 reading last quarter. Despite some deceleration, most other indexes also reflected expansion on a quarterly basis. Responses among oilfield services firms were particularly strong.
Oil and gas production increased for the third quarter in a row, according to executives at exploration and production (E&P) firms. The oil production index was 10.2, down from 13.1 last quarter, and the natural gas production index declined seven points to 10.6. This suggests oil and gas production is rising at a slower pace than last quarter.
The business activity index for oilfield services firms edged up to 49.3—its highest reading since the survey began in first quarter 2016. Utilization of oilfield services firms’ equipment increased, with the corresponding index at 45.4, up from 26.0 last quarter.
Measures of selling prices and input costs suggested some pressure on margins for oilfield services firms. The index of prices received for oilfield services fell to 9.1 from 18.3, while the index of input costs surged to 37.0 from 23.6.
Labor market indexes point to rising employment, employee hours, and wages and benefits. Growth in employment was driven primarily by oilfield services firms. The employment index was 40.3 for services firms versus 5.7 for E&P firms. The employee hours indexes showed a similar gap: 43.3 for services firms versus 8.7 for E&P firms. The aggregate wages and benefits index moved up again, to 22.8 from 17.1.
The company outlook index posted a fifth consecutive positive reading but fell 25 points to 20.3. Uncertainty regarding the outlook rose again. Over 46 percent of firms reported increased uncertainty about the future, up from 33.8 percent last quarter.
On average, respondents expect West Texas Intermediate (WTI) oil prices to climb to $48.79 per barrel by year-end, with responses ranging from $30 to $65 per barrel. Respondents expect Henry Hub natural gas prices will end the year at $3.01 per million British thermal units (MMBtu). For reference, WTI spot prices averaged $43.80 per barrel and Henry Hub spot prices averaged $2.89 per MMBtu during the survey collection period.
Next release: September 27, 2017
Data were collected June 14–22, and 138 energy firms responded to the survey. Of the respondents, 70 were exploration and production firms and 68 were oilfield services firms. The Dallas Fed conducts the Dallas Fed Energy Survey quarterly to obtain a timely assessment of energy activity among oil and gas firms located or headquartered in the Eleventh District. Firms are asked whether business activity, employment, capital expenditures and other indicators increased, decreased or remained unchanged compared with the prior quarter and with the same quarter a year ago. Survey responses are used to calculate an index for each indicator. Each index is calculated by subtracting the percentage of respondents reporting a decrease from the percentage reporting an increase. When the share of firms reporting an increase exceeds the share reporting a decrease, the index will be greater than zero, suggesting the indicator has increased over the previous quarter. If the share of firms reporting a decrease exceeds the share reporting an increase, the index will be below zero, suggesting the indicator has decreased over the previous quarter. |
Second Quarter | June 28, 2017
Price Forecasts
West Texas Intermediate Crude
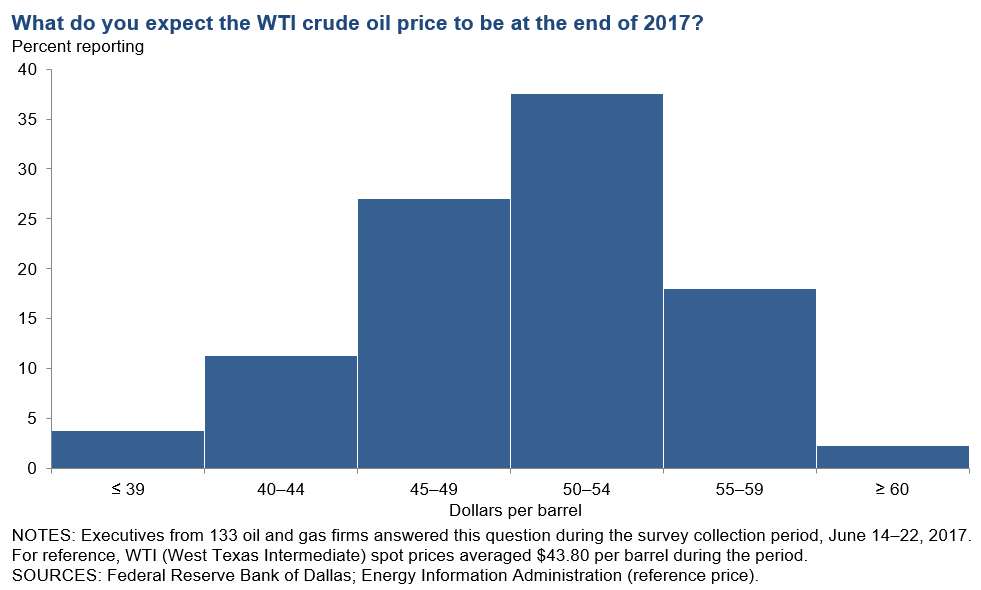
| West Texas Intermediate crude oil price (dollars per barrel), year-end 2017 | ||||
| Indicator | Survey Average | Low Forecast | High Forecast | Price During Survey |
Current quarter | $48.79 | $30.00 | $65.00 | $43.80 |
Prior quarter | $53.49 | $30.00 | $65.00 | $47.73 |
Henry Hub Natural Gas
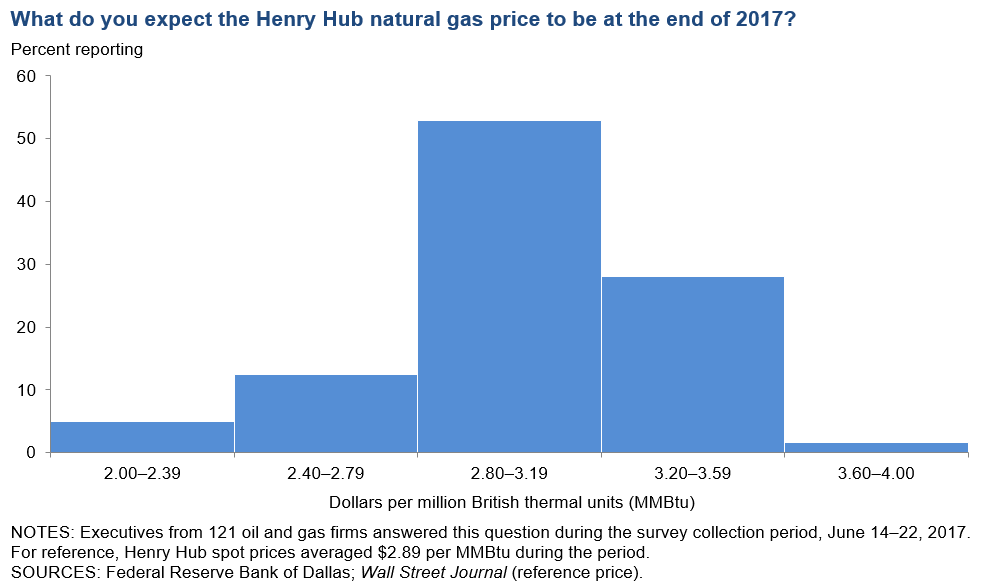
| Henry Hub natural gas price (dollars per MMBtu), year-end 2017 | ||||
| Indicator | Survey Average | Low Forecast | High Forecast | Price During Survey |
Current quarter | $3.01 | $2.00 | $4.00 | $2.89 |
Prior quarter | $2.95 | $1.85 | $3.75 | $2.94 |
NOTE: Price during survey is an average of daily spot prices during the survey collection period.
SOURCES: Energy Information Administration; Wall Street Journal.
Second Quarter | June 28, 2017
Special Questions
Data collected June 14–22, and 134 oil and gas firms responded to the special questions survey.
In light of the recent OPEC meeting and other oil market developments: In what quarter do you think it most likely that the global oil market will come into balance?
The majority of oil and gas executives responding—67 percent—said they expect the oil market to come into balance in 2018 or sooner, with a third saying it will be 2019 or beyond. Eleven percent believe that the balancing will happen sometime in the second half of 2017. Eight percent of respondents believe that the market is either currently in balance or already in deficit.
| When will global oil market be in balance? | Percent reporting |
|||||
Already in deficit |
3 |
|||||
Already in balance |
5 |
|||||
2017:Q3 |
3 |
|||||
2017:Q4 |
8 |
|||||
2018:Q1 |
11 |
|||||
2018:Q2 |
15 |
|||||
2018:Q3 |
12 |
|||||
2018:Q4 |
11 |
|||||
2019– |
33 |
|||||
NOTES: Executives from 112 oil and gas firms answered this question during the survey collection period, June 14–22, 2017. Percentages may not sum to 100 due to rounding. Balance was defined as the quarter when global supply equals global demand; i.e., when global inventories stop growing. SOURCE: Federal Reserve Bank of Dallas. | ||||||
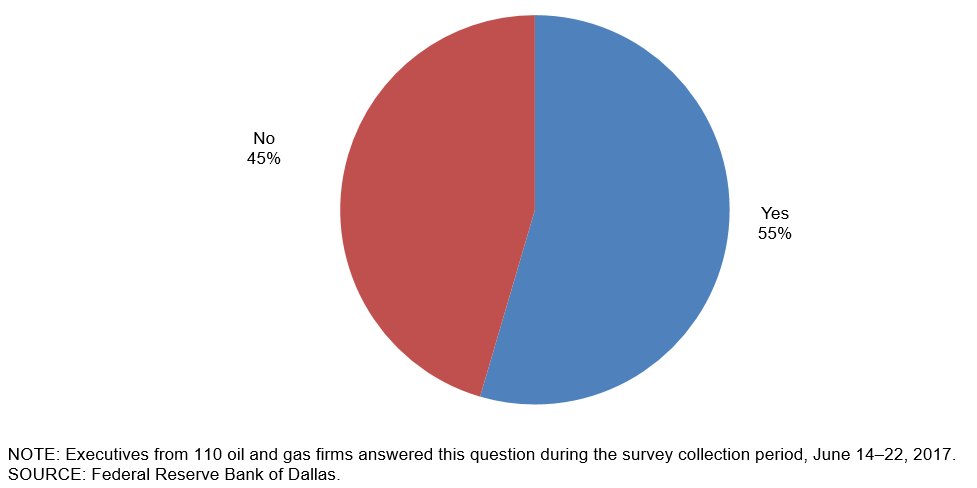
OPEC recently extended its plans to limit oil production through March 2018. Do you expect OPEC to continue to limit its oil production beyond this date?
Oil and gas executives who responded were split; 55 percent expect OPEC will continue to limit its oil production after March 2018, while 45 percent said it will not.
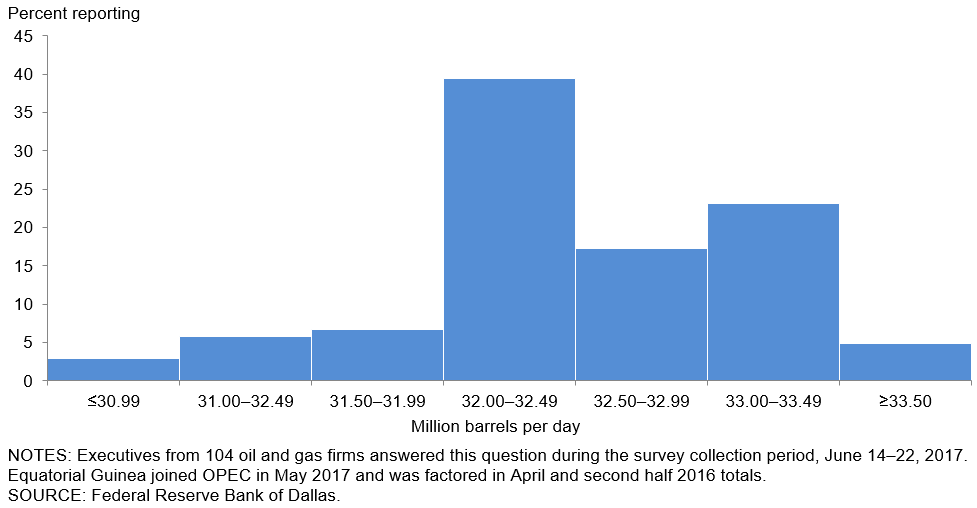
OPEC crude oil production was around 32.0 million barrels per day in April, down from 33.3 in the second half of 2016. How much crude oil do you expect OPEC will produce in the second half of 2017?
Responses were mixed, with many executives expecting that OPEC crude oil production in the second half of 2017 will range between 32.0 and 32.5 million barrels per day. The average response across all respondents was 32.3 million barrels per day.
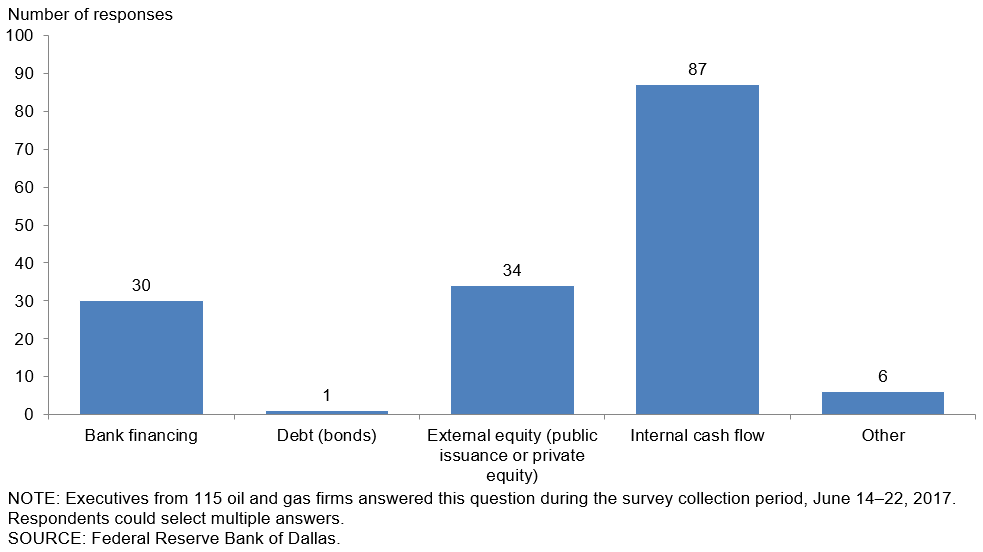
If your firm is increasing its activity, how is it looking to finance this increase?
Many executives (87 out of 115) noted that they are looking to use internal cash flow to finance increased activity. External equity (public issuance or private equity) and bank financing were two other commonly cited sources of financing. (Panelists were able to indicate more than one source of financing.)
Special Questions Comments »
Second Quarter | June 28, 2017
Historical data are available from first quarter 2016 to the most current release quarter.
Business Indicators: Quarter/Quarter
| Business Indicators: All Firms Current Quarter (versus previous quarter) | |||||
| Indicator | Current Index | Previous Index | % Reporting Increase | % Reporting No Change | % Reporting Decrease |
Level of Business Activity | 37.3 | 41.8 | 48.2 | 40.9 | 10.9 |
Capital Expenditures | 18.4 | 31.3 | 36.0 | 46.3 | 17.6 |
Supplier Delivery Time | 2.9 | 6.1 | 11.9 | 79.1 | 9.0 |
Employment | 22.6 | 7.2 | 29.9 | 62.8 | 7.3 |
Employee Hours | 25.7 | 15.9 | 33.8 | 58.1 | 8.1 |
Wages and Benefits | 22.8 | 17.1 | 27.9 | 66.9 | 5.1 |
| Indicator | Current Index | Previous Index | % Reporting Improved | % Reporting No Change | % Reporting Worsened |
Company Outlook | 20.3 | 45.6 | 41.4 | 37.6 | 21.1 |
| Indicator | Current Index | Previous Index | % Reporting Increase | % Reporting No Change | % Reporting Decrease |
Uncertainty | 35.0 | 15.9 | 46.7 | 41.6 | 11.7 |
| Business Indicators: E&P Firms Current Quarter (versus previous quarter) | |||||
| Indicator | Current Index | Previous Index | % Reporting Increase | % Reporting No Change | % Reporting Decrease |
Level of Business Activity | 25.7 | 35.9 | 37.1 | 51.4 | 11.4 |
Oil Production | 10.2 | 13.1 | 29.0 | 52.2 | 18.8 |
Natural Gas Wellhead Production | 10.6 | 17.6 | 25.8 | 59.1 | 15.2 |
Capital Expenditures | 16.0 | 27.3 | 34.8 | 46.4 | 18.8 |
Expected Level of Capital Expenditures Next Year | 17.9 | 44.9 | 40.3 | 37.3 | 22.4 |
Supplier Delivery Time | 5.9 | 5.4 | 14.7 | 76.5 | 8.8 |
Employment | 5.7 | –6.4 | 15.7 | 74.3 | 10.0 |
Employee Hours | 8.7 | –1.3 | 14.5 | 79.7 | 5.8 |
Wages and Benefits | 18.8 | 19.2 | 24.6 | 69.6 | 5.8 |
Finding and Development Costs | 18.8 | 13.3 | 27.5 | 63.8 | 8.7 |
Lease Operating Expenses | 13.1 | 2.7 | 23.2 | 66.7 | 10.1 |
| Indicator | Current Index | Previous Index | % Reporting Improved | % Reporting No Change | % Reporting Worsened |
Company Outlook | 10.1 | 38.2 | 36.2 | 37.7 | 26.1 |
| Indicator | Current Index | Previous Index | % Reporting Increase | % Reporting No Change | % Reporting Decrease |
Uncertainty | 37.2 | 19.7 | 48.6 | 40.0 | 11.4 |
| Business Indicators: O&G Support Services Firms Current Quarter (versus previous quarter) | |||||
| Indicator | Current Index | Previous Index | % Reporting Increase | % Reporting No Change | % Reporting Decrease |
Level of Business Activity | 49.3 | 48.0 | 59.7 | 29.9 | 10.4 |
Utilization of Equipment | 45.4 | 26.0 | 54.5 | 36.4 | 9.1 |
Capital Expenditures | 20.9 | 35.6 | 37.3 | 46.3 | 16.4 |
Supplier Delivery Time | 0.0 | 6.9 | 9.1 | 81.8 | 9.1 |
Lag Time in Delivery of Firm's Services | 7.5 | 2.8 | 13.6 | 80.3 | 6.1 |
Employment | 40.3 | 21.6 | 44.8 | 50.7 | 4.5 |
Employment Hours | 43.3 | 34.2 | 53.7 | 35.8 | 10.4 |
Wages and Benefits | 26.8 | 14.8 | 31.3 | 64.2 | 4.5 |
Input Costs | 37.0 | 23.6 | 38.5 | 60.0 | 1.5 |
Prices Received for Services | 9.1 | 18.3 | 22.7 | 63.6 | 13.6 |
| Indicator | Current Index | Previous Index | % Reporting Improved | % Reporting No Change | % Reporting Worsened |
Company Outlook | 31.3 | 53.4 | 46.9 | 37.5 | 15.6 |
| Indicator | Current Index | Previous Index | % Reporting Increase | % Reporting No Change | % Reporting Decrease |
Uncertainty | 32.9 | 12.0 | 44.8 | 43.3 | 11.9 |
Business Indicators: Year/Year
| Business Indicators: All Firms Current Quarter (versus same quarter a year ago) | |||||
| Indicator | Current Index | Previous Index | % Reporting Increase | % Reporting No Change | % Reporting Decrease |
Level of Business Activity | 49.2 | 55.8 | 65.9 | 17.5 | 16.7 |
Capital Expenditures | 28.2 | 37.5 | 50.0 | 28.2 | 21.8 |
Supplier Delivery Time | 9.8 | 10.3 | 20.5 | 68.9 | 10.7 |
Employment | 16.0 | 2.1 | 31.2 | 53.6 | 15.2 |
Employee Hours | 28.8 | 19.9 | 40.0 | 48.8 | 11.2 |
Wages and Benefits | 29.0 | 22.2 | 37.9 | 53.2 | 8.9 |
| Indicator | Current Index | Previous Index | % Reporting Improved | % Reporting No Change | % Reporting Worsened |
Company Outlook | 41.4 | 60.3 | 57.8 | 25.9 | 16.4 |
| Business Indicators: E&P Firms Current Quarter (versus same quarter a year ago) | |||||
| Indicator | Current Index | Previous Index | % Reporting Increase | % Reporting No Change | % Reporting Decrease |
Level of Business Activity | 39.0 | 57.1 | 57.8 | 23.4 | 18.8 |
Oil Production | 17.8 | 15.1 | 45.2 | 27.4 | 27.4 |
Natural Gas Wellhead Production | 17.2 | 21.2 | 36.2 | 44.8 | 19.0 |
Capital Expenditures | 17.4 | 37.4 | 44.4 | 28.6 | 27.0 |
Expected Level of Capital Expenditures Next Year | 13.3 | 56.8 | 40.0 | 33.3 | 26.7 |
Supplier Delivery Time | 5.0 | 12.5 | 16.7 | 71.7 | 11.7 |
Employment | –3.1 | –9.4 | 14.1 | 68.8 | 17.2 |
Employee Hours | 6.4 | 5.4 | 15.9 | 74.6 | 9.5 |
Wages and Benefits | 23.8 | 20.5 | 33.3 | 57.1 | 9.5 |
Finding and Development Costs | 17.7 | 17.8 | 30.6 | 56.5 | 12.9 |
Lease Operating Expenses | 5.0 | –2.8 | 23.0 | 59.0 | 18.0 |
| Indicator | Current Index | Previous Index | % Reporting Improved | % Reporting No Change | % Reporting Worsened |
Company Outlook | 25.5 | 59.1 | 47.5 | 30.5 | 22.0 |
| Business Indicators: O&G Support Services Firms Current Quarter (versus same quarter a year ago) | |||||
| Indicator | Current Index | Previous Index | % Reporting Increase | % Reporting No Change | % Reporting Decrease |
Level of Business Activity | 59.7 | 54.4 | 74.2 | 11.3 | 14.5 |
Utilization of Equipment | 54.1 | 43.9 | 65.6 | 23.0 | 11.5 |
Capital Expenditures | 39.3 | 37.9 | 55.7 | 27.9 | 16.4 |
Supplier Delivery Time | 14.5 | 7.8 | 24.2 | 66.1 | 9.7 |
Lag Time in Delivery of Firm's Services | 16.2 | 7.6 | 21.0 | 74.2 | 4.8 |
Employment | 36.1 | 15.2 | 49.2 | 37.7 | 13.1 |
Employment Hours | 51.6 | 35.8 | 64.5 | 22.6 | 12.9 |
Wages and Benefits | 34.4 | 23.9 | 42.6 | 49.2 | 8.2 |
Input Costs | 43.6 | 25.7 | 46.8 | 50.0 | 3.2 |
Prices Received for Services | 18.3 | 28.6 | 33.3 | 51.7 | 15.0 |
| Indicator | Current Index | Previous Index | % Reporting Improved | % Reporting No Change | % Reporting Worsened |
Company Outlook | 57.9 | 61.5 | 68.4 | 21.1 | 10.5 |
Second Quarter | June 28, 2017
Activity Chart
Second Quarter | June 28, 2017
Comments from Survey Respondents
These comments are from respondents’ completed surveys and have been edited for publication. Comments from the Special Questions survey can be found below.
Exploration and Production Firms
- Anytime one introduces artificial elements to supply and demand, you create volatility that cannot be predicted. Hoping that OPEC will adhere to their production goals is fantasy. Yes, they will to the extent that they believe it will improve their fiscal domestic situation. However, it is artificial. The market realizes this and penalizes the industry for what it perceives to be manipulation. Couple that with our incredible advances technologically and you have a market ripe for continued softness.
- The exploration and production industry needs to get used to the paradigm that oil prices will be set for the next several years by the breakeven prices needed to drill Permian Basin shale wells because there is a “lot of tiger in this tank!”
- Horizontal drilling is keeping oil prices in the $40-to-$45 range until demand worldwide is able to recover. It’s unlikely anytime soon.
- The past weeks’ oil price drop and the accompanying world news is very discouraging for any near-term price improvement.
- I expect that OPEC will not be able to adhere to the so-called production cuts. It has all been window dressing.
- I am relying on "volunteer time" to survive. I am pretty sure the light at the end of the tunnel is definitely a “muzzle flash”! Our operators are having problems sustaining profitability. Many are trying creative ways of passing overhead and profit contribution items onto non-operating partners via monthly joint interest billings (JIBs). If you’re not a shale driller, nobody will fund you anymore. The Affordable Care Act insurance costs really skyrocketed in first quarter 2017, driving us deeper into red ink. Lots of non-operating partners in projects are falling out, and I’m hearing of many operators having problems getting their working-interest owners to pay JIBs. The U.S. needs to reflect upon the history and success of the IOGCC (Interstate Oil and Gas Compact Commission) in stabilizing oil and gas production, employment, state budgets and tax bases, funding for bridges and roads, etc., via pro-rationing. This pseudo-war with OPEC could otherwise become one horribly ugly and long, drawn-out war of attrition that will erode the tax bases of the states and have a horrible impact on the infrastructure of the states and the nation. It would also further collapse the industry’s employment.
- Increased production in the United States is offsetting the OPEC production cuts. In addition, sluggish demand for petroleum products suggests lower prices. If there is backwardation in the futures market, it will hinder forward sales.
- The continued glut of inventories and weak crude prices below $50 per barrel have increased uncertainty and reduced cash flow. Coupled with cost increases for pressure-pumping services, drilling rigs, tubulars and other drilling and completion services, our rates of return are reduced from last quarter and this time last year.
- Basis differentials on gas assets are having a large impact on our realized prices. Uncertainty on crude prices is not currently affecting our results, but should prices maintain sub-$40, we would be affected.
- Vertical well drilling contractor availability is a bit less. Permian Basin production increases appear to be driving oil prices down.
- So long as production growth exceeds demand growth, there is no potential for sustainable price escalation except in response to an event that challenges the status quo politically or militarily. The price increase in that context will only be sustainable so long as the event effects are continuing, literally or as a market perception. OPEC production cuts are becoming more and more symbolic in a market that has moved from one historically of perception to one of reality. “My tank runneth over,” and there is more in the pipeline.
- I believe that we will be much closer to a balance between supply and demand by the end of 2017. Summer activity should increase demand, at least short term.
- We expect business conditions to be challenging through the end of 2018 but to improve substantially in 2019, when we believe that oil supply will have trouble keeping up with worldwide natural field decline. We expect natural gas prices to stay stable and reasonable in the U.S. as U.S. exports of liquefied natural gas increase and as natural gas continues to displace coal in power generation.
- Gas demand is up and production increases will be offset by the increase in demand plus depletion, especially offshore. Storage refills will be less than last year. Large oil inventories will keep oil prices depressed, but “stupid money” will keep rig activity up and drilled but uncompleted (DUC) well counts growing. A lot of equity is being destroyed.
- The outlook for downward pressure on oil prices is encouraging us to invest capital in areas other than oil and gas.
- We had hoped for or viewed oil to be stronger in 2017 but now see it more level at $45 to $55 through 2017.
- We are in the initial phase of a drilling program on the North Basin platform in the Permian Basin, and I am having real concern at $45 oil that the margins are so skinny we may need to delay our program, especially with costs escalating.
Oil and Gas Support Services Firms
- Uncertainty seems the best description. Rig count and production continue to grow, while commodity prices are as uncertain as ever. Any animal spirits seem to be tamped down as quickly as they emerge.
- The current price of West Texas Intermediate is a major concern. If the price remains below $45 for an extended period of time, we will see activity plateau and potentially drop in the third quarter.
- We are an oilfield services company with proprietary products. Sales cycles are usually long, and the downturn has made them longer. Operators are asking for lower pricing.
- Recent volatility in crude has caused some real problems for our equity value, borrowing capacity and liquidity.
- Margins are still slim. Utilization rates are up.
- We are seeing significant delays for some materials, which took us a bit by surprise. We have found other suppliers to meet our timelines thus far, but it seems to be tighter and faster this time around.
- There is not enough time in the day to cover all the due-diligence jobs due to the acquisitions and divestitures between companies. I've had to put on extra crews to handle different areas and to handle all the requests, and there is still plenty to go around. Nice problem to have!
- Mergers of survival will continue.
- West Texas is where it’s at, but unfortunately, our cash flow has made it hard to dedicate capital to this for expansion. Maybe the fourth quarter will allow us to do the move.
- I stand by my prediction that the price of oil will be in the $30 range by the end of the year as a result of simple supply and demand. Production increases in the United States will put downward pressure on the price of oil and will more than offset OPEC’s efforts to buoy the price by artificial manipulation of the supply.
- There are too many rigs running and too much production coming online. The oil glut continues, and operators are ignoring market signals. This is being caused by non-oil capital flooding into the frenzy, hoping to find a bigger fool to buy them out at a grossly exaggerated price. The bigger-fool theory is not a sustainable business model. Oil prices will get much lower before the turnaround, and the crash caused by withdrawal of capital from the Permian Basin will be severe.
- Business is much improved, and we’ve not seen an impact from the recent (May/June) oil price decline yet.
Special Questions Comments
Oil and Gas Extraction
- Shale wells drilled but uncompleted are a ready inventory in addition to oil in storage. Going forward, the oil story will be demand driven rather than limited by supplies. I look for decreasing demand in the next decade.
- We have sold the majority of our assets, as we do not believe oil and gas prices will rise over the next five years. Prices being paid for acreage are way too high. It’s a great time to exit the business.
- Money for projects is harder to obtain due to the seismic shift in what is considered to be investment-worthy due to the shale plays and horizontal manufacturing we are doing in the patch today. Primary plays of the past are not in fashion. Large developmental plays are the “catch of the day.”
- My comments are based on our current environment. If we should experience increased geopolitical turmoil, then this all changes. At the end of the day, our achievements in increasing production are beneficial to everyone except the energy business. Being able to become substantially more independent, along with becoming the swing provider worldwide, will prove to be consequential to the U.S.’ improved economic condition over the next five years.
Oil and Gas Support Services Firms
- We are continuing to hope our business can ride out these prices.
- We must continue to insist on OPEC’s reduction and someday the total exclusion of importing their oil. The U.S. has enough oil, proven and undeveloped, to support the U.S. for the next several hundred years and beyond. OPEC and all other countries that support OPEC can supply the rest of the world and let us supply our own country. Self-sufficient—that is, if the administration will not sell off our reserves!
- We do not use debt to finance activities.
- I see much more downside to prices than upside. I am curtailing all unnecessary activity, cutting costs wherever possible (salaries included) and not taking on any new projects. I feel very pessimistic regarding the outlook for traditional oil and gas operators. We are being crushed by the influx of capital from outside the business, the imprudent development of shale oil and the associated weak oil prices.
- Currently, we are still responding to the weekly increase in rig activity. Since our business is completions focused, we should have some lead time to react to any decline in activity as a result of weak prices for WTI. Today, we are sold out and trying to add capacity, but that situation could change abruptly.
Questions regarding the Dallas Fed Energy Survey can be addressed to Michael Plante at Michael.Plante@dal.frb.org or Kunal Patel at Kunal.Patel@dal.frb.org.
Sign up for our e-mail alert to be automatically notified as soon as the latest Dallas Fed Energy Survey is released on the web.