Dallas Fed Energy Survey

First Quarter | March 28, 2018
Oil and Gas Activity Expands Robustly
What's New This Quarter
Special questions this quarter include an annual update to our data on breakeven prices by basin, expected changes in employee headcounts for 2018 and insights on the impact of the new tax law on upstream firms.
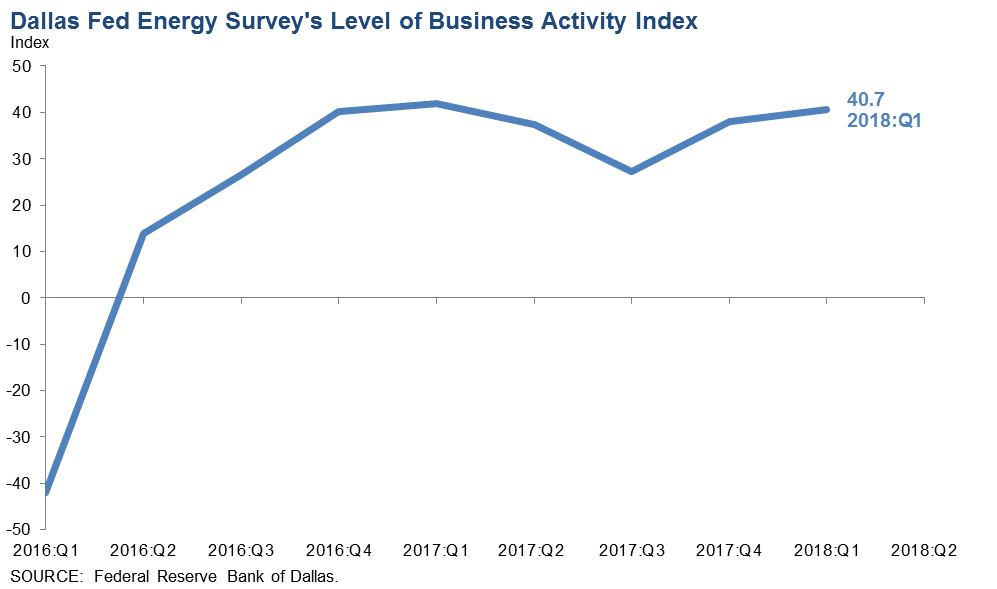
Energy sector activity strengthened further in first quarter 2018, according to oil and gas executives responding to the Dallas Fed Energy Survey. The business activity index—the survey’s broadest measure of conditions facing Eleventh District energy firms—advanced from 38.1 in the fourth quarter to 40.7 in the first. The increase was driven by the oilfield services side of the industry.
Positive readings in the survey generally indicate expansion, while readings below zero generally indicate contraction. Almost all indexes in the latest survey reflected expansion on a quarterly basis.
Oil and gas production increased for the sixth quarter in a row, according to executives at exploration and production (E&P) firms. The oil production index ticked up slightly from 33.7 in the fourth quarter to 34.3 in the first. Meanwhile, the natural gas production index edged down from 26.6 to 25.0.
Utilization of oilfield services firms’ equipment increased at a faster pace than in the fourth quarter, with the corresponding index at 40.4, up 11 points. The index of input costs jumped from 30.9 to 46.8, suggesting greater cost pressures. The index of prices received for oilfield services rose more modestly, from 22.6 to 27.9.
Labor market indexes continue to point to rising employment and employee hours, with job growth primarily driven by oilfield services firms. The employment index was 37.1 for services firms versus 9.0 for E&P firms. The employee hours indexes also showed a large gap: 41.9 for services firms versus 16.9 for E&P firms. The aggregate wages and benefits index advanced from 25.5 to 33.8, with most of the increase coming from the oilfield services side of the industry.
The company outlook index posted an eighth consecutive positive reading but fell nine points to 43.2 in the first quarter. Uncertainty regarding firms’ outlooks was roughly unchanged this quarter—the corresponding index came in near zero.
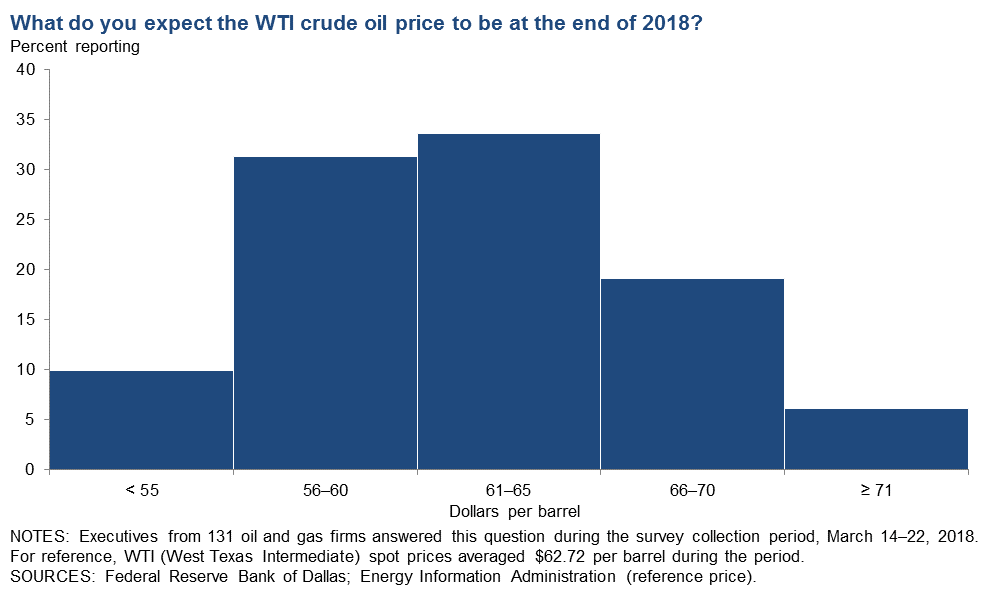
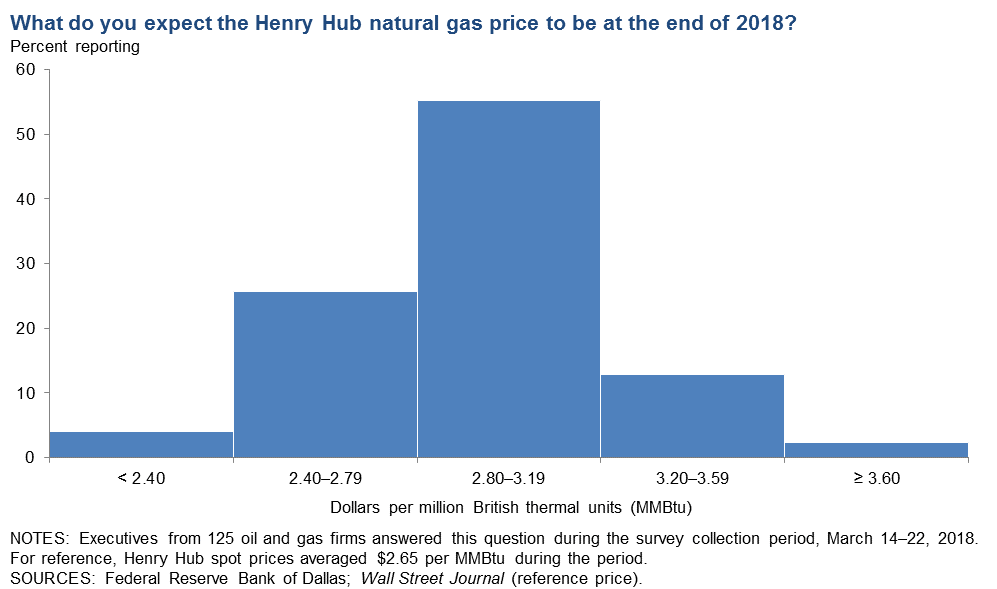
On average, respondents expect West Texas Intermediate (WTI) oil prices to be $63.07 per barrel by year-end 2018, with responses ranging from $45 to $77 per barrel. Respondents expect Henry Hub natural gas prices to end 2018 at $2.91 per million British thermal units (MMBtu). For reference, WTI spot prices averaged $62.72 per barrel and Henry Hub spot prices averaged $2.65 per MMBtu during the survey collection period.
Next release: June 27, 2018
|
Data were collected March 14–22, and 140 energy firms responded to the survey. Of the respondents, 78 were exploration and production firms and 62 were oilfield services firms. The Dallas Fed conducts the Dallas Fed Energy Survey quarterly to obtain a timely assessment of energy activity among oil and gas firms located or headquartered in the Eleventh District. Firms are asked whether business activity, employment, capital expenditures and other indicators increased, decreased or remained unchanged compared with the prior quarter and with the same quarter a year ago. Survey responses are used to calculate an index for each indicator. Each index is calculated by subtracting the percentage of respondents reporting a decrease from the percentage reporting an increase. When the share of firms reporting an increase exceeds the share reporting a decrease, the index will be greater than zero, suggesting the indicator has increased over the previous quarter. If the share of firms reporting a decrease exceeds the share reporting an increase, the index will be below zero, suggesting the indicator has decreased over the previous quarter. |
First Quarter | March 28, 2018
Price Forecasts
West Texas Intermediate Crude
| West Texas Intermediate crude oil price (dollars per barrel), year-end 2018 | ||||
| Indicator | Survey Average | Low Forecast | High Forecast | Price During Survey |
|
Current quarter |
$63.07 |
$45.00 |
$77.00 |
$62.72 |
|
Prior quarter |
$58.98 |
$45.00 |
$95.00 |
$57.42 |
Henry Hub Natural Gas
| Henry Hub natural gas price (dollars per MMBtu), year-end 2018 | ||||
| Indicator | Survey Average | Low Forecast | High Forecast | Price During Survey |
|
Current quarter |
$2.91 |
$1.30 |
$4.00 |
$2.65 |
|
Prior quarter |
$3.05 |
$1.95 |
$4.50 |
$2.67 |
NOTE: Price during survey is an average of daily spot prices during the survey collection period.
SOURCES: Energy Information Administration; Wall Street Journal.
First Quarter | March 28, 2018
Special Questions
Data were collected March 14–22, and 136 oil and gas firms responded to the special questions survey.
Exploration and Production (E&P) Firms
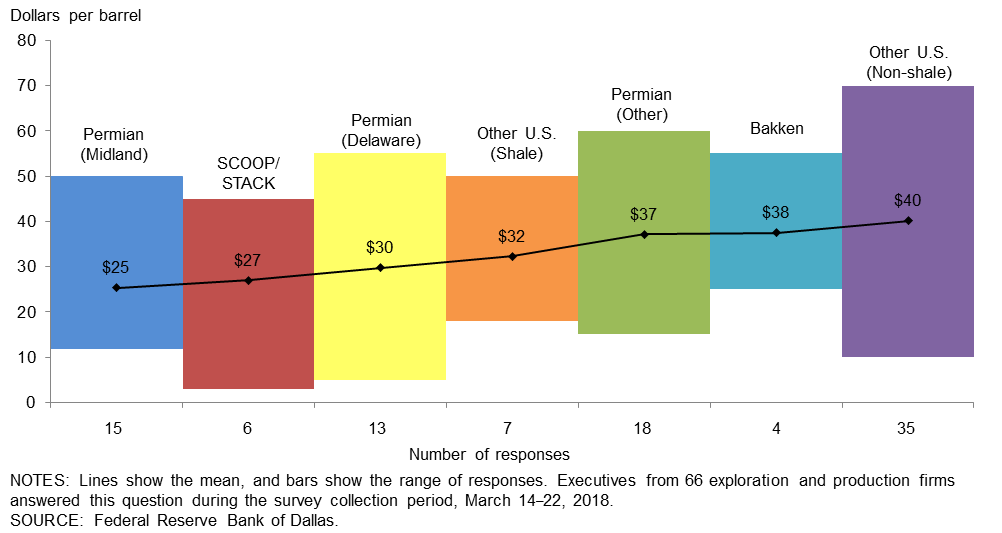
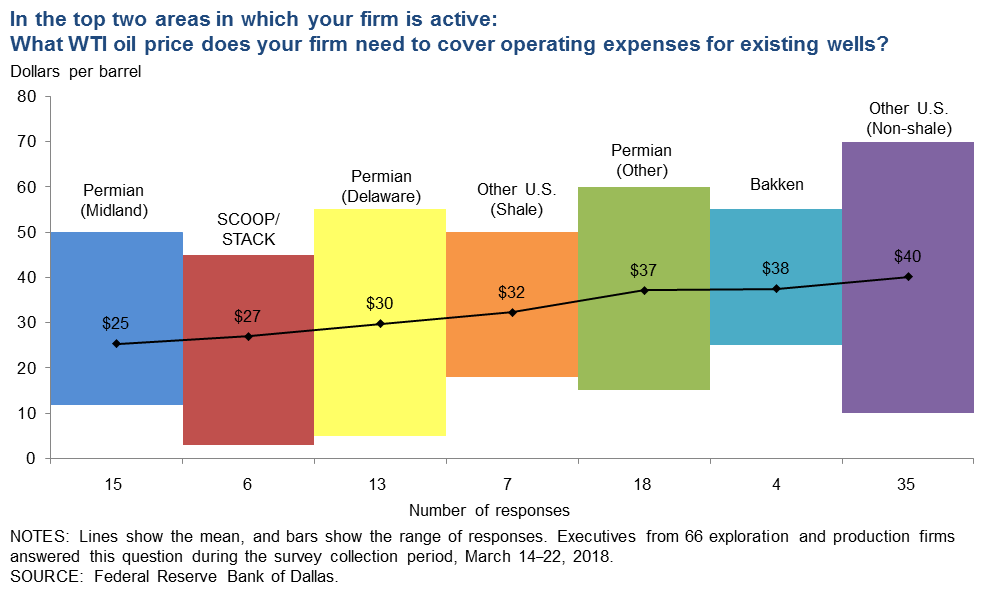
In the top two areas in which your firm is active: What WTI oil price does your firm need to cover operating expenses for existing wells?
Average prices necessary to cover operating expenses across regions range from $25 to $40 per barrel. Almost all respondents can cover operating expenses for existing wells at current prices. Overall, operating expenses are near those observed in last year’s first-quarter survey, with the average across the sample at approximately $35 per barrel, versus $33 per barrel last year.
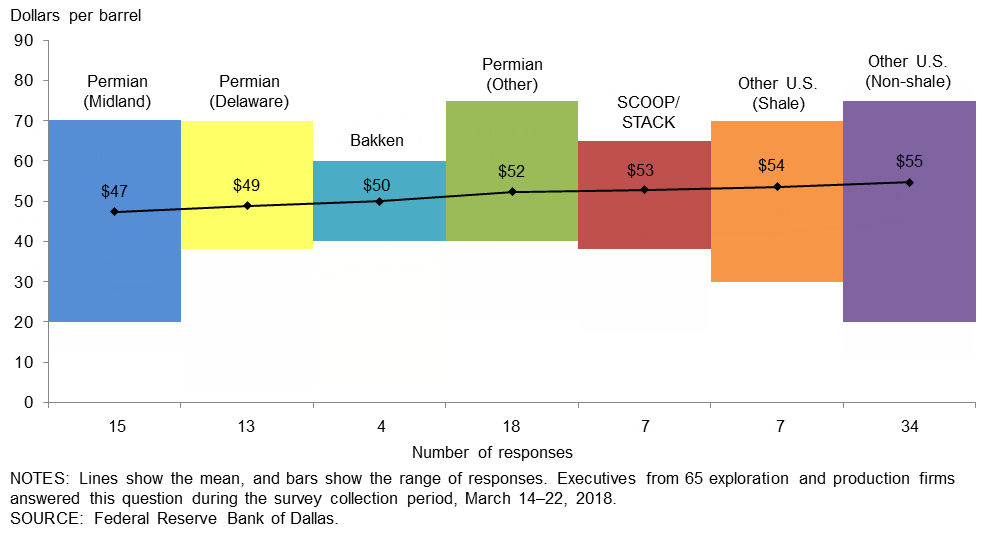
In the top two areas in which your firm is active: What WTI oil price does your firm need to profitably drill a new well?
Average breakeven prices to profitably drill a new well range from $47 to $55 per barrel, depending on the region. For the entire sample, firms need $52 per barrel on average to profitably drill a new well, up from $50 per barrel when the same question was asked last year but lower than the $54 per barrel in 2016. Average breakeven prices in the Permian Basin rose to $50 per barrel this year from $48 last year. The vast majority of firms in the survey can profitably drill a new well at current prices; 88 percent of responses are below the WTI spot price on March 23 ($66 per barrel).
All Firms
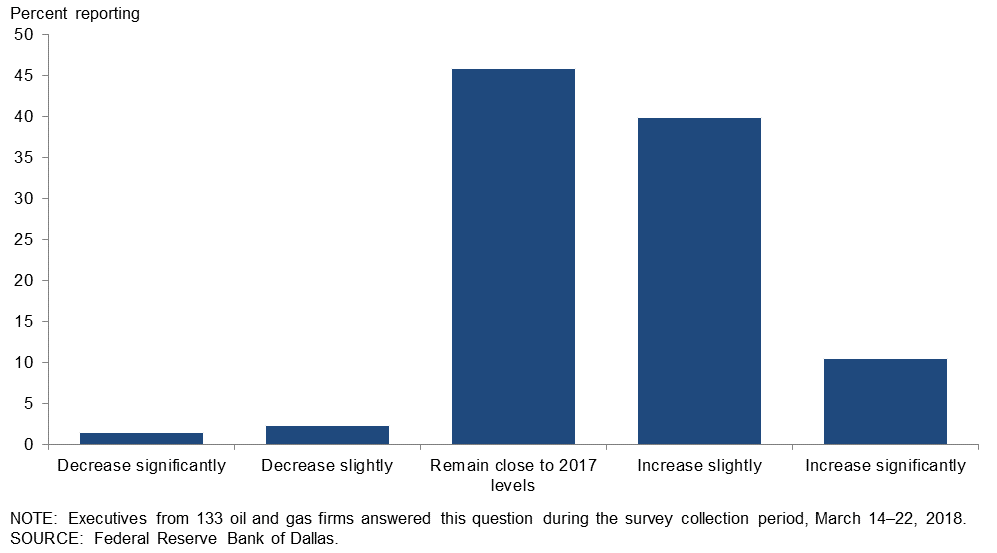
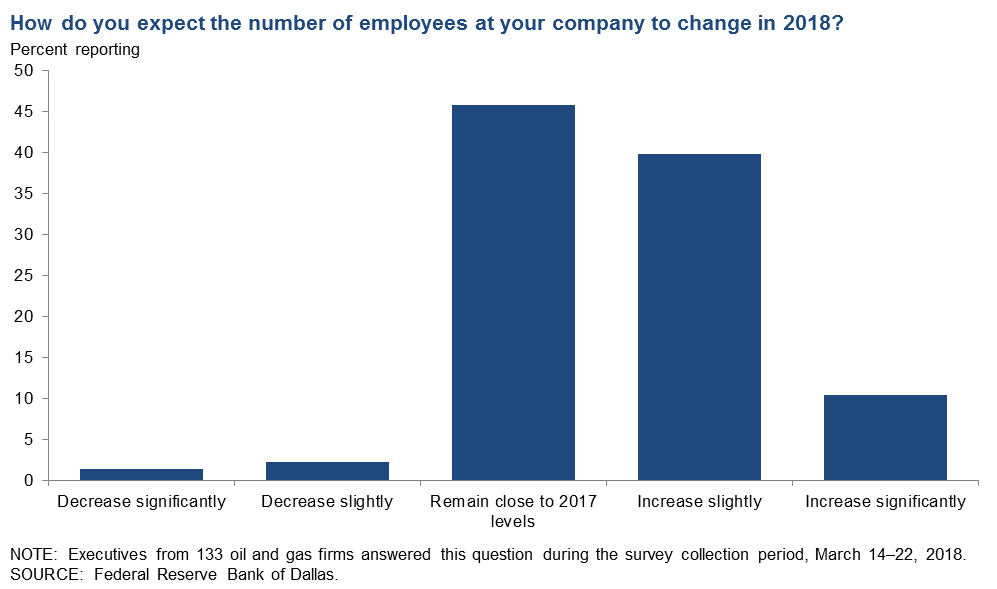
How do you expect the number of employees at your company to change in 2018?
Fifty-one percent of executives expect the number of employees to increase from 2017 levels: 11 percent expect a significant increase and 40 percent expect a slight increase. Forty-six percent of executives expect the number of employees at their company in 2018 to remain close to 2017 levels. Only 4 percent expect the number of employees to decrease in 2018. Most of the anticipated increases come from oil and gas support services firms; however, some E&P firms anticipate a slight increase in headcount in 2018. (See table for more detail.)
| Percent Reporting | All Firms | E&P | Services |
| Decrease significantly | 2 | 1 | 2 |
| Decrease slightly | 2 | 4 | 0 |
| Remain close to 2017 levels | 46 | 61 | 28 |
| Increase slightly | 40 | 31 | 51 |
| Increase significantly | 11 | 3 | 20 |
|
NOTES: Executives from 72 exploration and production firms and 61 oil and gas support services firms answered this question during the survey collection period, March 14–22, 2018. The “E&P” column reports the percent of E&P firms out of the 72 E&P responses that chose a particular answer. Likewise, the “Services” column reports the percent of O&G support services firms out of 61 services responses that chose a particular answer. The “All Firms” column reports the percentage out of the total 133 responses. Percentages may not sum to 100 due to rounding.
|
|||
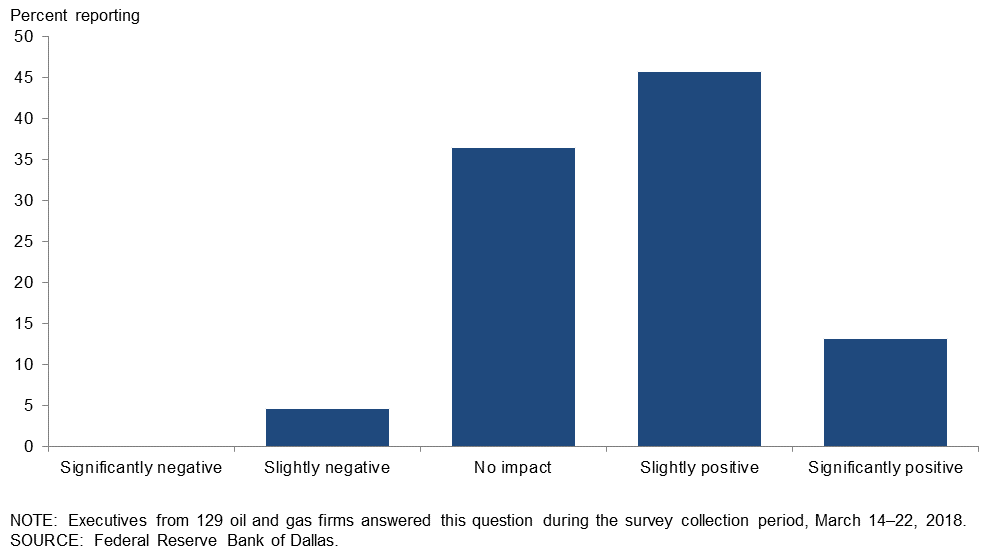
How will the new federal tax law, passed in December, affect your business on net?
Forty-six percent of executives expect the new federal tax law, passed in December, to have a slightly positive impact on their businesses. Thirteen percent of respondents, mostly oil and gas support services firms, expect a significantly positive impact. Thirty-six percent expect to see no impact on their businesses, while 5 percent foresee a slightly negative impact from the new tax law. (See table for more detail.)
| Percent Reporting | All Firms | E&P | Services |
| Significantly negative | 0 | 0 | 0 |
| Slightly negative | 5 | 6 | 3 |
| No impact | 36 | 38 | 35 |
| Slightly positive | 46 | 51 | 40 |
| Significantly positive | 13 | 6 | 22 |
|
NOTES: Executives from 69 exploration and production firms and 60 oil and gas support services firms answered this question during the survey collection period, March 14–22, 2018. The “E&P” column reports the percent of E&P firms out of the 69 E&P responses that chose a particular answer. Likewise, the “Services” column reports the percent of O&G support services firms out of 60 services responses that chose a particular answer. The “All Firms” column reports the percentage out of the total 129 responses. Percentages may not sum to 100 due to rounding. |
|||
Special Questions Comments
Exploration and Production Firms
- Uncertainty in steel tariff provisions is leading to uncertainty in cost outlook. Longer term, the tariff has the potential to impact many facets of the industry and could create additional inflationary pressures while it is in place. The new federal tax policy can help operators mitigate cost pressures from U.S.-based suppliers. Oilfield suppliers’ after-tax cost of capital equipment and expenditures decreases due to expensing provisions and time value of money.
- The outlook for small oil and gas companies operating in the Permian Basin is dismal unless West Texas Intermediate crude oil prices stabilize at $70 per barrel or higher.
- The effect of the new tax law on our company is unclear. We are a pass-through business but cannot tell yet if the new rules and limitations will make any significant difference.
Oil and Gas Support Services Firms
- We are running at full capacity and may be hiring more support help.
- Since we are an LLC and not a corporation, the corporate tax cut did not apply, but the tax law has increased cash flow for our E&P customers, which allows them to drill and complete more wells.
- Even with the ever-so-modest recovery in the seismic space, I doubt we will see significant hiring in this part of the industry. We will ask our current teams to perform more functions as opposed to adding staff until the staff additions are absolutely necessary.
First Quarter | March 28, 2018
Historical data are available from first quarter 2016 to the most current release quarter.
Business Indicators: Quarter/Quarter
| Business Indicators: All Firms Current Quarter (versus previous quarter) |
|||||
| Indicator | Current Index | Previous Index | % Reporting Increase |
% Reporting No Change |
% Reporting Decrease |
|
Level of Business Activity |
40.7 |
38.1 |
48.6 |
43.6 |
7.9 |
|
Capital Expenditures |
36.5 |
40.3 |
47.9 |
40.7 |
11.4 |
|
Supplier Delivery Time |
16.3 |
8.6 |
20.0 |
76.3 |
3.7 |
|
Employment |
21.4 |
14.2 |
25.7 |
70.0 |
4.3 |
|
Employee Hours |
28.1 |
27.1 |
33.1 |
61.9 |
5.0 |
|
Wages and Benefits |
33.8 |
25.5 |
38.8 |
56.1 |
5.0 |
| Indicator | Current Index | Previous Index | % Reporting Improved |
% Reporting No Change |
% Reporting Worsened |
|
Company Outlook |
43.2 |
52.0 |
50.7 |
41.8 |
7.5 |
| Indicator | Current Index | Previous Index | % Reporting Increase |
% Reporting No Change |
% Reporting Decrease |
|
Uncertainty |
0.7 |
–5.3 |
20.3 |
60.1 |
19.6 |
| Business Indicators: E&P Firms Current Quarter (versus previous quarter) |
|||||
| Indicator | Current Index | Previous Index | % Reporting Increase |
% Reporting No Change |
% Reporting Decrease |
|
Level of Business Activity |
34.6 |
36.4 |
42.3 |
50.0 |
7.7 |
|
Oil Production |
34.3 |
33.7 |
46.1 |
42.1 |
11.8 |
|
Natural Gas Wellhead Production |
25.0 |
26.6 |
39.5 |
46.1 |
14.5 |
|
Capital Expenditures |
28.2 |
44.1 |
43.6 |
41.0 |
15.4 |
|
Expected Level of Capital Expenditures Next Year |
34.6 |
44.7 |
44.9 |
44.9 |
10.3 |
|
Supplier Delivery Time |
19.1 |
2.7 |
20.5 |
78.1 |
1.4 |
|
Employment |
9.0 |
0.0 |
15.4 |
78.2 |
6.4 |
|
Employee Hours |
16.9 |
20.8 |
20.8 |
75.3 |
3.9 |
|
Wages and Benefits |
28.6 |
27.3 |
33.8 |
61.0 |
5.2 |
|
Finding and Development Costs |
20.8 |
22.4 |
29.9 |
61.0 |
9.1 |
|
Lease Operating Expenses |
30.2 |
25.7 |
36.8 |
56.6 |
6.6 |
| Indicator | Current Index | Previous Index | % Reporting Improved |
% Reporting No Change |
% Reporting Worsened |
|
Company Outlook |
40.3 |
48.6 |
49.4 |
41.6 |
9.1 |
| Indicator | Current Index | Previous Index | % Reporting Increase |
% Reporting No Change |
% Reporting Decrease |
|
Uncertainty |
–1.4 |
1.4 |
19.7 |
59.2 |
21.1 |
| Business Indicators: O&G Support Services Firms Current Quarter (versus previous quarter) |
|||||
| Indicator | Current Index | Previous Index | % Reporting Increase |
% Reporting No Change |
% Reporting Decrease |
|
Level of Business Activity |
48.4 |
40.3 |
56.5 |
35.5 |
8.1 |
|
Utilization of Equipment |
40.4 |
29.6 |
45.2 |
50.0 |
4.8 |
|
Capital Expenditures |
46.7 |
35.1 |
53.2 |
40.3 |
6.5 |
|
Supplier Delivery Time |
12.9 |
16.4 |
19.4 |
74.2 |
6.5 |
|
Lag Time in Delivery of Firm's Services |
13.3 |
11.1 |
20.0 |
73.3 |
6.7 |
|
Employment |
37.1 |
33.4 |
38.7 |
59.7 |
1.6 |
|
Employee Hours |
41.9 |
35.8 |
48.4 |
45.2 |
6.5 |
|
Wages and Benefits |
40.4 |
23.3 |
45.2 |
50.0 |
4.8 |
|
Input Costs |
46.8 |
30.9 |
46.8 |
53.2 |
0.0 |
|
Prices Received for Services |
27.9 |
22.6 |
32.8 |
62.3 |
4.9 |
| Indicator | Current Index | Previous Index | % Reporting Improved |
% Reporting No Change |
% Reporting Worsened |
|
Company Outlook |
47.3 |
56.3 |
52.6 |
42.1 |
5.3 |
| Indicator | Current Index | Previous Index | % Reporting Increase |
% Reporting No Change |
% Reporting Decrease |
|
Uncertainty |
3.3 |
–14.3 |
21.0 |
61.3 |
17.7 |
Business Indicators: Year/Year
| Business Indicators: All Firms Current Quarter (versus same quarter a year ago) |
|||||
| Indicator | Current Index | Previous Index | % Reporting Increase |
% Reporting No Change |
% Reporting Decrease |
|
Level of Business Activity |
52.3 |
54.0 |
64.8 |
22.7 |
12.5 |
|
Capital Expenditures |
45.7 |
54.0 |
59.1 |
27.6 |
13.4 |
|
Supplier Delivery Time |
21.2 |
19.0 |
28.5 |
64.2 |
7.3 |
|
Employment |
25.8 |
21.3 |
35.2 |
55.5 |
9.4 |
|
Employee Hours |
33.4 |
33.0 |
40.5 |
52.4 |
7.1 |
|
Wages and Benefits |
46.5 |
40.6 |
52.0 |
42.5 |
5.5 |
| Indicator | Current Index | Previous Index | % Reporting Improved |
% Reporting No Change |
% Reporting Worsened |
|
Company Outlook |
65.3 |
65.8 |
76.9 |
11.6 |
11.6 |
| Business Indicators: E&P Firms Current Quarter (versus same quarter a year ago) |
|||||
| Indicator | Current Index | Previous Index | % Reporting Increase |
% Reporting No Change |
% Reporting Decrease |
|
Level of Business Activity |
51.5 |
48.5 |
62.9 |
25.7 |
11.4 |
|
Oil Production |
44.2 |
38.6 |
61.8 |
20.6 |
17.6 |
|
Natural Gas Wellhead Production |
38.2 |
30.5 |
52.9 |
32.4 |
14.7 |
|
Capital Expenditures |
42.0 |
55.7 |
59.4 |
23.2 |
17.4 |
|
Expected Level of Capital Expenditures Next Year |
50.0 |
40.6 |
58.6 |
32.9 |
8.6 |
|
Supplier Delivery Time |
24.6 |
12.5 |
29.2 |
66.2 |
4.6 |
|
Employment |
11.5 |
3.0 |
22.9 |
65.7 |
11.4 |
|
Employee Hours |
18.9 |
22.9 |
26.1 |
66.7 |
7.2 |
|
Wages and Benefits |
44.9 |
36.3 |
50.7 |
43.5 |
5.8 |
|
Finding and Development Costs |
36.8 |
30.5 |
45.6 |
45.6 |
8.8 |
|
Lease Operating Expenses |
38.8 |
30.8 |
44.8 |
49.3 |
6.0 |
| Indicator | Current Index | Previous Index | % Reporting Improved |
% Reporting No Change |
% Reporting Worsened |
|
Company Outlook |
62.3 |
64.2 |
73.9 |
14.5 |
11.6 |
| Business Indicators: O&G Support Services Firms Current Quarter (versus same quarter a year ago) |
|||||
| Indicator | Current Index | Previous Index | % Reporting Increase |
% Reporting No Change |
% Reporting Decrease |
|
Level of Business Activity |
53.4 |
61.1 |
67.2 |
19.0 |
13.8 |
|
Utilization of Equipment |
50.9 |
55.8 |
61.4 |
28.1 |
10.5 |
|
Capital Expenditures |
50.0 |
51.9 |
58.6 |
32.8 |
8.6 |
|
Supplier Delivery Time |
17.3 |
26.9 |
27.6 |
62.1 |
10.3 |
|
Lag Time in Delivery of Firm's Services |
15.8 |
16.0 |
26.3 |
63.2 |
10.5 |
|
Employment |
43.1 |
44.4 |
50.0 |
43.1 |
6.9 |
|
Employee Hours |
50.9 |
46.3 |
57.9 |
35.1 |
7.0 |
|
Wages and Benefits |
48.2 |
46.3 |
53.4 |
41.4 |
5.2 |
|
Input Costs |
52.6 |
46.1 |
56.1 |
40.4 |
3.5 |
|
Prices Received for Services |
35.7 |
44.0 |
46.4 |
42.9 |
10.7 |
| Indicator | Current Index | Previous Index | % Reporting Improved |
% Reporting No Change |
% Reporting Worsened |
|
Company Outlook |
69.3 |
68.0 |
80.8 |
7.7 |
11.5 |
First Quarter | March 28, 2018
Activity Chart
First Quarter | March 28, 2018
Comments from Survey Respondents
These comments are from respondents’ completed surveys and have been edited for publication. Comments from the Special Questions survey can be found below the special questions.
Exploration and Production Firms
- Uncertainty in steel tariff provisions is leading to uncertainty in the cost outlook. Longer term, the tariff could impact many facets of the exploration and production (E&P) industry and could cause additional inflationary pressures while it is in place.
- I feel that oil prices have a floor at $55 per barrel, which I did not sense six months ago. Also, I believe that there is a growing sense that the world cannot sustain nearly 100 million barrels per day of oil production with oil prices below $60 per barrel, regardless of the temporary oversupply.
- The labor shortage in West Texas is only getting worse. It’s not only affecting hiring, but also the availability of contract or third-party labor.
- We are a private equity (PE)-backed company. Due to the lack of merger-and-acquisition activity in the public market, we, like many of the PE-backed companies, are seeing our sponsors curtail their capital commitments despite great well performance and economics. The few deals that are getting done are generally between PE firms, which is a new paradigm and, due to the incentive waterfall structure, one which is further exacerbating the bid–ask spread.
- We continue to ramp up production at our company as we build out our operations. We have seen increased oilfield service costs and timing delays in the Permian. We expect a significant amount of production to come online in 2018, which will put downward pressure on West Texas Intermediate (WTI) crude oil prices. Our third-party hedging consultant has commented that their Permian operators are all expecting large production ramp-ups in 2018 and/or 2019, which is a cause for concern about takeaway capacity and oil prices.
- The availability of service providers for conventional drilling is more limited than a year ago, which is creating some modest delays in our operations.
- The significant swings in the price of oil have had a definite impact on our plans for the future and ability to forecast overall revenue.
- Increased activity in the Permian Basin, especially horizontal wells, has led to much higher prices for services firms and the unavailability of services at any price. Small, old-line oil companies are experiencing severe problems.
- We are taking advantage of large company reassessments and buying production in areas where companies are divesting to focus on higher-profit areas they own.
- I am still not certain as to what impact the new tax laws are going to have on the energy industry.
- Constrained natural gas takeaway capacity in the Permian Basin is currently affecting the Waha Hub price.
- There are no production output constraints other than limitations on transportation infrastructure. Potential oversupply gives us concern about the strength of crude prices going forward.
- The price for crude oil seems to be weakening.
- The burdensome fee schedules in Louisiana and legacy-lawsuit climate continue to make it difficult to do business in the state.
Oil and Gas Support Services Firms
- My crystal ball has a crack in it. I never expected the Russians and OPEC, particularly Saudi Arabia, to abide by their agreement to curtail production. A recent article in the Wall Street Journal showed that Saudi Arabia needs around $70 per barrel to fund its national budget; however, the article did not say how many barrels it needs to sell at this price. So that is probably Saudi Arabia’s motive in supporting the price of crude worldwide. I still think that OPEC will tire of enabling the U.S. oil industry to drill expensive horizontal wells in shale formations and that we will resume selling more barrels at lower prices, driving down the domestic price and curtailing drilling activity.
- E&P companies are still holding service prices down at every turn. On the flip side, our costs of goods, fuel and wages are climbing every day. It is time for some small rate increases to ensure a profit and sustainability.
- It is getting crazy in the field. Service companies are overworked, and delivery of equipment services is more uncertain as utilization outstrips availability.
- The recent uncertainty regarding steel tariffs has the potential to create a major immediate shortfall in upstream drill pipe and to add significantly to costs, which would negatively impact the internal rate of return on many plays. This uncertainty is self-inflicted and unhelpful to our energy business.
- The U.S. onshore business has been improving quarter to quarter, and we expect the rest of 2018 to be the same. We have been hiring at a brisk pace, and the only thing restricting our growth is the availability of labor, especially in the Permian Basin.
- Wages are growing more quickly than revenue, compounding the effects of decreasing working capital as accounts receivable are increasing. This causes liquidity to become the biggest problem.
- Water management is becoming the No. 1 issue in the Permian.
- It is difficult to hire enough technicians at our company.
- Customer (E&P firms’) appetites for information and data in general are improving, and with that, companies again seem to be utilizing seismic data in their drilling and exploration plans and decisions.
- Permian operations have leveled off at full capacity; however, my business has seen no expansion. East Texas has come back to the table, and for the first time in two years, we have operations in Shelby and San Augustine counties. However, it is still a gas play, and only the owners of pipelines are ramping up. Others are trying to buy mineral interests from individuals.
- In the downhole tool market segment, quote activity has been increasing steadily over the past two quarters. However, we have not yet seen an increase in the percentage of those inquiries converted into firm orders.
Questions regarding the Dallas Fed Energy Survey can be addressed to Michael Plante at Michael.Plante@dal.frb.org or Kunal Patel at Kunal.Patel@dal.frb.org.
Sign up for our email alert to be automatically notified as soon as the latest Dallas Fed Energy Survey is released on the web.