Dallas Fed Energy Survey

Second Quarter | June 27, 2018
Oil and Gas Expansion Hits Its Stride
What's New This Quarter
Special questions this quarter focus on labor market issues in the oil and gas sector and constraints impacting activity in the Permian Basin and other areas.
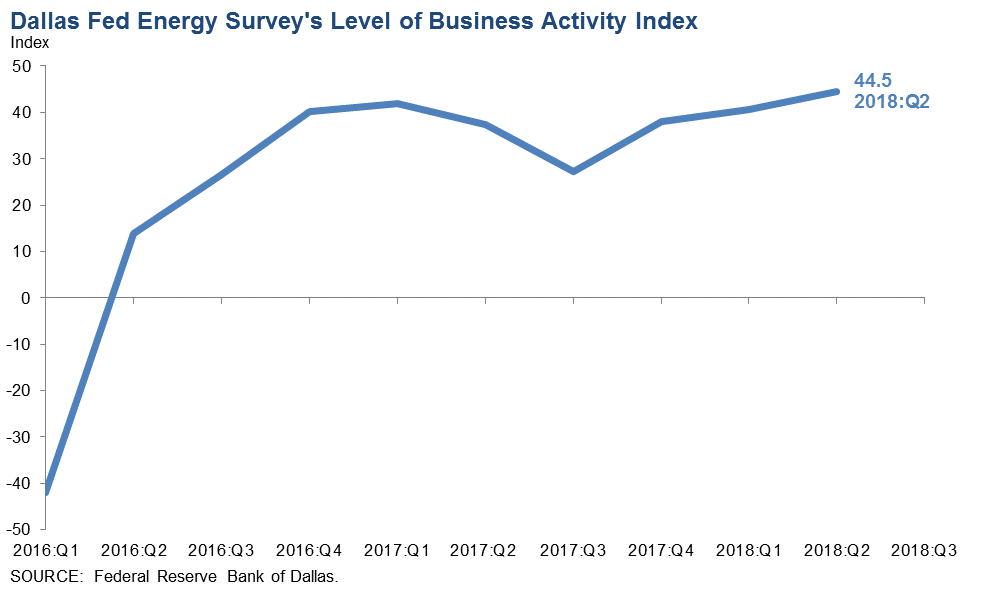
Energy sector activity expanded strongly in second quarter 2018, according to oil and gas executives responding to the Dallas Fed Energy Survey. The business activity index—the survey’s broadest measure of conditions facing Eleventh District energy firms—rose from 40.7 in the first quarter to 44.5 in the second—the highest level since the survey began in 2016. The increase was driven by both exploration and production (E&P) and oilfield services firms.
Positive readings in the survey generally indicate expansion, while readings below zero generally indicate contraction. Almost all indexes in the latest survey reflected expansion on a quarterly basis.
Oil and gas production increased for the seventh quarter in a row, according to executives at E&P firms. The oil production index advanced from 34.3 in the first quarter to 39.0 in the second. Furthermore, the natural gas production index moved up from 25.0 to 33.4. Both indexes are at their highest levels since the survey began and suggest that oil and gas production rose at an accelerated rate relative to last quarter.
Utilization of oilfield services firms’ equipment increased at a slightly faster pace than in the first quarter, with the corresponding index at 42.1, up two points. Input costs continued rising but at a slower pace than last quarter as the index of input costs fell from 46.8 to 36.3. The index of prices received for oilfield services ticked down from 27.9 to 23.2, suggesting prices are increasing but at a slightly slower pace.
Labor market indexes point to more rapid growth in employment and notably longer work hours in the second quarter, particularly in oilfield services firms. The employment index was 44.1 for services firms and 11.6 for E&P firms—the highest levels for both indexes since the survey began. The hours worked indexes were at or near all-time highs: 50.8 for services firms and 18.2 for E&P firms. The aggregate wages and benefits index remained positive but dipped from 33.8 to 27.9.
The company outlook index posted a ninth consecutive positive reading and increased two points to 45.3 in the second quarter. The index measuring uncertainty regarding firms’ outlooks remained in close proximity to zero, suggesting that uncertainty regarding firms’ outlooks was mostly unchanged this quarter.
On average, respondents expect West Texas Intermediate (WTI) oil prices to be $65.68 per barrel by year-end 2018, with responses ranging from $50 to $92 per barrel. Respondents expect Henry Hub natural gas prices to end 2018 at $2.91 per million British thermal units (MMBtu). For reference, WTI spot prices averaged $65.88 per barrel and Henry Hub spot prices averaged $2.96 per MMBtu during the survey collection period.
Next release: October 1, 2018
|
Data were collected June 13–21, and 137 energy firms responded to the survey. Of the respondents, 78 were exploration and production firms and 59 were oilfield services firms. The Dallas Fed conducts the Dallas Fed Energy Survey quarterly to obtain a timely assessment of energy activity among oil and gas firms located or headquartered in the Eleventh District. Firms are asked whether business activity, employment, capital expenditures and other indicators increased, decreased or remained unchanged compared with the prior quarter and with the same quarter a year ago. Survey responses are used to calculate an index for each indicator. Each index is calculated by subtracting the percentage of respondents reporting a decrease from the percentage reporting an increase. When the share of firms reporting an increase exceeds the share reporting a decrease, the index will be greater than zero, suggesting the indicator has increased over the previous quarter. If the share of firms reporting a decrease exceeds the share reporting an increase, the index will be below zero, suggesting the indicator has decreased over the previous quarter. |
Second Quarter | June 27, 2018
Price Forecasts
West Texas Intermediate Crude
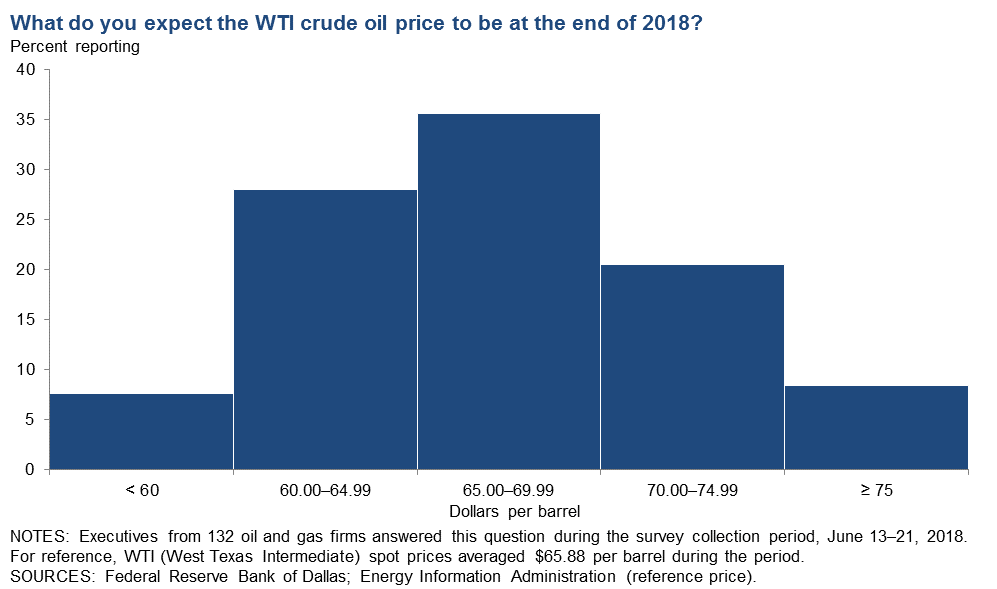
| West Texas Intermediate crude oil price (dollars per barrel), year-end 2018 | ||||
| Indicator | Survey Average | Low Forecast | High Forecast | Price During Survey |
Current quarter | $65.68 | $50.00 | $92.00 | $65.88 |
Prior quarter | $63.07 | $45.00 | $77.00 | $62.72 |
Henry Hub Natural Gas
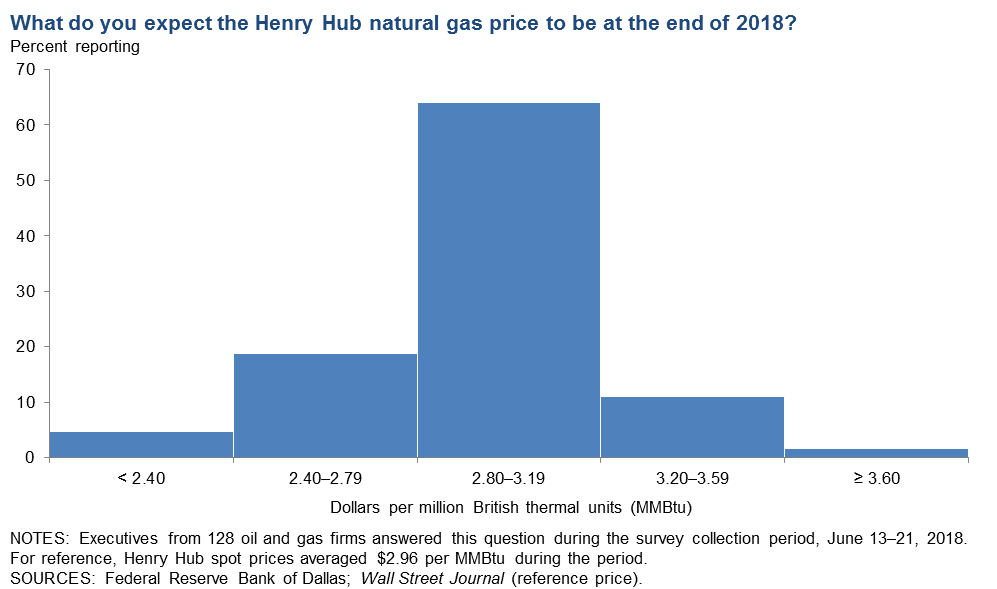
| Henry Hub natural gas price (dollars per MMBtu), year-end 2018 | ||||
| Indicator | Survey Average | Low Forecast | High Forecast | Price During Survey |
Current quarter | $2.91 | $2.00 | $4.00 | $2.96 |
Prior quarter | $2.91 | $1.30 | $4.00 | $2.65 |
| NOTE: Price during survey is an average of daily spot prices during the survey collection period. SOURCES: Energy Information Administration; Wall Street Journal. |
Second Quarter | June 27, 2018
Special Questions
Data were collected June 13–21, and 135 oil and gas firms responded to the special questions survey.
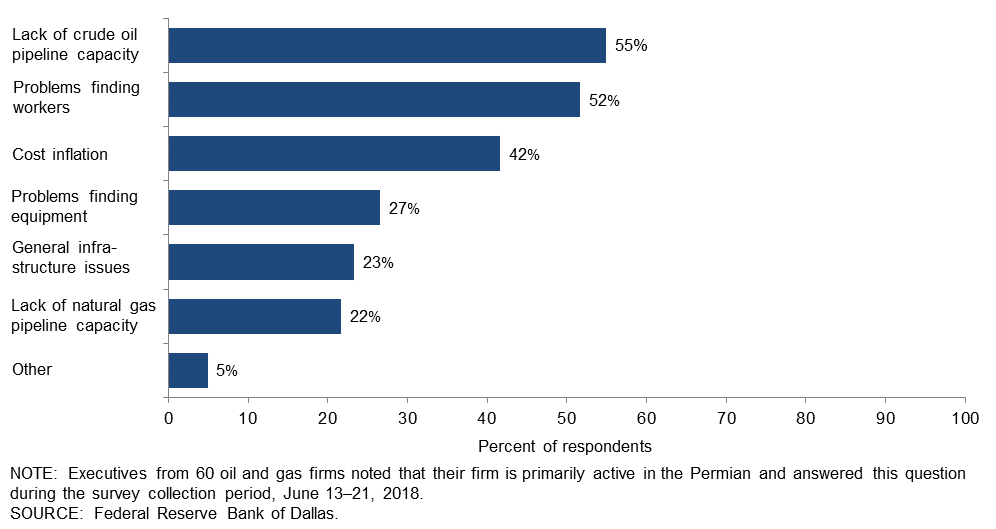
Which of the following, if any, do you expect to limit near-term growth in activity in the Permian? Please check all that apply.
Executives were first asked to identify the top area in which their firm is active. Of the 60 executives who noted that their firm is primarily active in the Permian Basin, the most prevalent response was lack of crude oil pipeline capacity (55 percent of respondents), followed by problems finding workers (52 percent of respondents).
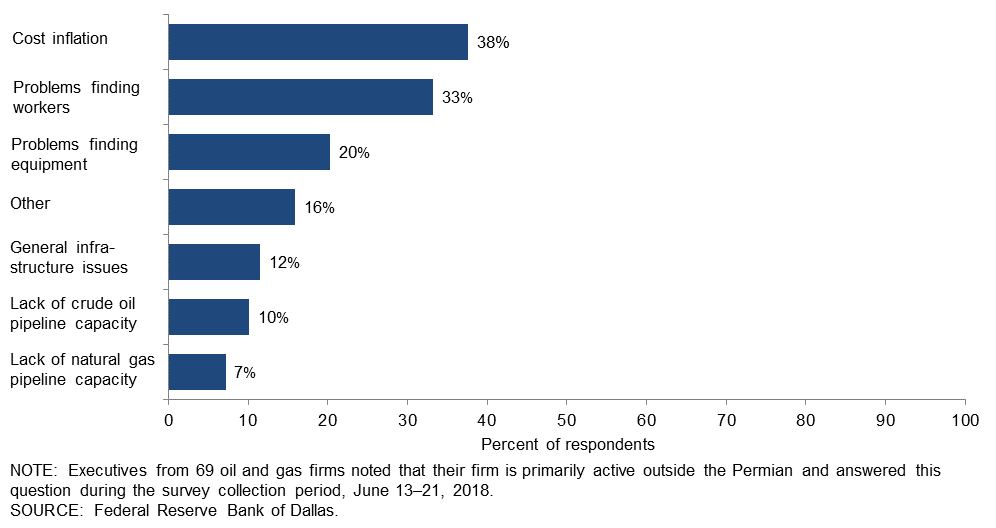
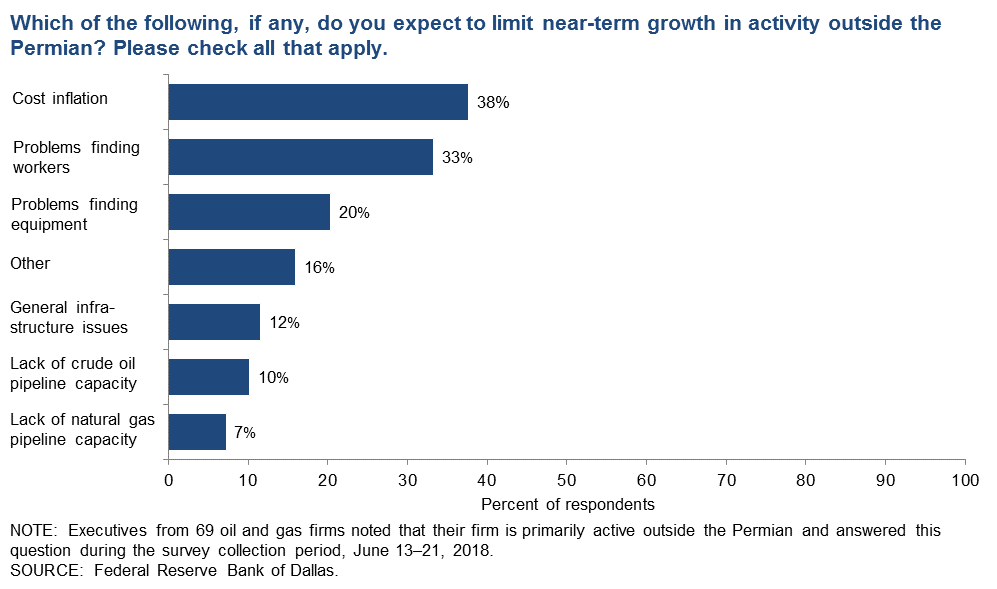
Which of the following, if any, do you expect to limit near-term growth in activity outside the Permian? Please check all that apply.
Of the 69 executives who noted that their firm is primarily active in a region outside the Permian, the most frequently identified constraint was cost inflation (38 percent of respondents), followed by problems finding workers (33 percent of respondents).
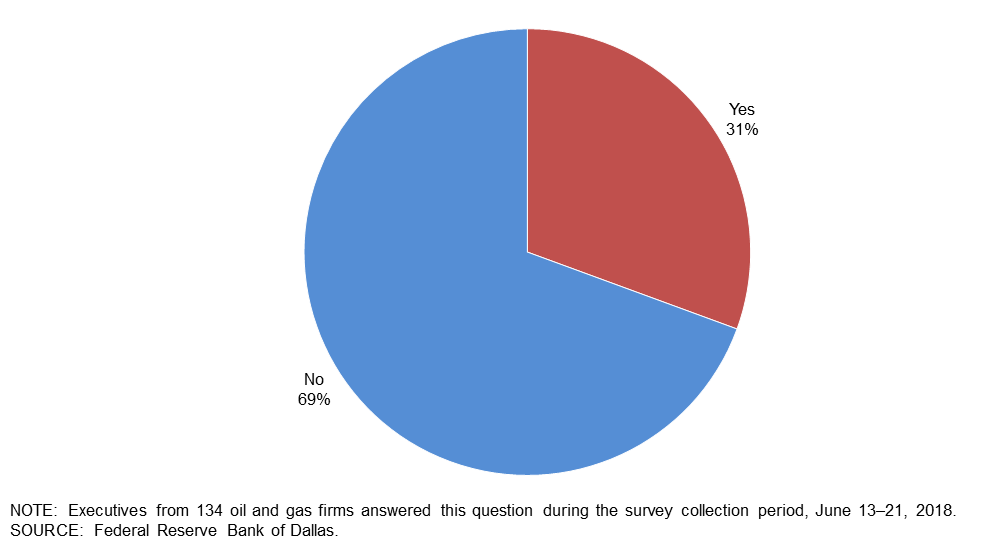
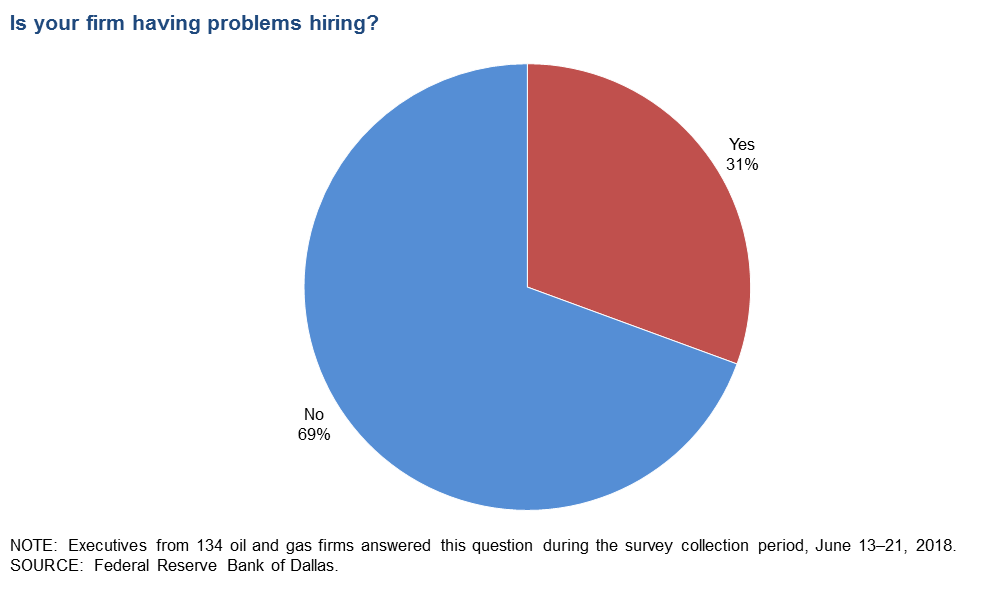
Is your firm having problems hiring?
This question was posed to all executives, regardless of the region in which their firm is active. Thirty-one percent of executives noted that their firm was having problems hiring, while 69 percent of executives noted that their firm was not having problems hiring. Forty-seven percent of support services firms responded that they were having problems hiring, while only 18 percent of exploration and production firms noted problems hiring. (See table for more detail.)
| Percent Reporting | All Firms | E&P | Services |
| Yes | 31 | 18 | 47 |
| No | 69 | 82 | 53 |
| NOTES: Executives from 77 exploration and production firms and 57 oil and gas support services firms answered this question during the survey collection period, June 13–21, 2018. The “All Firms” column reports the percentage out of the total 134 responses. SOURCE: Federal Reserve Bank of Dallas. | |||
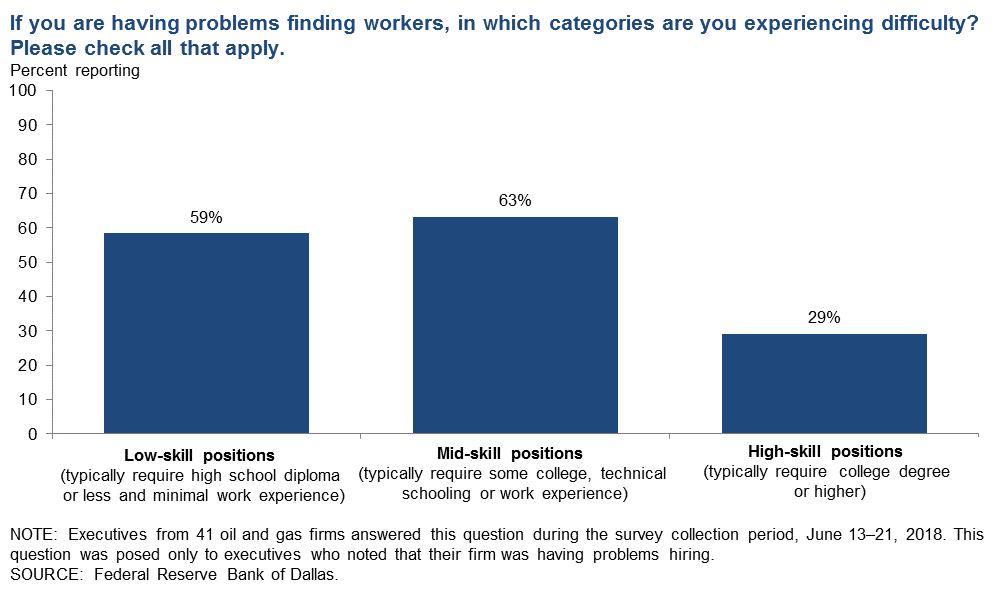
If you are having problems finding workers, in which categories are you experiencing difficulty? Please check all that apply.*
Of the 41 executives who noted that their firm was having problems hiring, 59 percent checked low-skill positions, 63 percent checked mid-skill positions and 29 percent checked high-skill positions as the categories in which they were experiencing difficulty hiring. The percentages were similar across E&P and support services firms for low- and mid-skill jobs, but there was slightly higher demand (43 percent) for high-skill jobs from E&P firms.
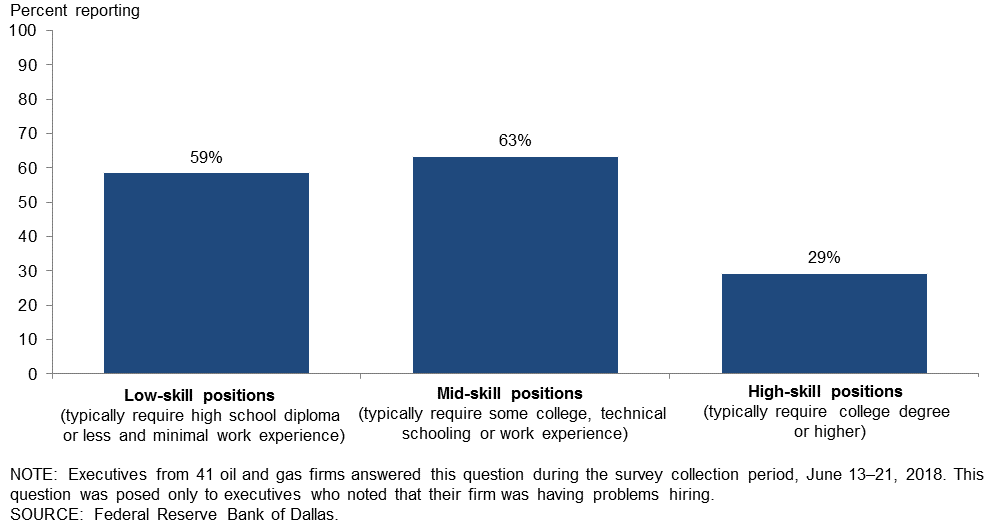
*This question was posed only to executives who noted that their firm was having problems hiring.
If you are having problems finding workers, what are the main reasons why? Please check all that apply.*
Of the 41 executives who responded that their firm was having problems hiring, 83 percent noted a lack of available applicants as a problem, followed by 49 percent who noted lack of experience.
| Type of hiring problem | Percent reporting |
| Lack of available applicants/no applicants | 83 |
| Lack of experience | 49 |
| Lack of technical competencies (hard skills) | 46 |
| Looking for more pay than is offered | 44 |
| Inability to pass background check | 32 |
| Lack of workplace competencies (soft skills) | 27 |
| Inability to pass drug test | 24 |
| Other | 2 |
| NOTES: Executives from 41 oil and gas firms answered this question during the survey collection period, June 13–21, 2018. This question was posed only to executives who noted that their firm was having problems hiring. SOURCE: Federal Reserve Bank of Dallas. | |