Dallas Fed Energy Survey

Fourth Quarter | December 27, 2019
Oil and Gas Activity, Employment Slip Lower
What’s New This Quarter
Special questions this quarter focus on capital spending in 2020, the price of oil needed to cover firms’ capital spending plans next year and the main causes of flaring in the Permian Basin.
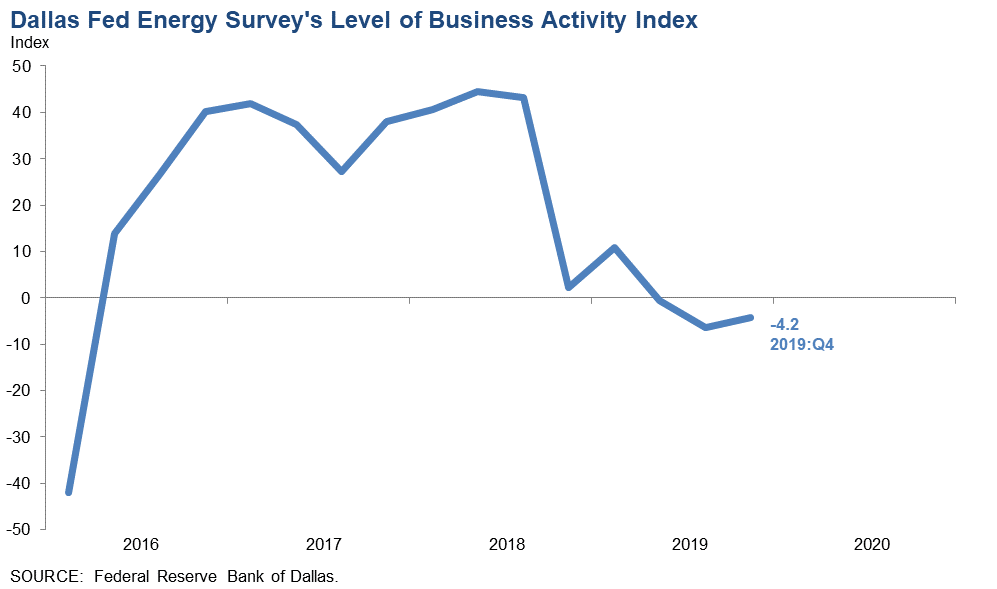
Activity in the oil and gas sector dipped again in fourth quarter 2019, according to oil and gas executives responding to the Dallas Fed Energy Survey. The business activity index—the survey’s broadest measure of conditions facing Eleventh District energy firms—remained in negative territory but eased from -7.4 in the third quarter to -4.2 in the fourth, suggesting that the pace of contraction has lessened. Activity for oilfield services firms continued to decline, with their business activity index at -22.1. Meanwhile, the business activity index for exploration and production (E&P) firms indicated modest growth, rising from zero to 5.4.
Oil and gas production increased for the 13th consecutive quarter, according to E&P executives. The oil production index increased from 15.7 in the third quarter to 24.7 in the fourth. The natural gas production index also advanced, from 6.5 to 15.6. Both indexes suggest that oil and gas production rose at a slightly faster pace relative to last quarter.
Most indexes pointed to worsening conditions among oilfield services firms. The equipment utilization index was largely unchanged at -25.8 in the fourth quarter. Upward pressure on input costs abated in the fourth quarter, with the index falling from 5.6 to 1.7. Meanwhile, the index of prices received for services slid further into negative territory, from -18.5 to -24.5. Given flat input prices and lower selling prices, the operating margins index plummeted from -24.0 to -39.7.
The aggregate employment index posted a third consecutive negative reading, dipping from -8.0 to -10.0. Also, the aggregate employee hours worked index fell from -2.4 to -7.7, signaling a further drop in employee hours. The index for aggregate wages and benefits edged up from 6.2 to 8.2.
The company outlook index for E&P firms increased from 7.6 to 15.4, while the company outlook index for oilfield services firms decreased from -14.8 to -22.4. This suggests modest improvement in outlooks for E&P firms and worsening outlooks for oilfield services firms. While uncertainty remains elevated, slightly fewer firms noted rising uncertainty this quarter than last, and the aggregate index fell by 12 points to 26.
On average, respondents expect a West Texas Intermediate (WTI) oil price of $58.54 per barrel by year-end 2020, with responses ranging from $48 to $75 per barrel. Survey participants expect Henry Hub natural gas prices to be $2.51 per million British thermal units (MMBtu) by year-end. For reference, WTI spot prices averaged $60.19 per barrel during the survey collection period, and Henry Hub spot prices averaged $2.28 per MMBtu.
Next release: March 25, 2020
|
Data were collected Dec. 11–19, and 170 energy firms responded. Of the respondents, 111 were exploration and production firms and 59 were oilfield services firms. The Dallas Fed conducts the Dallas Fed Energy Survey quarterly to obtain a timely assessment of energy activity among oil and gas firms located or headquartered in the Eleventh District. Firms are asked whether business activity, employment, capital expenditures and other indicators increased, decreased or remained unchanged compared with the prior quarter and with the same quarter a year ago. Survey responses are used to calculate an index for each indicator. Each index is calculated by subtracting the percentage of respondents reporting a decrease from the percentage reporting an increase. When the share of firms reporting an increase exceeds the share reporting a decrease, the index will be greater than zero, suggesting the indicator has increased over the previous quarter. If the share of firms reporting a decrease exceeds the share reporting an increase, the index will be below zero, suggesting the indicator has decreased over the previous quarter. |
Fourth Quarter | December 27, 2019
Price Forecasts
West Texas Intermediate Crude
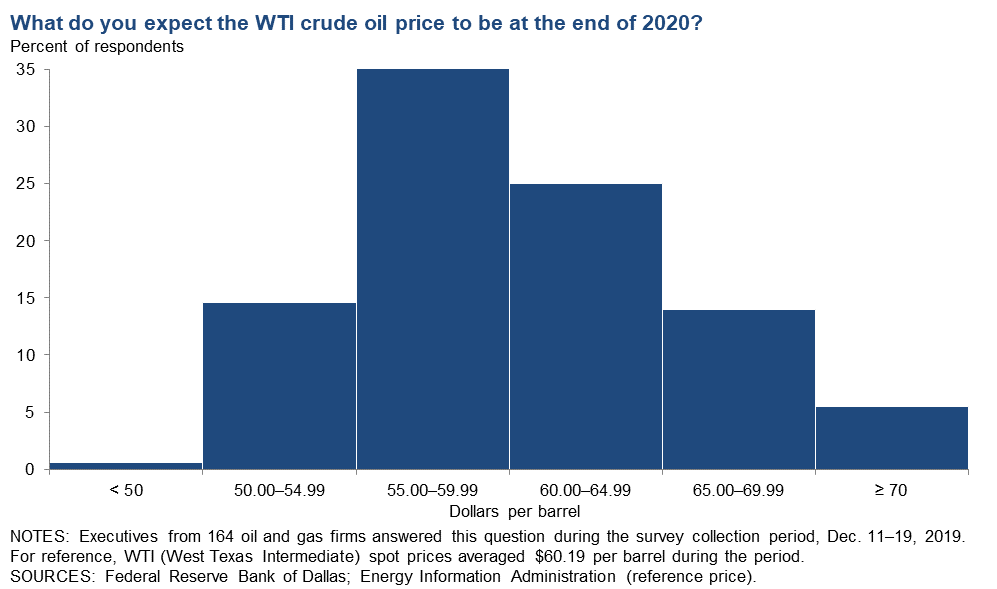
| West Texas Intermediate crude oil price (dollars per barrel), year-end 2020 | ||||
| Indicator | Survey Average | Low Forecast | High Forecast | Price During Survey |
Current quarter | $58.54 | $48.00 | $75.00 | $60.19 |
Prior quarter | N/A | N/A | N/A | N/A |
| NOTE: Price during survey is an average of daily spot prices during the survey collection period. SOURCES: Energy Information Administration; Federal Reserve Bank of Dallas. | ||||
Henry Hub Natural Gas
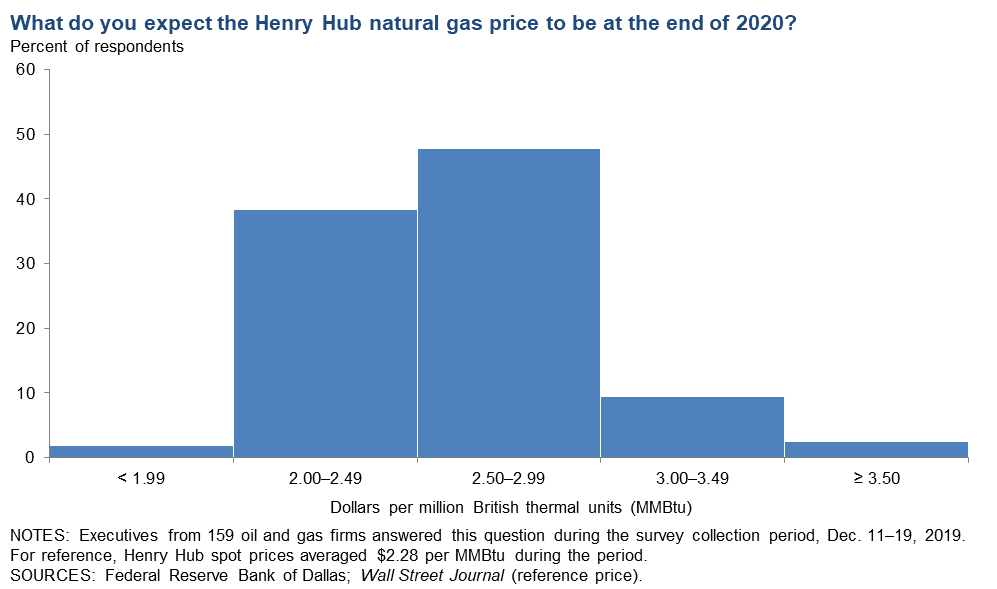
| Henry Hub natural gas price (dollars per MMBtu), year-end 2020 | ||||
| Indicator | Survey Average | Low Forecast | High Forecast | Price During Survey |
Current quarter | $2.51 | $1.35 | $4.00 | $2.28 |
Prior quarter | N/A | N/A | N/A | N/A |
| NOTE: Price during survey is an average of daily spot prices during the survey collection period. SOURCES: Energy Information Administration; Federal Reserve Bank of Dallas. | ||||
Fourth Quarter | December 27, 2019
Special Questions
Data were collected Dec. 11–19, and 165 oil and gas firms responded to the special questions survey.
All Firms
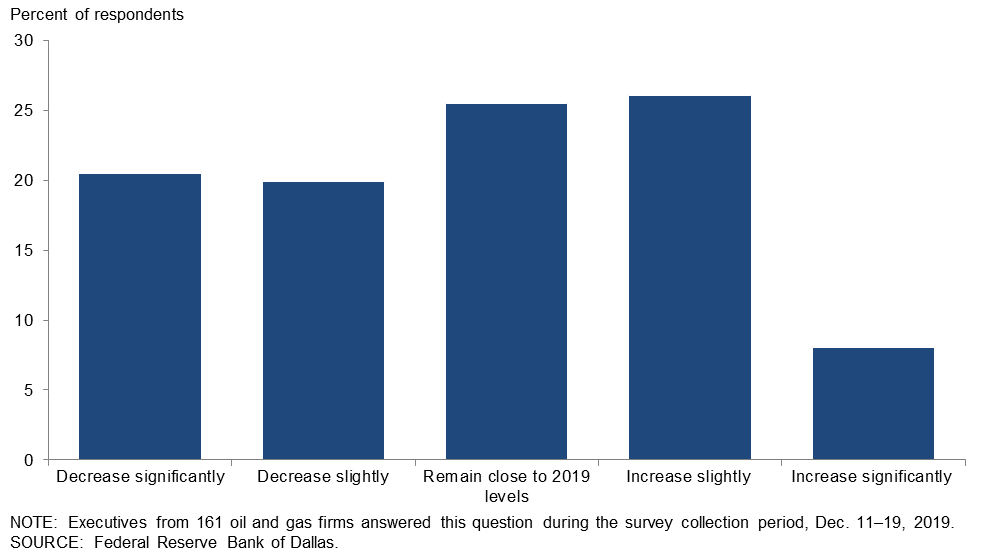
What are your expectations for your firm’s capital spending in 2020 versus 2019?
Forty-one percent of all firms expect to decrease capital spending either significantly or slightly next year. Only 8 percent expect to increase capital spending significantly, though 26 percent plan to increase it slightly. Twenty-five percent anticipate no change in 2020.
The breakdown in data reveals that a larger share of the respondents looking to cut are in oil and gas support services versus exploration and production (E&P). In terms of share, 49 percent of oil and gas support services firms are looking to decrease capital spending, compared with 36 percent of E&P firms. At the same time, 24 percent of support services firms expect to increase capital spending, while 40 percent of E&P firms are looking to increase it. Of the 40 percent of E&P firms, just 10 percent are looking to significantly boost spending. (See table for details.)
| Response | Percent Reporting | ||
| All | E&P | Services | |
| Increase significantly | 8 | 10 | 4 |
| Increase slightly | 26 | 30 | 20 |
| Remain close to 2019 levels | 25 | 24 | 29 |
| Decrease slightly | 20 | 20 | 20 |
| Decrease significantly | 21 | 16 | 29 |
| NOTE: Executives from 105 exploration and production firms and 56 oil and gas support services firms answered this question during the survey collection period, Dec. 11–19, 2019. The “All” column reports the percentage out of the total 161 responses. Percentages may not sum to 100 due to rounding. | |||
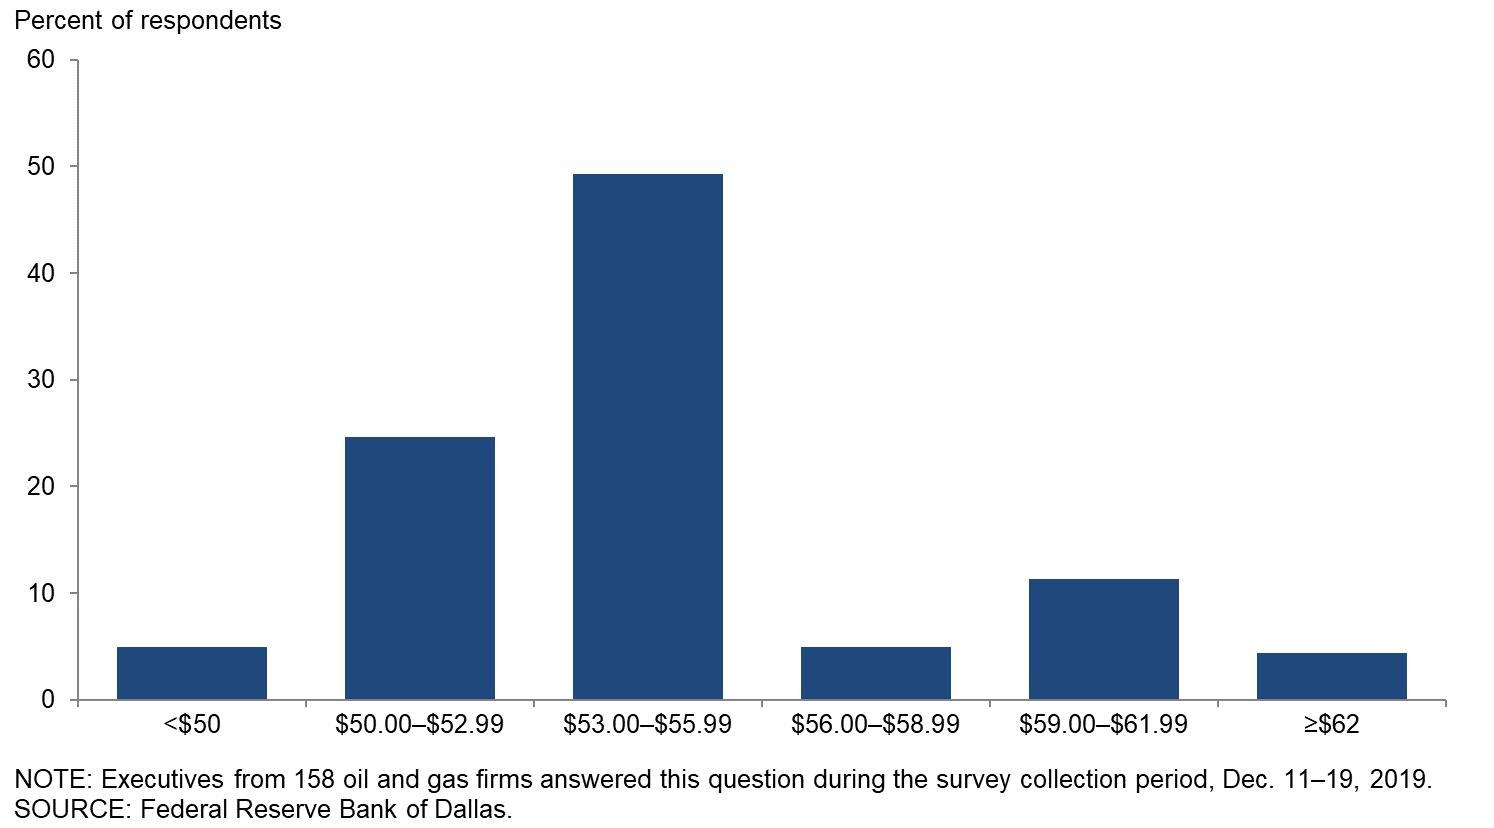
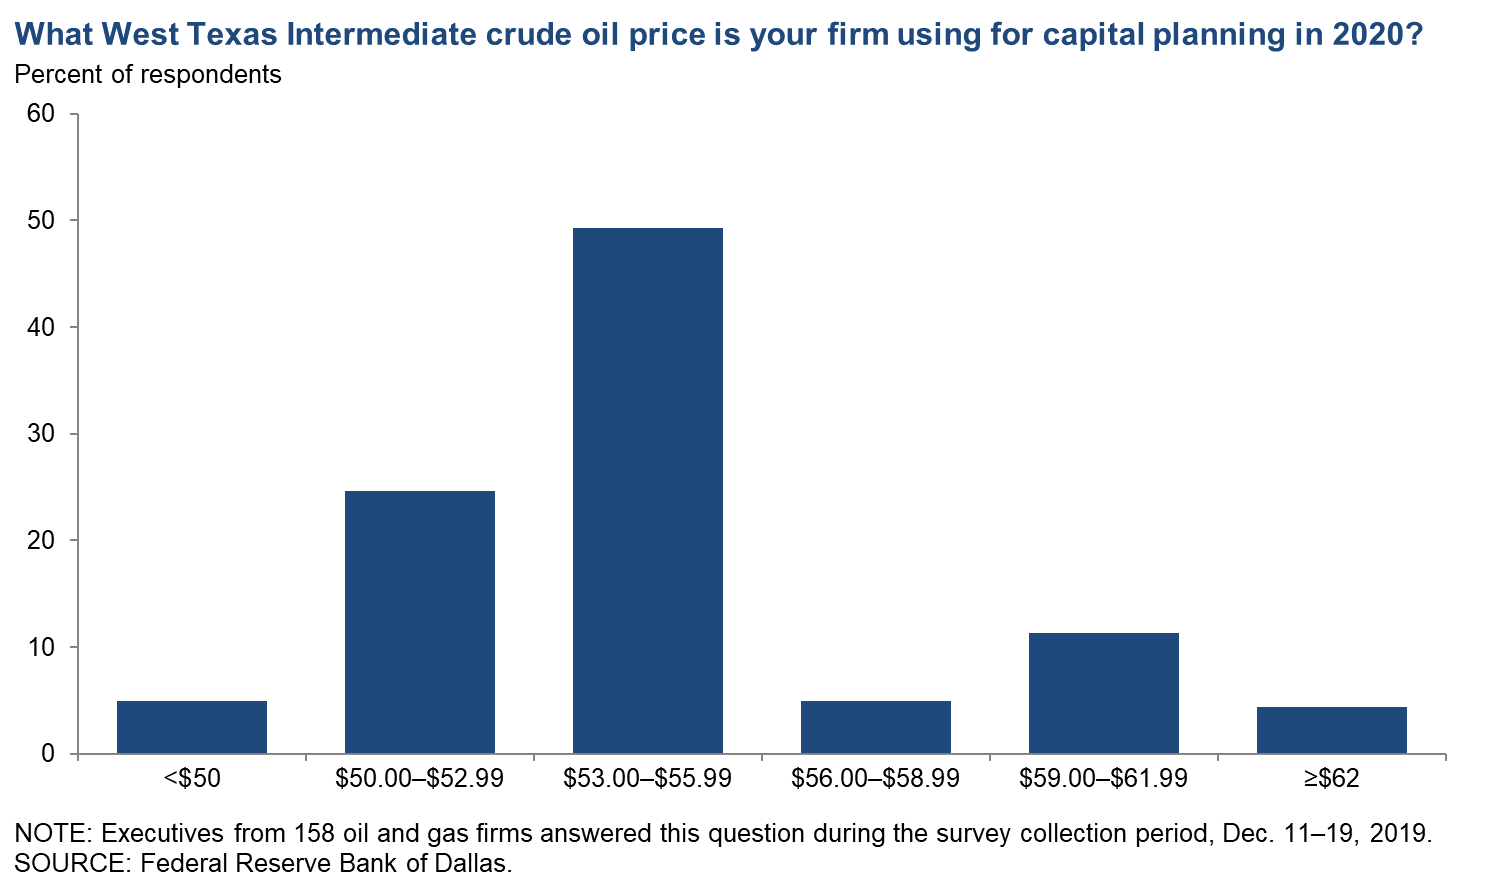
What West Texas Intermediate (WTI) crude oil price is your firm using for capital planning in 2020?
For this special question, executives were asked to provide a specific WTI crude oil price used for capital planning in 2020 at their firms. The average response was $54 per barrel, with the median and the mode both $55 per barrel. The average price used is the same as what was used for 2019 budgets (see results from last year’s special questions).
Exploration and Production (E&P) Firms
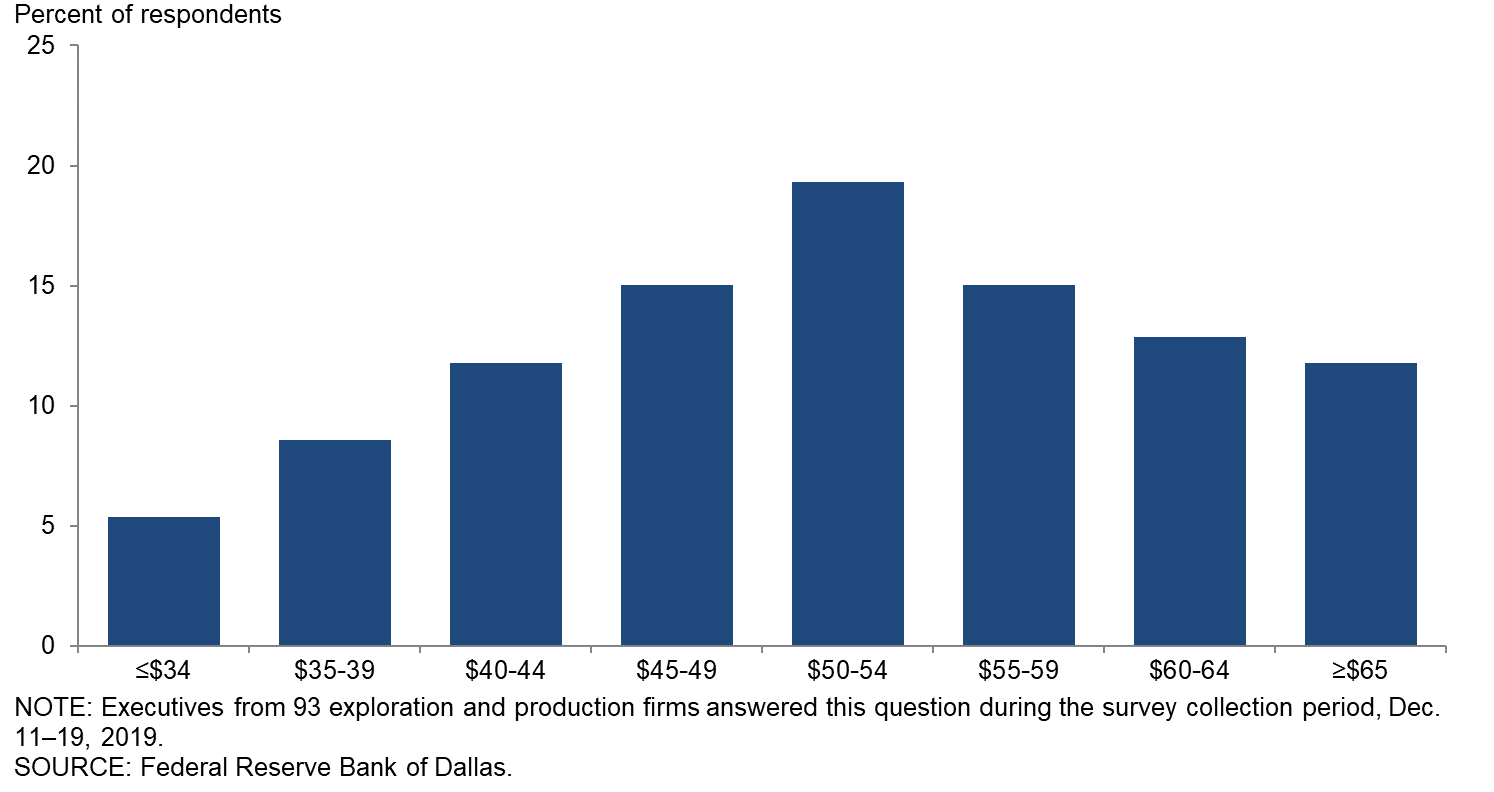
What West Texas Intermediate crude oil price does your firm need in 2020 for cash flow from operations to cover capital expenditures?
Nineteen percent of respondents said they could cover capital expenditures with cash flow from operations if the oil price were between $50 and $54 per barrel. Forty-one percent said their firms could cover with prices below $50 a barrel, while the remaining 40 percent need prices at or above $55.
All Firms
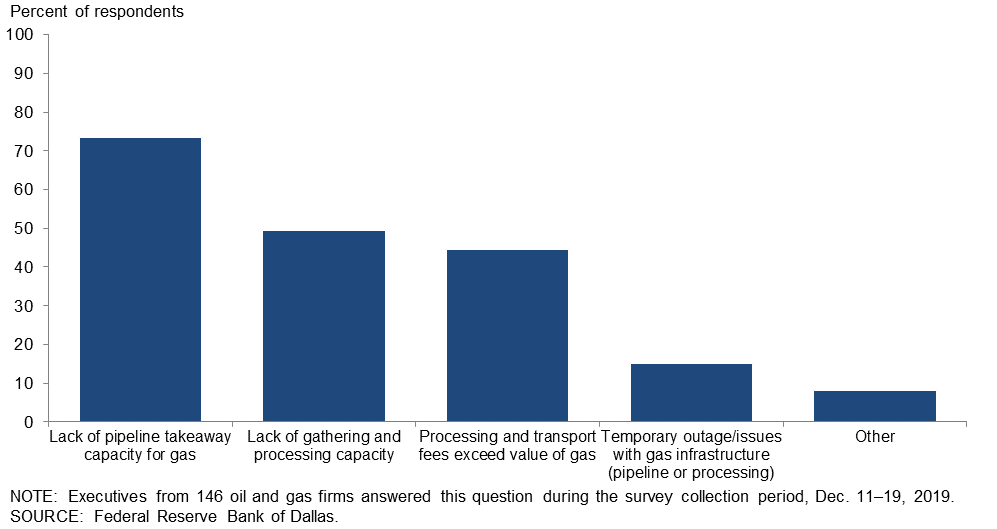
Multiple news sources have reported that flaring of natural gas increased in the Permian Basin in 2019. What do you believe are the main reasons for the increase? (Check all that apply.)
A lack of pipeline takeaway capacity for gas was the most frequently identified main reason for the increase in flaring in the Permian Basin in 2019, with 73 percent of respondents selecting this option. A lack of gathering and processing capacity was cited by nearly half (49 percent) of executives, while processing and transportation fees exceeding the value of the gas were indicated by 45 percent of respondents. The least-cited reason for increased flaring (15 percent) was temporary outages/issues with gas infrastructure. Respondents were able to select more than one choice for this special question.
Special Questions Comments
Exploration and Production Firms
- Yes, a lot of natural gas is being vented/flared, but the percentage of gas vented or flared versus total amount of gas being produced is minuscule. Gas flares are easy to spot in a flat region. The real story is how little is being flared when compared to total gas production. No one wants to flare gas; that is like burning money! It is only flared or vented out of necessity or accommodation to ephemeral situations.
- As a small, independent producer, I would like to see the Texas Railroad Commission do its job and prevent waste of resources. Flaring should be allowed only for a short time to test and clean wells up after they have been hydraulically fracked. Once this has occurred, if the operator cannot find gathering/pipeline options for its natural gas production, the well should be shut-in until takeaway capacity is available. This would not only prevent waste, but would also slow the pace of drilling, decrease field production and drive natural gas prices up to a reasonable level. Low-production wells are going to be prematurely plugged, with the resource lost, if natural gas prices do not improve soon. With industry support, this would also be seen as a good-faith effort to reduce air pollution from this waste of resources.
- As it relates to the Midland Basin, the recent increase in flaring has little to do with well connects (as others have speculated) and much to do with downstream congestion and recent onetime events at two large midstream facilities in the basin. Both of these issues are in the final phases of resolution and will result in a substantial reduction of operator flaring on already connected wells in the Midland Basin. An overreaction to an ill-informed misstated “problem” would be detrimental to future investments and not actually address the root cause of the recent flaring. The root cause was onetime events (fires) which inhibited gatherers and processors from taking the already connected natural gas. This pushed the management of gas volumes back to operators, requiring them to flare the gas to manage the safe operations of their wells. One should note there are multiple reasons for flaring—not just new well connections.
- Continued investor discipline is necessary to get oil and gas firms in shape to become cash-flow positive. Capital starvation (and the resulting decreases in capital expenditures) will show that shale production is not an immutable force. The Energy Information Administration and International Energy Agency estimates for U.S. shale growth in 2020 are too high and materially so.
- The solution to low oil prices is low oil prices. The natural gas situation is not going to end pretty.
- I really think we need to get back to the Interstate Oil and Gas Compact Commission pro-rationing of production. This would mean the setting of a monthly production [amount] allowable for each well, adjusted by a mandated market factor each month. The wastage of resources is horrible. The tax base of producing states is declining and being wasted. Venting and flaring of natural gas are ridiculous wastes of resources and a sign of imbalances.
- What people do not realize is that I have purchasers for my natural gas who shut their plants in for maintenance, which caused operators to flare the gas. Wells cannot be shut-in for a length of time as that will kill the well and it will not produce anymore. This is beyond my control, and we cannot be blamed for it. Go to the New Mexico Oil and Gas Association and Independent Petroleum Association of New Mexico websites for more info on what New Mexico oil and gas operators have been achieving these past years. We are proud of what we are achieving for New Mexico.
- The flaring of natural gas is wasteful and should not be allowed by the Texas Railroad Commission. Flaring is energizing environmentalists and encouraging investment funds to go “green,” which will further constrain oil and gas investments.
- The price of natural gas is going to stay low for some years due to associated gas coming online as infrastructures are built out.
- Operators will work only with rock-solid, financially stable oilfield services firms (OFS) who also have very good safety records. The OFS industry will also become more prudent around customer selection. The number of bankruptcies and the merger-and-acquisition activities among operators and service firms have increased. We expect this trend to continue in 2020.
- We are bullish on the price of crude oil. Our expectation is to drill two to three offset wells.
Oil and Gas Support Services Firms
- Our company outlook is for 2020 to be a continuation of the 2019 slowdown in North American onshore seismic spending; thus, our planning is for decreased investment and opportunity in 2020.
- Permian associated natural gas is a still-emerging story that will change the Western Hemisphere liquefied natural gas market once infrastructure can catch up with natural gas production.
Additional Comments »
Fourth Quarter | December 27, 2019
Historical data are available from first quarter 2016 to the most current release quarter.
Business Indicators: Quarter/Quarter
| Business Indicators: All Firms Current Quarter (versus previous quarter) | |||||
| Indicator | Current Index | Previous Index | % Reporting Increase | % Reporting No Change | % Reporting Decrease |
Level of Business Activity | –4.2 | –7.4 | 22.9 | 50.0 | 27.1 |
Capital Expenditures | –1.8 | –1.2 | 26.3 | 45.5 | 28.1 |
Supplier Delivery Time | –8.4 | –1.2 | 2.4 | 86.8 | 10.8 |
Employment | –10.0 | –8.0 | 14.1 | 61.8 | 24.1 |
Employee Hours | –7.7 | –2.4 | 13.6 | 65.1 | 21.3 |
Wages and Benefits | 8.2 | 6.2 | 18.3 | 71.6 | 10.1 |
| Indicator | Current Index | Previous Index | % Reporting Improved | % Reporting No Change | % Reporting Worsened |
Company Outlook | 1.9 | 0.0 | 27.2 | 47.5 | 25.3 |
| Indicator | Current Index | Previous Index | % Reporting Increase | % Reporting No Change | % Reporting Decrease |
Uncertainty | 26.0 | 38.0 | 39.6 | 46.7 | 13.6 |
| Business Indicators: E&P Firms Current Quarter (versus previous quarter) | |||||
| Indicator | Current Index | Previous Index | % Reporting Increase | % Reporting No Change | % Reporting Decrease |
Level of Business Activity | 5.4 | 0.0 | 23.4 | 58.6 | 18.0 |
Oil Production | 24.7 | 15.7 | 44.0 | 36.7 | 19.3 |
Natural Gas Wellhead Production | 15.6 | 6.5 | 36.7 | 42.2 | 21.1 |
Capital Expenditures | 9.1 | 3.7 | 33.0 | 43.1 | 23.9 |
Expected Level of Capital Expenditures Next Year | 0.9 | –4.7 | 30.6 | 39.6 | 29.7 |
Supplier Delivery Time | –5.5 | 0.0 | 3.7 | 87.2 | 9.2 |
Employment | –6.3 | –5.6 | 16.2 | 61.3 | 22.5 |
Employee Hours | 1.8 | 3.7 | 12.7 | 76.4 | 10.9 |
Wages and Benefits | 11.8 | 9.3 | 21.8 | 68.2 | 10.0 |
Finding and Development Costs | –20.0 | –14.2 | 7.3 | 65.5 | 27.3 |
Lease Operating Expenses | –1.8 | 5.7 | 19.1 | 60.0 | 20.9 |
| Indicator | Current Index | Previous Index | % Reporting Improved | % Reporting No Change | % Reporting Worsened |
Company Outlook | 15.4 | 7.6 | 34.6 | 46.2 | 19.2 |
| Indicator | Current Index | Previous Index | % Reporting Increase | % Reporting No Change | % Reporting Decrease |
Uncertainty | 16.3 | 44.4 | 32.7 | 50.9 | 16.4 |
| Business Indicators: O&G Support Services Firms Current Quarter (versus previous quarter) | |||||
| Indicator | Current Index | Previous Index | % Reporting Increase | % Reporting No Change | % Reporting Decrease |
Level of Business Activity | –22.1 | –21.8 | 22.0 | 33.9 | 44.1 |
Utilization of Equipment | –25.8 | –24.0 | 19.0 | 36.2 | 44.8 |
Capital Expenditures | –22.4 | –10.9 | 13.8 | 50.0 | 36.2 |
Supplier Delivery Time | –13.8 | –3.7 | 0.0 | 86.2 | 13.8 |
Lag Time in Delivery of Firm's Services | –3.5 | –13.0 | 3.5 | 89.5 | 7.0 |
Employment | –16.9 | –12.7 | 10.2 | 62.7 | 27.1 |
Employment Hours | –25.4 | –14.5 | 15.3 | 44.1 | 40.7 |
Wages and Benefits | 1.7 | 0.0 | 11.9 | 78.0 | 10.2 |
Input Costs | 1.7 | 5.6 | 15.5 | 70.7 | 13.8 |
Prices Received for Services | –24.5 | –18.5 | 5.3 | 64.9 | 29.8 |
Operating Margin | –39.7 | –24.0 | 6.9 | 46.6 | 46.6 |
| Indicator | Current Index | Previous Index | % Reporting Improved | % Reporting No Change | % Reporting Worsened |
Company Outlook | –22.4 | –14.8 | 13.8 | 50.0 | 36.2 |
| Indicator | Current Index | Previous Index | % Reporting Increase | % Reporting No Change | % Reporting Decrease |
Uncertainty | 44.0 | 25.4 | 52.5 | 39.0 | 8.5 |
Business Indicators: Year/Year
| Business Indicators: All Firms Current Quarter (versus same quarter a year ago) | |||||
| Indicator | Current Index | Previous Index | % Reporting Increase | % Reporting No Change | % Reporting Decrease |
Level of Business Activity | 0.0 | 1.3 | 36.4 | 27.2 | 36.4 |
Capital Expenditures | –10.0 | –1.3 | 29.6 | 30.8 | 39.6 |
Supplier Delivery Time | –10.7 | –3.3 | 3.2 | 82.9 | 13.9 |
Employment | –5.6 | –3.2 | 24.8 | 44.7 | 30.4 |
Employee Hours | –3.7 | –3.2 | 19.1 | 58.0 | 22.8 |
Wages and Benefits | 22.2 | 24.2 | 36.4 | 49.4 | 14.2 |
| Indicator | Current Index | Previous Index | % Reporting Improved | % Reporting No Change | % Reporting Worsened |
Company Outlook | –10.0 | –4.0 | 26.9 | 36.3 | 36.9 |
| Business Indicators: E&P Firms Current Quarter (versus same quarter a year ago) | |||||
| Indicator | Current Index | Previous Index | % Reporting Increase | % Reporting No Change | % Reporting Decrease |
Level of Business Activity | 9.5 | 6.8 | 38.1 | 33.3 | 28.6 |
Oil Production | 21.2 | 18.4 | 46.2 | 28.8 | 25.0 |
Natural Gas Wellhead Production | 13.3 | 16.7 | 37.1 | 39.0 | 23.8 |
Capital Expenditures | –2.9 | 0.0 | 35.0 | 27.2 | 37.9 |
Expected Level of Capital Expenditures Next Year | –12.3 | –8.9 | 29.2 | 29.2 | 41.5 |
Supplier Delivery Time | –8.7 | 0.0 | 3.9 | 83.5 | 12.6 |
Employment | –4.8 | 0.0 | 24.0 | 47.1 | 28.8 |
Employee Hours | –1.9 | 0.0 | 14.3 | 69.5 | 16.2 |
Wages and Benefits | 24.7 | 28.0 | 37.1 | 50.5 | 12.4 |
Finding and Development Costs | –23.6 | –11.0 | 9.4 | 57.5 | 33.0 |
Lease Operating Expenses | 0.9 | 8.0 | 22.6 | 55.7 | 21.7 |
| Indicator | Current Index | Previous Index | % Reporting Improved | % Reporting No Change | % Reporting Worsened |
Company Outlook | 3.8 | 2.1 | 33.3 | 37.1 | 29.5 |
| Business Indicators: O&G Support Services Firms Current Quarter (versus same quarter a year ago) | |||||
| Indicator | Current Index | Previous Index | % Reporting Increase | % Reporting No Change | % Reporting Decrease |
Level of Business Activity | –17.6 | –9.5 | 33.3 | 15.8 | 50.9 |
Utilization of Equipment | –16.1 | –11.6 | 32.1 | 19.6 | 48.2 |
Capital Expenditures | –23.3 | –3.7 | 19.6 | 37.5 | 42.9 |
Supplier Delivery Time | –14.6 | –9.7 | 1.8 | 81.8 | 16.4 |
Lag Time in Delivery of Firm's Services | –5.5 | –15.6 | 3.6 | 87.3 | 9.1 |
Employment | –7.0 | –9.4 | 26.3 | 40.4 | 33.3 |
Employment Hours | –7.0 | –9.4 | 28.1 | 36.8 | 35.1 |
Wages and Benefits | 17.6 | 17.0 | 35.1 | 47.4 | 17.5 |
Input Costs | 1.7 | 11.6 | 19.6 | 62.5 | 17.9 |
Prices Received for Services | –21.9 | –13.5 | 14.5 | 49.1 | 36.4 |
Operating Margin | –41.8 | –23.1 | 9.1 | 40.0 | 50.9 |
| Indicator | Current Index | Previous Index | % Reporting Improved | % Reporting No Change | % Reporting Worsened |
Company Outlook | –36.4 | –15.7 | 14.5 | 34.5 | 50.9 |
Fourth Quarter | December 27, 2019
Activity Chart
Fourth Quarter | December 27, 2019
Comments from Survey Respondents
These comments are from respondents’ completed surveys and have been edited for publication. Comments from the Special Questions survey can be found below the special questions.
Exploration and Production (E&P) Firms
- The capital markets for oil and gas remain extremely difficult. The risk appetites of the banks for energy lending are much lower.
- Capital is limited in terms of third-party non-operator investment. Capital investments in 2020 will be based on “in-house” equity funding and little, if any, on debt. We will be acquiring existing production, drilling only lease-required development wells, and will not be drilling any exploratory wells.
- We have a guarded outlook on oil and natural gas prices for 2020 and are intending to curtail any new exploration during 2020.
- We have noticed an uptick in comments by acquaintances associating our business with the global-warming narrative. We can see this eventually raising our costs of doing business.
- It is a very challenging operating environment for smaller E&P operators and oilfield service firms; the service quality of these smaller oilfield service firms may suffer. Viability of some oilfield service firms is a concern due to financial concerns. Operators will want to work with fewer, more financially stable and safer suppliers.
- Small upstream oil and gas operators may find it increasingly difficult to schedule drilling and completion services as consolidation of service companies continues to occur. Shale development via horizontal drilling continues to slow down and, absent commodity price increases, will probably continue to slow during 2020. Also, it appears that Tier I acreage, as presently identified, has been exploited for the most part. Current weak commodity prices are a significantly negative factor as to whether there will be sufficient capital available to enable Tier II acreage to be developed.
- We are having to divest properties in order to keep from dropping employees.
- I have noticed a significant investment decrease by oil and gas professionals. This may be partially attributed to the serious erosion of investment capital in listed securities. Many nonconventional shale wells are not achieving production expectations, thereby constricting cash flow for new wells and projects. Natural gas prices are insufficient to justify reworking old wells, which further constrains cash flows. The future seems uncertain.
- The market is very favorable for firms looking to acquire conventional assets due to continued moderately weak oil prices, high deal volume, credit and private equity availability, and generally negative sentiment regarding the oil and gas industry.
- There is a lack of liquidity from energy lenders as they have reduced advance rates on reserves and are sensitive to leverage above three times on a reserve-based loan.
- The capital infusion has all but ceased for small E&P companies with regard to developing properties. Our company has conveyed its operations to other working interest owners and maintained certain non-operated working interests. We are looking at marketing the balance of our oil and gas properties in 2021.
- Continued weak oil prices and high costs are squeezing my margins. It is very difficult to find any projects that make sense economically. I am getting increasingly selective on what deals in which I will invest. Increasing regulatory pressure in Colorado has resulted in a complete loss in value of wells in that state, and in my mind, it has become a “no investment” state. The very hostile government there totally ignored the expressed wishes of the citizens of Colorado, which was expressed at the ballot box.
- Henry Hub gas and NYMEX West Texas Intermediate oil index prices are now meaningless to me as purchaser deductions have brought the real-world price to $1.60 per million cubic feet (Mcf) in West Texas and Central Oklahoma. Major new worries are starting to be operator solvency/bankruptcy. Many non-operated working interest owners are going non-consent, which is a sign of low oil and gas prices and/or lack of available capital. Oil and gas purchasers are generally nonresponsive to questions; we can’t reach them by phone, and automated web-based question input screens go many days before a response [comes], if any.
- White House politics and gamesmanship are totally destabilizing for energy investments. I am disgusted and embarrassed by many aspects of what has transpired. The financial industry’s headlong push to finance anything and everything Permian, and/or anything horizontal shale dominated is leaving solid, money-making conventional projects without access to capital or investment. Wall Street (a broad inclusive term for the financial communities) typically goes headlong after a new fad every five years or so. In the ’80s, it was the savings and loan; ’90s, Enron; 2000s, dot-com; 2005–08, subprime housing loans—and now it is this total infatuation with shale at the exclusion of real money-making investments in conventional projects. The shortsightedness is destroying real value and makes this industry appear to be a bad investment. Wall Street is often a significant component of the problem and needs to be more constructively managed.
- Current gas basis differentials have significant implications for our business outlook.
- Trump winning the election next November will make all the difference in the economic world.
- The biggest issue currently is takeaway limitations in the Permian Basin. There is way too much flaring of natural gas.
- With supply remaining static (as Permian wells deplete so rapidly) and demand deteriorating, we’re in for a long slog.
- While there is still uncertainty in the marketplace, we believe that the prices will stabilize somewhat in 2020. We also believe that there will be a drop in overall production which will help the supply-and-demand issue.
- With commodity markets saturated, prices will continue long-term declines—or with activity declining in the unconventional sector, demand could outstrip supply, and commodity prices will increase. A lot depends on OPEC. Thus, uncertainty is high. This is what 43 years in the exploration business has taught me.
- It feels like the price of oil is firming up a bit. This seems contrary as oilfield supplies are more available. Trucks are more available, and employees seem to be more available.
- I expect natural gas prices to remain seasonal, with considerable downward pressure throughout 2020. Subsidized renewables add to the problem and ironically encourage flaring and venting of natural gas.
- The continued low natural gas price will start to impact activity if it continues.
Oil and Gas Support Services Firms
- Investor demands on E&P companies are restricting U.S. lower 48 activity despite a stable oil price environment. We expect an increase in contracted U.S. lower 48 rigs during the first half of 2020, driven by replenished capital expenditure budgets. Softening natural gas prices combined with mild weather are putting downward pressure on natural gas prices.
- Access to capital for the oil and gas industry is the main driver of uncertainties for our business. The current trends in customer demands on our equipment (hydraulic fracturing) versus the prices our customers are willing to pay are unsustainable.
- Offshore/International is looking good. The U.S. seems like it is engaged in a self-fulfilling prophecy about the impending 2020 downturn. We aren’t seeing that in our business, except with the large service companies. Small-to-midcap firms seem okay, and sales are moving along nicely. Perhaps larger companies were overextended.
- Development work is holding; however, exploration and new prospects have fallen sharply.
- We are concerned about the price of natural gas.
- There is an oversupply of oilfield services for onshore activity, which is reducing margins.
- Supply on the world market remains unpredictable. Venezuelan crude has seen a recent increase in supply as somehow [President Nicolás] Maduro continues to hang on. The big question is how long OPEC is going to support the U.S. oil and gas industry by artificially inflating the price of oil. My guess is that eventually OPEC, and particularly the Saudis, will have had enough and will try to keep U.S. oil and gas production down once the Saudi Aramco initial public offering is done. There are so many other factors at play: the world economy, the U.S. economy, the Chinese economy, Mexico and its leftist president, the unforgivable flaring of natural gas by the millions of Mcfs, pipeline construction, etc.
- The outlook for North American onshore seismic has worsened significantly; our customers are only interested in spending dollars where absolutely necessary and only when that investment will produce a return in the very short term. Our company will try and weather the storm by reducing both cost and capital expenditures in 2020, and we are hoping we are wrong, such that we can increase our investments if the downturn reverses later in 2020.
- We are a private technology provider in the oilfield services (OFS) segment. We are exposed to the international (outside U.S.) markets, and in our particular product line, there are several projects expected to be approved next year. In that respect, we are doing better. The macro OFS segment is suffering, though, and we hope to avoid that for 2020.
- The U.S. oil patch is constrained mainly by artificially low pricing; a modest uptick in pricing, which I expect, coupled with companies remaining disciplined on production with an eye toward return to shareholders, will benefit the whole market materially.
- As a small company of two doing trucking for oil and gas companies, [we find that] things are getting tight. I am concerned that the oil and gas companies’ requirements for my work are getting more expensive, which only larger trucking companies can financially handle.
Questions regarding the Dallas Fed Energy Survey can be addressed to Michael Plante at Michael.Plante@dal.frb.org or Kunal Patel at Kunal.Patel@dal.frb.org.
Sign up for our email alert to be automatically notified as soon as the latest Dallas Fed Energy Survey is released on the web.