Dallas Fed Energy Survey

Fourth Quarter | December 30, 2020
Oil and Gas Activity on the Rebound, Outlook Improves
What’s New This Quarter
Special questions this quarter focus on capital spending in 2021, the oil price that firms are using for budgeting, expectations for a consolidation among exploration and production (E&P) firms, plans for reducing greenhouse emissions, expectations for the upcoming reserve-based lending redetermination, and shifts in the revenue mix for oil and gas support services firms.
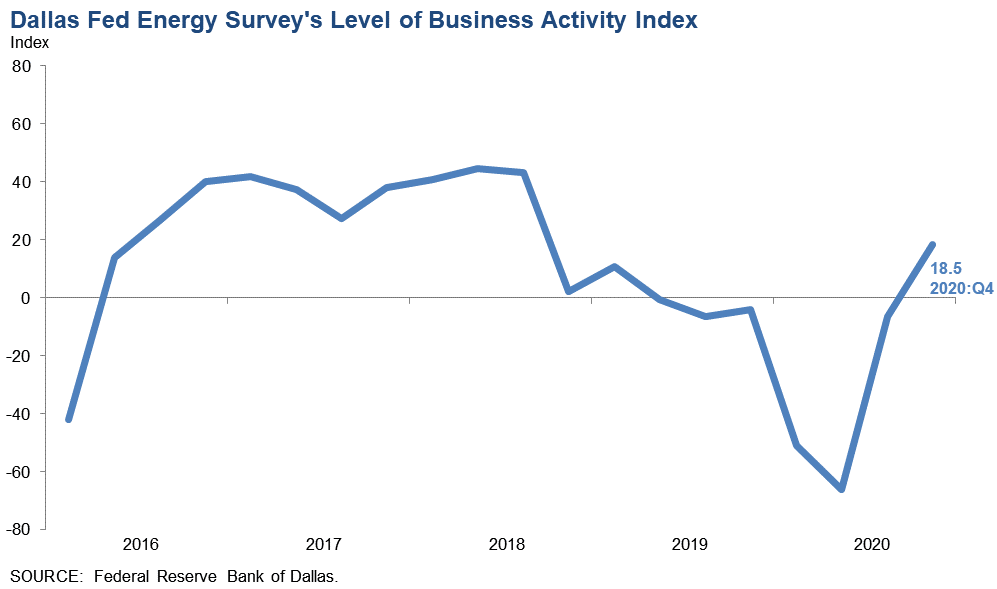
Activity in the oil and gas sector jumped in fourth quarter 2020, according to oil and gas executives responding to the Dallas Fed Energy Survey. The business activity index—the survey’s broadest measure of conditions facing Eleventh District energy firms—moved into positive territory, rising from -6.6 in the third quarter to 18.5 in the fourth quarter. This is the first positive reading for the business activity index since first quarter 2019, with the increase driven by both E&P and oilfield services firms.
According to E&P executives, oil production stabilized after three quarters of decline, with the index rising from -15.4 to 1.0 in the fourth quarter. The natural gas production index increased eight points to -2.1. The near-zero readings for both indexes indicate oil and gas production was fairly flat in the fourth quarter.
The index for capital expenditures by E&P firms moved into positive territory at 12.5, up from -16.4 in the third quarter, indicating an increase in capital spending. Meanwhile, the index for capital expenditures by oilfield services firms increased but remained negative, rising from -35.1 to -6.2. This suggests that, while capital spending continued to decline, the pace of decline slowed notably in the fourth quarter.
Oilfield services firms saw improvement in some indicators. The equipment utilization index pushed into positive territory, jumping 25 points to 6.4 in the fourth quarter. This was the first positive reading since second quarter 2019. However, operating margins continued to decline, with the index holding fairly steady at -31.9. The index of prices received for services remained negative and edged lower, from -26.4 to -29.7. The index for input costs remained negative but ticked higher, from -9.5 to -4.3.
Employment continued to decline, but layoffs abated somewhat. The aggregate employment index posted a seventh consecutive negative reading but moved up from -18.1 to -11.7. The index of aggregate employee hours worked also remained negative but increased from -15.3 to -6.9, and the index for aggregate wages and benefits edged up from -19.4 to -12.4.
Six-month outlooks improved notably, with the index rising from 1.9 last quarter to 21.6. This is a stark recovery from the significantly negative readings in first and second quarter 2020. Additionally, firms noted less uncertainty around their outlook this quarter than last; the aggregate uncertainty index fell 31 points to -13.8. This is the lowest reading for the uncertainty index since its inception in first quarter 2017.
On average, respondents expect a West Texas Intermediate (WTI) oil price of $50 per barrel by year-end 2021; responses ranged from $35 to $70 per barrel. Survey participants expect Henry Hub natural gas prices of $2.76 per million British thermal units (MMBtu) at year-end. For reference, WTI spot prices averaged $47 per barrel during the survey collection period, and Henry Hub spot prices averaged $2.60 per MMBtu.
Next release: March 24, 2021
|
Data were collected on Dec. 9–17, and 146 energy firms responded. Of the respondents, 97 were exploration and production firms and 49 were oilfield services firms. The Dallas Fed conducts the Dallas Fed Energy Survey quarterly to obtain a timely assessment of energy activity among oil and gas firms located or headquartered in the Eleventh District. Firms are asked whether business activity, employment, capital expenditures and other indicators increased, decreased or remained unchanged compared with the prior quarter and with the same quarter a year ago. Survey responses are used to calculate an index for each indicator. Each index is calculated by subtracting the percentage of respondents reporting a decrease from the percentage reporting an increase. When the share of firms reporting an increase exceeds the share reporting a decrease, the index will be greater than zero, suggesting the indicator has increased over the previous quarter. If the share of firms reporting a decrease exceeds the share reporting an increase, the index will be below zero, suggesting the indicator has decreased over the previous quarter. |
Fourth Quarter | December 30, 2020
Price Forecasts
West Texas Intermediate Crude
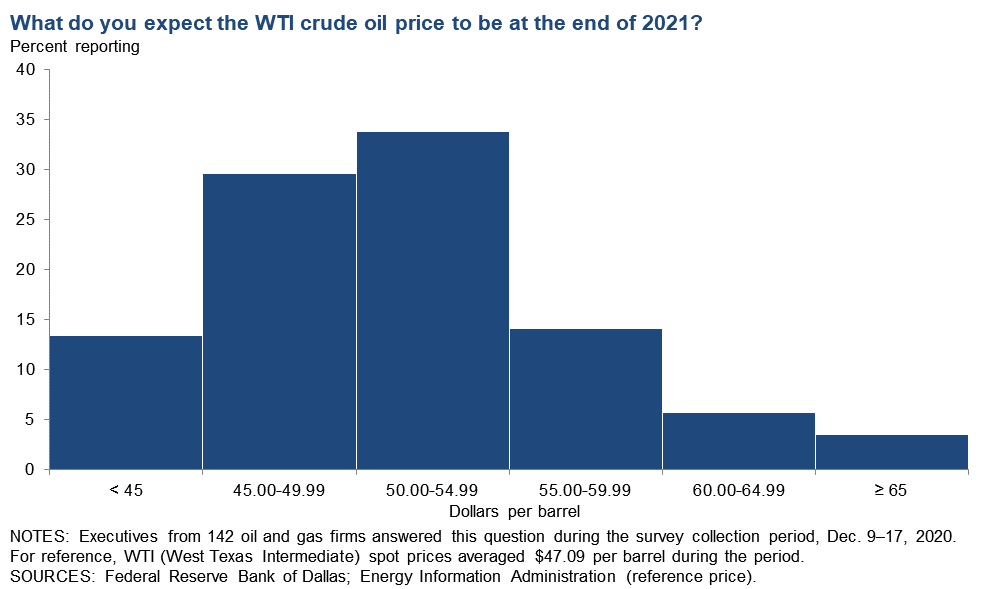
| West Texas Intermediate crude oil price (dollars per barrel), year-end 2021 | ||||
| Indicator | Survey Average | Low Forecast | High Forecast | Price During Survey |
Current quarter | $49.77 | $35.00 | $70.00 | $47.09 |
Prior quarter | N/A | N/A | N/A | N/A |
| NOTE: Price during survey is an average of daily spot prices during the survey collection period. SOURCES: Energy Information Administration; Federal Reserve Bank of Dallas. | ||||
Henry Hub Natural Gas
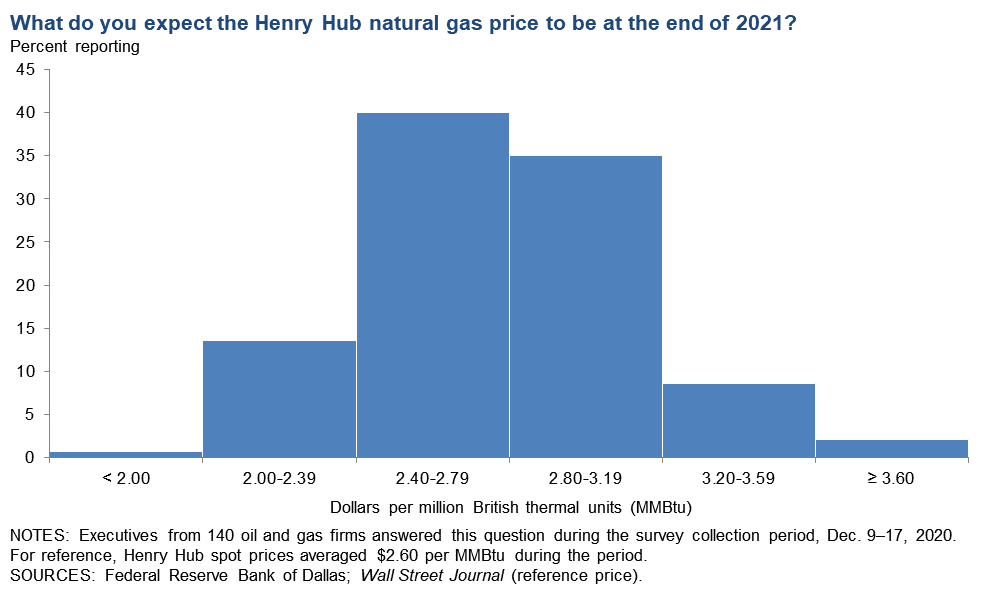
| Henry Hub natural gas price (dollars per MMBtu), year-end 2021 | ||||
| Indicator | Survey Average | Low Forecast | High Forecast | Price During Survey |
Current quarter | $2.76 | $1.75 | $4.70 | $2.60 |
Prior quarter | N/A | N/A | N/A | N/A |
| NOTE: Price during survey is an average of daily spot prices during the survey collection period. SOURCES: Federal Reserve Bank of Dallas; Wall Street Journal. | ||||
Fourth Quarter | December 30, 2020
Special Questions
Data were collected Dec. 9–17; 146 oil and gas firms responded to the special questions survey.
All Firms
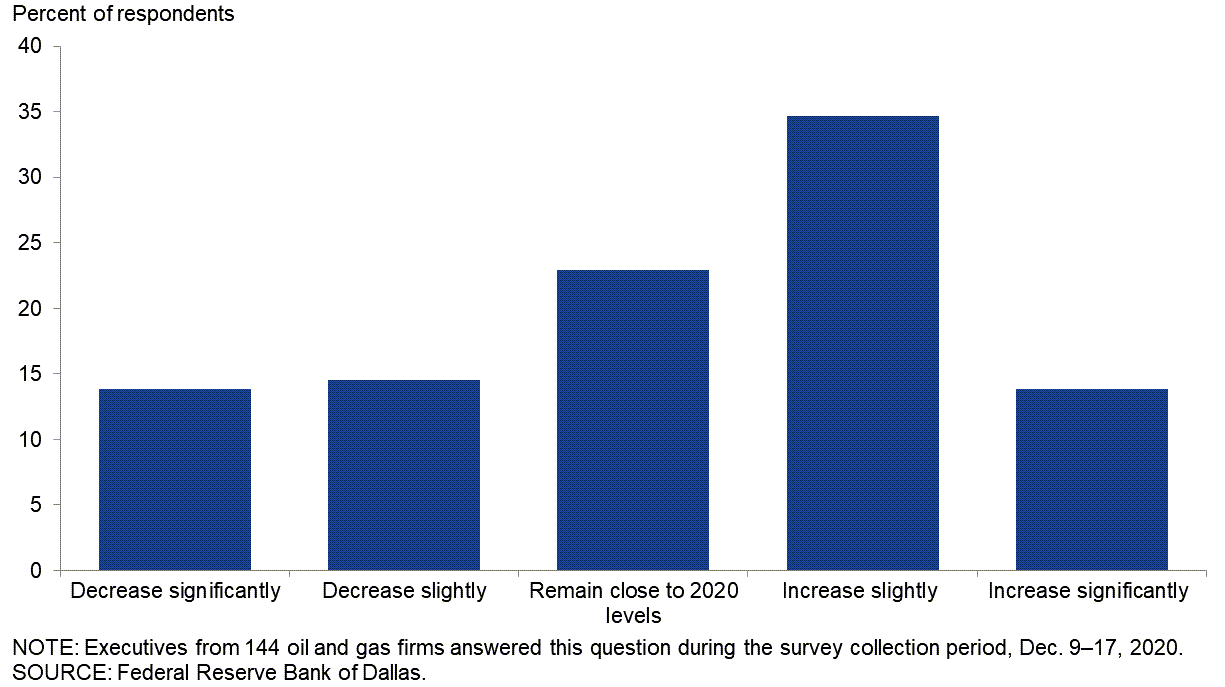
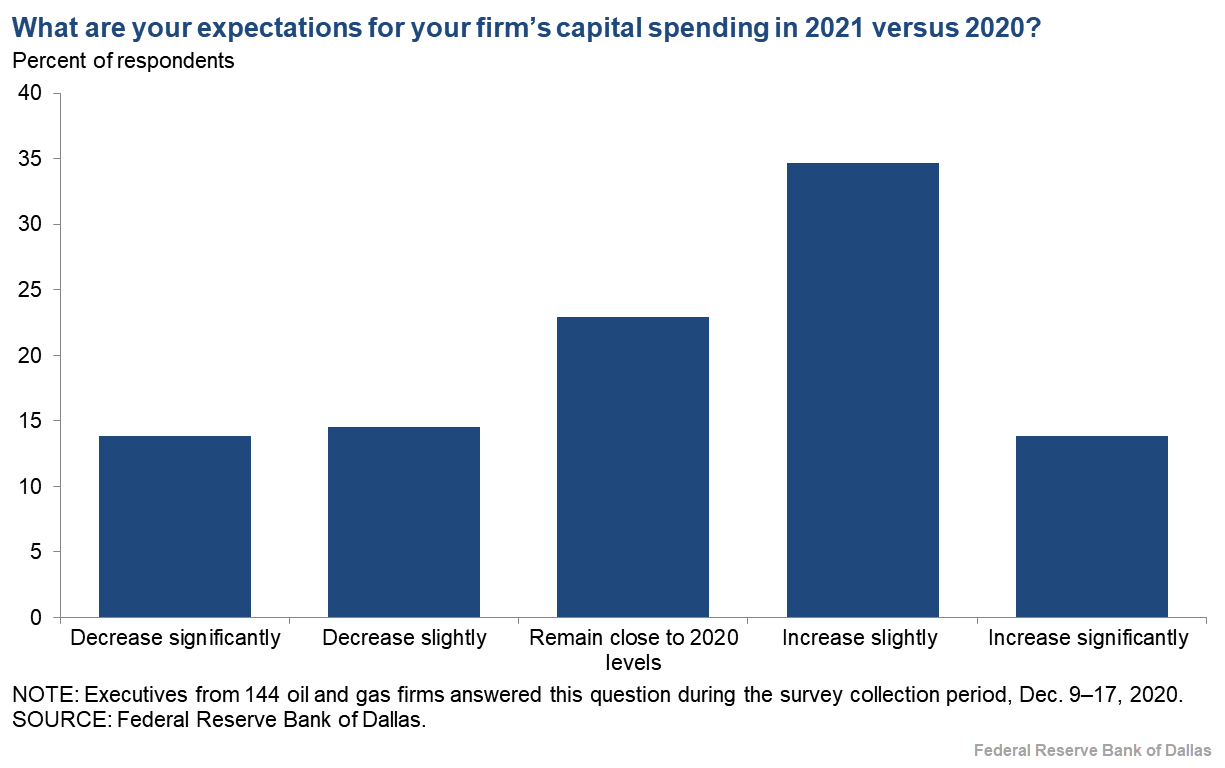
What are your expectations for your firm’s capital spending in 2021 versus 2020?
More respondents expect their firm’s capital spending to increase next year rather than decrease. Thirty-five percent of executives said they expect capital spending will slightly increase, while an additional 14 percent anticipate a significant increase. Twenty-three percent expect spending to remain near 2020 levels in 2021. Fifteen percent expect their firm’s capital spending to decrease slightly, and an additional 14 percent anticipate it to decrease significantly.
A breakdown of the data for exploration and production (E&P) versus oil and gas support services can be found in the table below.
| Response | Percent of Respondents | ||
| All | E&P | Services | |
| Increase significantly | 14 | 18 | 6 |
| Increase slightly | 35 | 32 | 40 |
| Remain close to 2020 levels | 23 | 21 | 27 |
| Decrease slightly | 15 | 16 | 13 |
| Decrease significantly | 14 | 14 | 15 |
| NOTES: Executives from 96 exploration and production firms and 48 oil and gas support services firms answered this question during the survey collection period, Dec. 9-17, 2020. The “All” column reports the percentage out of the total 144 responses. Percentages may not sum to 100 due to rounding. SOURCE: Federal Reserve Bank of Dallas. |
|||
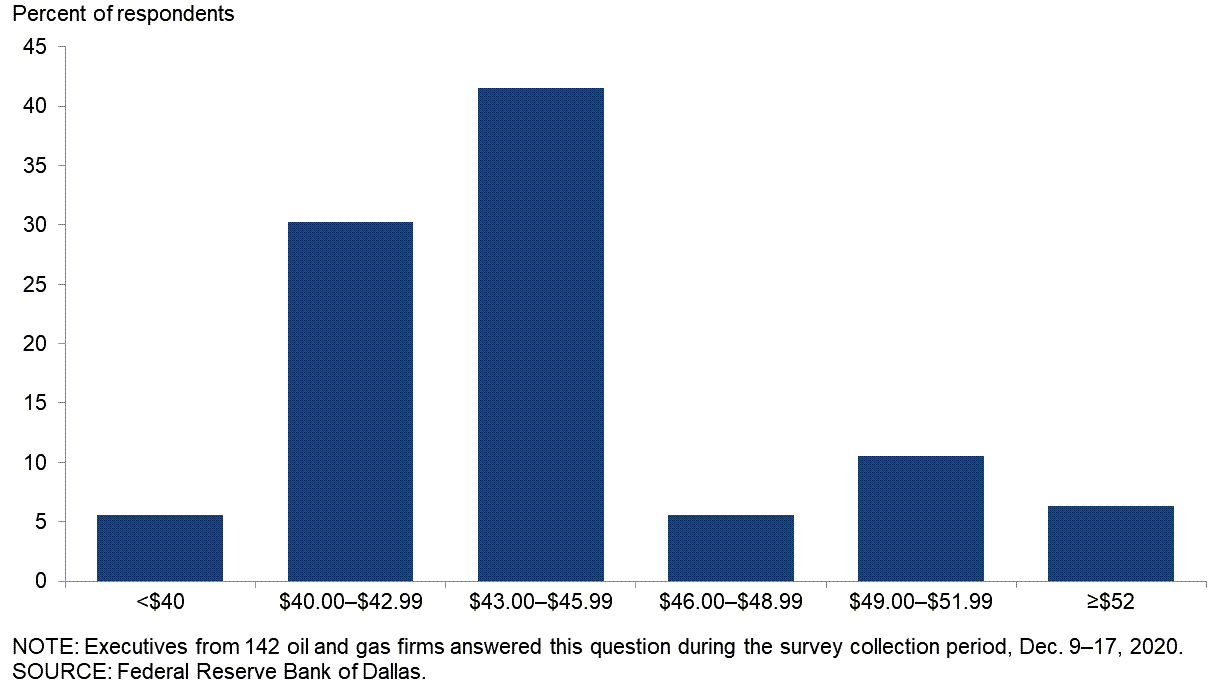
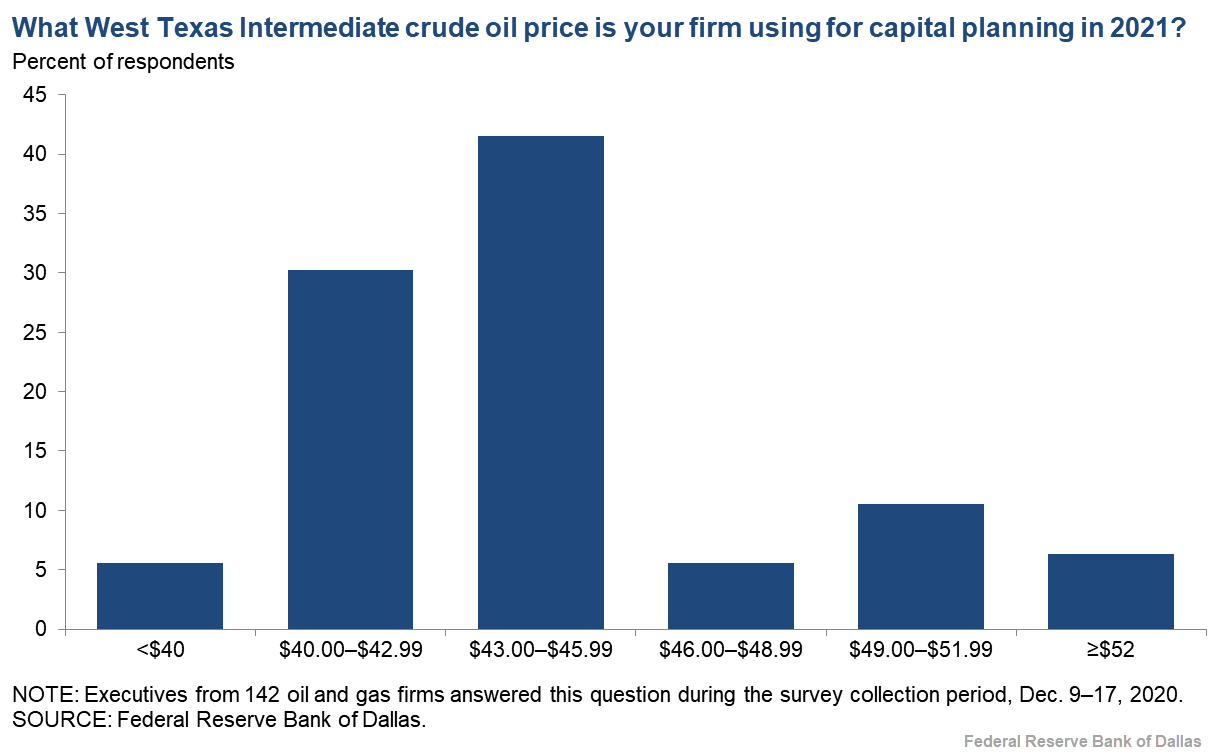
What West Texas Intermediate crude oil price is your firm using for capital planning in 2021?
For this special question, executives were asked to provide the WTI price they used for planning their capital expenditures in 2021. The average response was $44 per barrel, with the median and the mode at $45 per barrel.
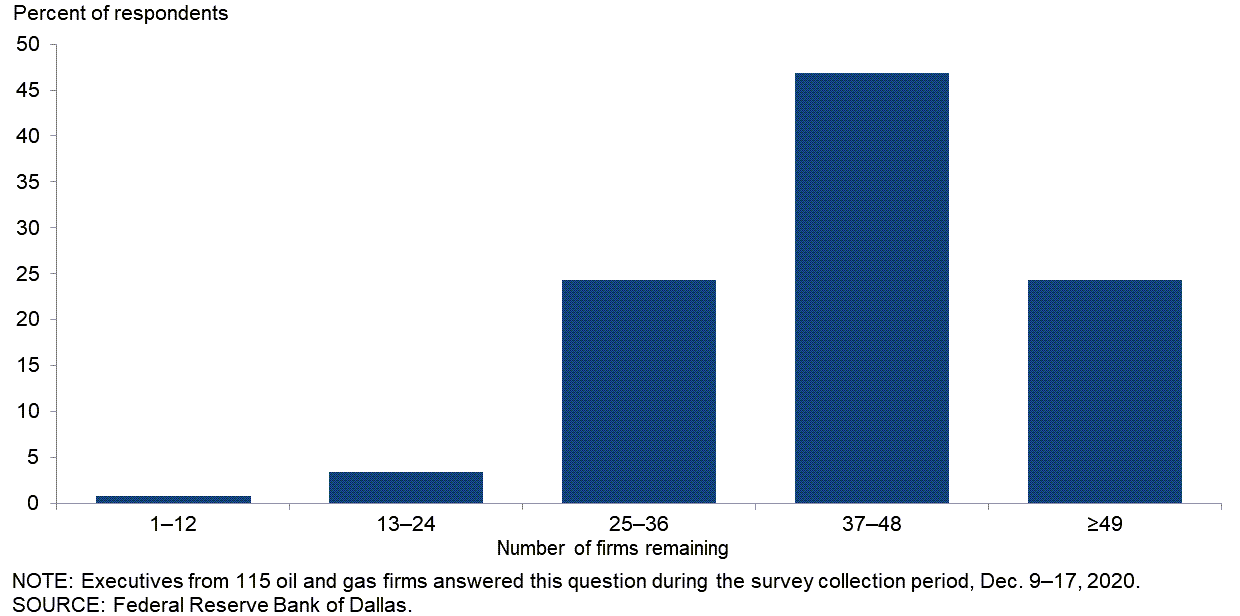
There are about 60 publicly listed independent E&P firms in the U.S. There has been a recent wave of mergers and acquisitions. How many of these firms do you think will remain by the end of 2022?
Forty-seven percent of executives said they think 37 to 48 publicly listed independent E&P firms will remain by year-end 2022. Twenty-four percent of executives think 25 to 36 firms will remain, and 24 percent believe more than 49 will survive. Three percent anticipate 13 to 24 firms, and 1 percent predicted that between one and 12 firms will remain.
Exploration and Production (E&P) Firms
Which of the following plans does your firm have? (Check all that apply.)
E&P firms were first asked to classify themselves based on fourth quarter 2020 crude oil production and then asked if they had any of the following plans: to reduce carbon emissions; reduce methane emissions; reduce flaring; recycle/reuse water. Respondents could choose more than one answer for this special question. Firms were classified as “small” if they produced less than 10,000 barrels per day (b/d) or “large” if they produced 10,000 b/d or more. In the U.S., small E&P firms are greater in number, but large E&P firms make up the majority of production (greater than 80 percent).
For the larger firms, 50 percent of executives noted that their firm plans to reduce CO2 emissions, 50 percent plan to reduce methane emissions, 63 percent plan to reduce flaring, and 67 percent plan to recycle/reuse water.
For the smaller firms, 10 percent of executives said their firm plans to reduce CO2 emissions, 30 percent plan to reduce methane emissions, 27 percent plan to reduce flaring, and 21 percent plan to recycle/reuse water. Among the smaller E&P firms, 54 percent said they don’t have any mitigation plans, compared with 17 percent of large E&P firms.
| Response | Percent of Respondents | ||
| Small firms | Large firms | All firms | |
| Plan to reduce CO2 emissions | 10 | 50 | 21 |
| Plan to reduce methane emissions | 30 | 50 | 36 |
| Plan to reduce flaring | 27 | 63 | 37 |
| Plan to recycle/reuse water | 21 | 67 | 33 |
| None of the above | 54 | 17 | 44 |
| NOTES: Executives from 63 small exploration and production firms and 24 large exploration and production firms answered this question during the survey collection period, Dec. 9-17, 2020. The “All firms” column reports the percentage out of the total 87 responses. Small firms produced less than 10,000 b/d in fourth quarter 2020, while large firms produced 10,000 b/d or more. SOURCE: Federal Reserve Bank of Dallas. |
|||
By how much do you expect your firm to reduce greenhouse gas emissions from 2020 to 2025 in terms of barrel-of-oil equivalent produced?
Of the large firms, 21 percent said their firm plans to reduce greenhouse gas emissions by 10 percent or more by 2025. Of the remaining firms, 8 percent of respondents reported planned reductions of more than 7.5 percent but not more than 10 percent; 4 percent of respondents provided a range of more than 5 percent but not more than 7.5 percent; 17 percent of respondents put the range at more than 2.5 percent but not more than 5 percent; 4 percent reported no planned decreases.
The majority of large firms producing 100,000 b/d or more (not shown in the table) plan to reduce greenhouse gas emissions by more than 10 percent.
Among the executives of small firms, 1 percent said their firm plans to reduce greenhouse gas emissions by more than 10 percent by 2025. An additional 1 percent put the range at more than 7.5 percent but not more than 10 percent, 1 percent cited a range of more than 5 percent but not more than 7.5 percent, 9 percent said more than 2.5 percent but not more than 5 percent, 16 percent gave a range of more than zero but not more than 2.5 percent and 22 percent said they didn’t plan to decrease emissions.
Among small E&P firms, 49 percent reported they were unsure of their plans, and among large firms, 46 percent were unsure.
| Response | Percent of Respondents | ||
| Small firms | Large firms | All firms | |
| 0% | 22 | 4 | 17 |
| More than 0% but not more than 2.5% | 16 | 0 | 12 |
| More than 2.5% but not more than 5% | 9 | 17 | 11 |
| More than 5% but not more than 7.5% | 1 | 4 | 2 |
| More than 7.5% but not more than 10% | 1 | 8 | 3 |
| More than 10% | 1 | 21 | 6 |
| Don’t know | 49 | 46 | 48 |
| NOTES: Executives from 69 small exploration and production firms and 24 large exploration and production firms answered this question during the survey collection period, Dec. 9-17, 2020. The “All firms” column reports the percentage out of the total 93 responses. Small firms produced less than 10,000 b/d in fourth quarter 2020, while large firms produced 10,000 b/d or more. Percentages may not sum to 100 due to rounding. SOURCE: Federal Reserve Bank of Dallas. |
|||
Do you anticipate any changes to your firm’s reserve-based lending conditions at the next redetermination? (Check all that apply.)
Executives at E&P firms were first asked if their firm has a reserve-based loan (RBL). Of the executives that noted their firm has an RBL, 71 percent anticipate that the upcoming redetermination will have changes in price deck valuations. A total of 46 percent believes there will be changes in advance rates on proved developed producing (PDP), proved developed nonproducing and/or proved undeveloped reserves. Another 24 percent anticipate their RBL shifting to a term loan on PDP reserves, and 20 percent anticipate no change. Respondents could choose more than one answer for this special question.
| Response | Percent of Respondents |
| Yes, changes in price deck valuations | 71 |
| Yes, changes in advance rates on proved developed producing (PDP), proved developed nonproducing and/or proved undeveloped reserves | 46 |
| Yes, reserved-based lending shifting to term loan on PDP reserves | 24 |
| No changes expected | 20 |
| NOTE: Executives from 41 exploration and production firms answered this question during the survey collection period, Dec. 9-17, 2020. This question was only posed to firms that have a reserve-based loan. SOURCE: Federal Reserve Bank of Dallas. |
|
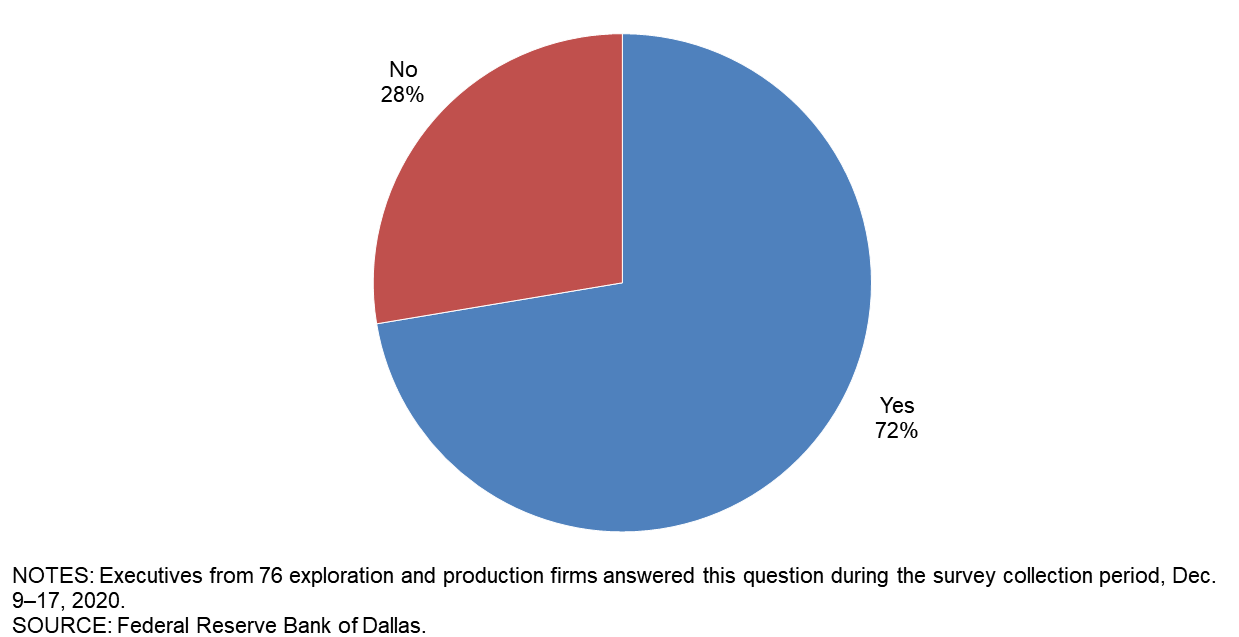
If necessary, do you expect your firm will be able to access capital from nonbank sources over the next 12 months?
This question was posed to all E&P executives, irrespective of whether their firm has an RBL. A majority of executives—72 percent—said they expect their firm will have access to capital from nonbank sources over the next 12 months. The remaining 28 percent do not believe their firm will have such access.
Oil and Gas Support Services
Currently, what percentage of your firm’s revenue do you generate from providing services related to alternative energy (such as offshore/onshore wind, solar, geothermal, hydrogen, and carbon capture use and storage)?
This question was only posed to executives at oil and gas support services firms. The majority—82 percent—said their firm generates none of its revenue from providing services related to alternative energy. An additional 13 percent said more than 0 percent but not more than 20 percent, and the remaining 4 percent reported more than 20 percent but not more than 40 percent.
| Response | Percent of Respondents | ||
| 0% | 82 | ||
| More than 0% but not more than 20% | 13 | ||
| More than 20% but not more than 40% | 4 | ||
| More than 40% but not more than 60% | 0 | ||
| More than 60% but not more than 80% | 0 | ||
| More than 80% | 0 | ||
| NOTES: Executives from 45 oil and gas support services firms answered this question during the survey collection period, Dec. 9-17, 2020. Percentages may not sum to 100 due to rounding. SOURCE: Federal Reserve Bank of Dallas. |
|||
What percentage of your firm’s revenue do you expect to generate from providing services related to alternative energy (such as offshore/onshore wind, solar, geothermal, hydrogen, and carbon capture use and storage) at the end of 2025?
Slightly more than half of executives—55 percent—said they expect their firm to generate none of its revenue from alternative energy services at year-end 2025. An additional 36 percent expect more than 0 but not more than 20 percent from such services, and 5 percent of firms anticipate more than 20 percent but not more than 40 percent. The remaining 5 percent of executives indicated more than 40 percent but not more than 60 percent.
| Response | Percent of Respondents | ||
| 0% | 55 | ||
| More than 0% but not more than 20% | 36 | ||
| More than 20% but not more than 40% | 5 | ||
| More than 40% but not more than 60% | 5 | ||
| More than 60% but not more than 80% | 0 | ||
| More than 80% | 0 | ||
| NOTES: Executives from 44 oil and gas support services firms answered this question during the survey collection period, Dec. 9-17, 2020. Percentages may not sum to 100 due to rounding. SOURCE: Federal Reserve Bank of Dallas. |
|||
Special Questions Comments
Exploration and Production (E&P) Firms
- In addition to the oil price outlook for setting a budget, it is also very important to think about service costs. We look at $45 per barrel for the budget with current service prices, but $50–$55 per barrel with a 10–15 percent increase in service prices in order to continue our current activity.
- RBLs [reserve-based lending] used to be a valuable industry tool until the financial markets all went berserk and gaga over "all things and everything Permian" or shale. Money for any other basins or areas and especially for conventional development was just "eliminated" from the conversation. Significant money was "churned" for over 10 years by lots of companies engaged in development of shale. Zero-percent money is not creating a healthy industry; it merely means that big financial providers and huge corporations can play games with free money. Independent producers, unless you already had assets, or flocked to play the shale world, were and are left out. It has not been very healthy for the industry. How might the available money be redirected to be more widely available and applied? I am focused on making money, and I have no desire to just churn zero-percent interest loans and, frankly, like I said above, RBLs are not readily available unless one was and/or is engaged in development of shale. "No-cost money" simply enables publicly traded companies to appear successful to investors when in reality they churn money for management and financial groups and leave stockholders short of any real returns. Unfortunately, that churning has created and supported many significantly weak entities as is obvious from the bankruptcies, restatements of reserves and mergers, which are merely covering up the poor state of affairs in certain parts of the industry.
- E&P and supplier consolidation needs to increase to reduce substantial costs from the system. Suppliers continue to pass savings to operators from their internal cost cutting and debt reduction efforts.
- The pullback of traditional reserve-based lending continues. The exit by a large bank will be felt in the coming years. The ongoing reduction of capital access is likely a serious problem.
- In my opinion, "green energy" is being overhyped. I anticipate a lot of "pushback" from special interest groups against the future use of substantial areas of land being used for solar and wind generation. I expect oil production from shale to decrease to around 7 million barrels per day as production in the Gulf of Mexico decreases from the current approximately 2 million barrels per day. These decreases should offset the return of Iran and Libya oil to the markets. Continued good Asian oil demand will support prices. All these factors should allow oil prices in the low $50s in 2021.
- Our company does not drill new wells, so our growth is achieved through acquisition of under-operated properties. We are generally indifferent on commodity prices for those acquisitions since we heavily hedge the prices we take. The destruction of investor capital through drilling has seriously impacted the amount of outside capital available for our strategy.
- Our equity sponsor and management are investing additional equity in the company, without which, the banks will not allow us to drill.
- All of our oil and gas production is outside-operated (i.e., operated by others), hence I can't speak for those operators in terms of their goals and plans for CO2 and methane and other greenhouse gas emissions, as well as flaring and water recycling plans. They don't communicate such data to working interest owners.
Oil and Gas Support Services Firms
- We are beginning to make investments in the energy transition space.
Additional Comments »
Fourth Quarter | December 30, 2020
Historical data are available from first quarter 2016 to the most current release quarter.
Business Indicators: Quarter/Quarter
| Business Indicators: All Firms Current Quarter (versus previous quarter) | |||||
| Indicator | Current Index | Previous Index | % Reporting Increase | % Reporting No Change | % Reporting Decrease |
Level of Business Activity | 18.5 | –6.6 | 37.0 | 44.5 | 18.5 |
Capital Expenditures | 6.3 | –22.6 | 29.2 | 47.9 | 22.9 |
Supplier Delivery Time | –0.7 | –11.2 | 7.0 | 85.2 | 7.7 |
Employment | –11.7 | –18.1 | 9.0 | 70.3 | 20.7 |
Employee Hours | –6.9 | –15.3 | 12.4 | 68.3 | 19.3 |
Wages and Benefits | –12.4 | –19.4 | 5.5 | 76.6 | 17.9 |
| Indicator | Current Index | Previous Index | % Reporting Improved | % Reporting No Change | % Reporting Worsened |
Company Outlook | 21.6 | 1.9 | 44.6 | 32.4 | 23.0 |
| Indicator | Current Index | Previous Index | % Reporting Increase | % Reporting No Change | % Reporting Decrease |
Uncertainty | –13.8 | 17.2 | 22.8 | 40.7 | 36.6 |
| Business Indicators: E&P Firms Current Quarter (versus previous quarter) | |||||
| Indicator | Current Index | Previous Index | % Reporting Increase | % Reporting No Change | % Reporting Decrease |
Level of Business Activity | 16.5 | –9.9 | 35.1 | 46.4 | 18.6 |
Oil Production | 1.0 | –15.4 | 30.9 | 39.2 | 29.9 |
Natural Gas Wellhead Production | –2.1 | –10.1 | 25.3 | 47.4 | 27.4 |
Capital Expenditures | 12.5 | –16.4 | 36.5 | 39.6 | 24.0 |
Expected Level of Capital Expenditures Next Year | 24.0 | –9.0 | 39.6 | 44.8 | 15.6 |
Supplier Delivery Time | –2.1 | –13.9 | 6.3 | 85.3 | 8.4 |
Employment | –13.4 | –23.2 | 5.2 | 76.3 | 18.6 |
Employee Hours | –8.2 | –19.8 | 9.3 | 73.2 | 17.5 |
Wages and Benefits | –14.4 | –19.6 | 3.1 | 79.4 | 17.5 |
Finding and Development Costs | –21.9 | –32.8 | 2.1 | 74.0 | 24.0 |
Lease Operating Expenses | –12.5 | –27.5 | 10.4 | 66.7 | 22.9 |
| Indicator | Current Index | Previous Index | % Reporting Improved | % Reporting No Change | % Reporting Worsened |
Company Outlook | 25.3 | 9.6 | 46.2 | 33.0 | 20.9 |
| Indicator | Current Index | Previous Index | % Reporting Increase | % Reporting No Change | % Reporting Decrease |
Uncertainty | –22.9 | 22.1 | 19.8 | 37.5 | 42.7 |
| Business Indicators: O&G Support Services Firms Current Quarter (versus previous quarter) | |||||
| Indicator | Current Index | Previous Index | % Reporting Increase | % Reporting No Change | % Reporting Decrease |
Level of Business Activity | 22.4 | 0.0 | 40.8 | 40.8 | 18.4 |
Utilization of Equipment | 6.4 | –18.9 | 27.7 | 51.1 | 21.3 |
Capital Expenditures | –6.2 | –35.1 | 14.6 | 64.6 | 20.8 |
Supplier Delivery Time | 2.1 | –5.7 | 8.5 | 85.1 | 6.4 |
Lag Time in Delivery of Firm's Services | –4.3 | –9.4 | 2.1 | 91.5 | 6.4 |
Employment | –8.3 | –7.4 | 16.7 | 58.3 | 25.0 |
Employment Hours | –4.1 | –5.7 | 18.8 | 58.3 | 22.9 |
Wages and Benefits | –8.4 | –18.9 | 10.4 | 70.8 | 18.8 |
Input Costs | –4.3 | –9.5 | 10.6 | 74.5 | 14.9 |
Prices Received for Services | –29.7 | –26.4 | 4.3 | 61.7 | 34.0 |
Operating Margin | –31.9 | –30.8 | 8.5 | 51.1 | 40.4 |
| Indicator | Current Index | Previous Index | % Reporting Improved | % Reporting No Change | % Reporting Worsened |
Company Outlook | 14.6 | –13.2 | 41.7 | 31.3 | 27.1 |
| Indicator | Current Index | Previous Index | % Reporting Increase | % Reporting No Change | % Reporting Decrease |
Uncertainty | 4.1 | 7.4 | 28.6 | 46.9 | 24.5 |
Business Indicators: Year/Year
| Business Indicators: All Firms Current Quarter (versus same quarter a year ago) | |||||
| Indicator | Current Index | Previous Index | % Reporting Increase | % Reporting No Change | % Reporting Decrease |
Level of Business Activity | –52.9 | –77.3 | 12.1 | 22.9 | 65.0 |
Capital Expenditures | –54.7 | –70.0 | 8.6 | 28.1 | 63.3 |
Supplier Delivery Time | –16.8 | –21.6 | 6.6 | 70.1 | 23.4 |
Employment | –36.9 | –53.3 | 9.9 | 43.3 | 46.8 |
Employee Hours | –34.6 | –47.5 | 8.6 | 48.2 | 43.2 |
Wages and Benefits | –38.3 | –43.8 | 8.5 | 44.7 | 46.8 |
| Indicator | Current Index | Previous Index | % Reporting Improved | % Reporting No Change | % Reporting Worsened |
Company Outlook | –37.0 | –60.2 | 21.3 | 20.5 | 58.3 |
| Business Indicators: E&P Firms Current Quarter (versus same quarter a year ago) | |||||
| Indicator | Current Index | Previous Index | % Reporting Increase | % Reporting No Change | % Reporting Decrease |
Level of Business Activity | –52.1 | –74.3 | 10.9 | 26.1 | 63.0 |
Oil Production | –50.5 | –53.3 | 14.0 | 21.5 | 64.5 |
Natural Gas Wellhead Production | –34.0 | –40.5 | 17.6 | 30.8 | 51.6 |
Capital Expenditures | –53.8 | –68.9 | 11.0 | 24.2 | 64.8 |
Expected Level of Capital Expenditures Next Year | –29.6 | –52.4 | 22.0 | 26.4 | 51.6 |
Supplier Delivery Time | –14.4 | –18.1 | 6.7 | 72.2 | 21.1 |
Employment | –35.5 | –44.0 | 8.6 | 47.3 | 44.1 |
Employee Hours | –28.6 | –32.7 | 8.8 | 53.8 | 37.4 |
Wages and Benefits | –37.6 | –37.0 | 6.5 | 49.5 | 44.1 |
Finding and Development Costs | –45.6 | –53.8 | 3.3 | 47.8 | 48.9 |
Lease Operating Expenses | –45.0 | –47.6 | 6.6 | 41.8 | 51.6 |
| Indicator | Current Index | Previous Index | % Reporting Improved | % Reporting No Change | % Reporting Worsened |
Company Outlook | –29.8 | –52.6 | 25.0 | 20.2 | 54.8 |
| Business Indicators: O&G Support Services Firms Current Quarter (versus same quarter a year ago) | |||||
| Indicator | Current Index | Previous Index | % Reporting Increase | % Reporting No Change | % Reporting Decrease |
Level of Business Activity | –54.2 | –83.3 | 14.6 | 16.7 | 68.8 |
Utilization of Equipment | –61.7 | –86.8 | 8.5 | 21.3 | 70.2 |
Capital Expenditures | –56.2 | –72.2 | 4.2 | 35.4 | 60.4 |
Supplier Delivery Time | –21.3 | –28.9 | 6.4 | 66.0 | 27.7 |
Lag Time in Delivery of Firm's Services | –17.0 | –35.8 | 4.3 | 74.5 | 21.3 |
Employment | –39.6 | –72.2 | 12.5 | 35.4 | 52.1 |
Employment Hours | –45.9 | –77.3 | 8.3 | 37.5 | 54.2 |
Wages and Benefits | –39.6 | –57.4 | 12.5 | 35.4 | 52.1 |
Input Costs | –32.0 | –42.3 | 10.6 | 46.8 | 42.6 |
Prices Received for Services | –57.5 | –71.7 | 2.1 | 38.3 | 59.6 |
Operating Margin | –56.5 | –76.4 | 6.5 | 30.4 | 63.0 |
| Indicator | Current Index | Previous Index | % Reporting Improved | % Reporting No Change | % Reporting Worsened |
Company Outlook | –51.1 | –74.5 | 14.0 | 20.9 | 65.1 |
Fourth Quarter | December 30, 2020
Activity Chart
Fourth Quarter | December 30, 2020
Comments from Survey Respondents
These comments are from respondents’ completed surveys and have been edited for publication. Comments from the Special Questions survey can be found below the special questions.
Exploration and Production (E&P) Firms
- We continue to see oilfield equipment and services in circulation even after bankruptcies and financial restructuring. Demand for services is increasing, but an oversupplied market has created a low-price environment for oilfield services, with high competition among suppliers.
- Drillers insisting on bringing rigs back and additional production online will continue to destroy investor dollars consistent with pre-pandemic negative returns, and as a result, accelerate the exodus of capital from our sector. Production needs to be allowed to go lower, and companies need to shift their business models to be more economic producers.
- The uncertainty with the economy is worrisome. Our ability to push through the downturn (i.e., survive) is allowing this small independent exploration and production firm to consummate three acquisitions from reluctant and/or difficult partners. Our activity in 2021 will increase significantly as a result. Lack of money and/or financial support makes it very difficult for small companies to move operations forward. We are looking forward to the new year and a more responsible administration in Washington.
- We are making progress with our bank group and equity sponsor to get through the pandemic and extend our credit and invest new equity to enable restarting drilling and completing wells.
- The Federal Reserve’s interest rate policies have harmed the energy complex. At the beginning of zero interest rate policy, the cost of capital for E&P was lowered to a point where firms drilled far too much, leading to a massive supply glut (and large job losses). Because their fixed income returns were so low, institutional investors needed to park capital in “creative” ways, which led to a massive bubble in private equity capital. Now, with so many companies failing, banks refuse to clear the deck and take a loss because they cannot earn interest on new loans to any other customers. When banks take assets to a bankruptcy auction, they can expect 80 percent or more in losses on their capital but can only loan that capital back out at 3 to 4 percent; what banker is in a hurry to make that decision? This zombification of companies ensures that capital is not being directed to its highest and best use. We are seeing the cycle repeat in renewables now. There are 40 special purpose acquisition companies with $11 billion this year for clean energy. These policies are leading us down a path of economic destruction in almost every industry, and we may look like Japan in no time.
- We anticipate domestic crude oil production to decrease due to the number of consolidations among public companies resulting in staffing reductions, private equity firms no longer deploying capital and the number of bankruptcies in the oil and gas sector. All these factors will have a dampening effect on supply. On the demand side, I see improvement with the pending release of the COVID-19 vaccine, potential additional stimulus by the Federal Reserve and consumer sentiments. We are a consuming economy and historically there has been a surge in consumption following an economic downturn.
- While the Trump administration gave a big shot in the arm to the industry regarding access and easing up on restrictions, I think the Biden administration will actually help increase commodity prices by reversing that trend.
- What position the new administration will assume toward drilling and operating on federal oil and gas leases, especially the timely granting of new permits, will impact our company.
- The continued underinvestment by local Permian power utility and cooperatives leads to persistent lack of power delivery to field operation sites. The result is far higher power expenses due to use of localized power generation in gas-fired engines or turbines. The power infrastructure is not meeting the needs of industry, and power connected at field sites has only marginally improved across the Permian during a time of materially reduced activity. This leads to great concern that any increase in development activity in 2021 will be curtailed by lack of power.
- My oil and gas price expectation I gave for year-end 2021 is a price on the New York Mercantile Exchange (NYMEX), which doesn't compare well to reality. Differentials from NYMEX and the prices in our checks from Oklahoma, West Texas and South Texas are all large, so NYMEX is still a dream! Tight-to-no margins are putting "ethical" pressures on smaller operators as well as oil and gas purchasers. There are lots of spurious charges going into joint interest billings (JIB) by operators, and "error" rates are increasing, causing us to look at every JIB and oil and gas check, resulting in refunds and additional revenue payments every month because operators or purchasers are cutting corners, acting "shady," or workers are getting sloppy or all of the above. Working from home (WFH) may also be impacting the "purity" of numbers. I'm starting to see more "legal actions" than before, which usually happens in the depths of each oil and gas price decline. Maybe WFH explains why it's so hard to get anybody to "fix" the issues you report to them (errors or suspicious entries in JIBs, or errors in checks from purchasers or deliveries from suppliers). Getting other people’s errors and/or problems corrected is a more frequent and frustrating activity, but if you don't do it, you're leaving a lot of potential "margin" on the floor, even if that "margin" is red! I'm noticing that it's getting harder to get communications (return calls or texts, replies to e-mails or responses of any kind to mailed letters) from operators and oil and gas purchasers alike, especially the smaller companies. Maybe it's a combination of COVID, WFH, staff reductions and bankruptcies, but that's taking a lot of time too.
- We see continuing optimism fueling some greater activity in 2021.
- The regulation environment for carbon fuels appears to be increasingly aggressive with Democrats. For example, there is legislation aimed at carbon reduction to zero levels by 2025.
- We are optimistic that we will have a weaning of excess oil supply, and more importantly, suppliers of oil and gas, and that will lead to a slightly higher sustainable price.
- The sluggish oil demand and low prices are making it harder to put deals together.
- The outcome of the presidential election will make a difference in the energy sector. Regulations will increase when Biden is in the White House. That will cause oil and gas production to decrease. The price of oil and gas will increase. Trump would have increased oil demand through his policies of cutting regulations and after the vaccine takes effect on the population. China will take over again when Biden gets into the White House.
- Despite the current forecast for a warm Northern Hemisphere winter, we are optimistic that the price of natural gas will be firm over the next year owing to rising natural gas demand and climate concerns. We are not optimistic about the oil price in 2021 given abundant oil supply and given oil demand that will return slowly, with some not returning at all.
- The investors of our firm have decided to wind down the company.
Oil and Gas Support Services Firms
- I believe lower oil prices driven by global oversupply and the intense focus on free cash flow and uses of that free cash flow by our customers (E&P companies) will drive under-investment in upstream E&P capital expenditures in 2021 compared to prior recoveries. Assuming COVID-19 mitigation measures are successful and global oil demand continues to increase, oil prices should begin to move higher in second-half 2021 as the supply-demand imbalance we will see in 2022 and beyond will begin to come into focus.
- It is becoming increasingly difficult to remain positive regarding the industry the farther we go into this pandemic. Couple that with uncertainty of a new administration and the picture really clouds up. On the upside, we have seen some increased activity in our areas of concentration, so it appears that more and more firms are figuring out a way to make money at current prices and conditions. I do hope the old adage "having gone through this will make us that much stronger when we exit the other end " holds true!
- Although I state that my outlook has worsened, it is only short term in my opinion. I am beginning to see some "light at the end of the tunnel," and I don't believe it to be a freight train. I can see that some of my work projects are closer to coming back online, and I look forward to providing you different answers regarding our outlook in the future!
- It’s pretty bad out there. The industry is struggling to define what we look like (opportunities and investments) in the future. There is much on hold currently as this transition gets worked out, but we should have development sometime in 2021.
- Our company has benefited from the government-funded Paycheck Protection Program, but we all desperately need another one to get to the end of the road—and better times and increased revenues.
- The demand for oilfield services is slightly improving onshore in the United States; however, the offshore and international markets are still flat to trending down.
- It doesn’t look like there is any end in sight.
- Our business has increased through all of 2020. Our outlook is good. We expect to keep growing at a good pace, and good employees are easier to come by. We are optimistic about the future!
- I'm seeing activity increasing in December, but it's too early to tell if it is sustainable.
- We closed one division down which had been in business since 2003. We laid off roughly 200 employees this quarter, mainly due to COVID-19 and the election.
- COVID-19 is still the driver.
- It is impossible to predict prices for oil or gas. Oil is still wrapped up in Soviet–Saudi relations, and the basic factors have not changed. Despite the manipulation of supply by OPEC-plus, we have real decreased oil demand and real oil oversupply. The natural gas price will probably depend on the severity of winter.
- We don't feel like we can guess future oil and gas prices.
Questions regarding the Dallas Fed Energy Survey can be addressed to Michael Plante at Michael.Plante@dal.frb.org or Kunal Patel at Kunal.Patel@dal.frb.org.
Sign up for our email alert to be automatically notified as soon as the latest Dallas Fed Energy Survey is released on the web.